Left Ventricular Diastolic Dysfunction
Assessment with Dual-Source CT
Zhaoying Wen1, Heng Ma2, Ying Zhao3, Zhanming Fan1, Zhaoqi Zhang1, Sang Il Choi4, Yeon Hyeon Choe5, Jiayi Liu1*
1Department of Radiology, Beijing Anzhen Hospital, Capital Medical University, Beijing Institute of Heart, Lung and Blood Vessel Diseases, Beijing, China,2Department of Radiology, Yuhuangding Hospital, Yantai, Shandong Province, China,3Department of Echocardiology, Beijing Anzhen Hospital, Capital Medical University, Beijing Institute of Heart, Lung and Blood Vessel Diseases, Beijing, China,4Department of Radiology, Seoul National University Bundang Hospital, Seoul, Republic of Korea,5Department of
Radiology and Cardiovascular and Stroke Imaging Center, Heart Vascular Stroke Institute, Samsung Medical Center, Sungkyunkwan University School of Medicine, Seoul, Korea
Abstract
Purpose
To assess the impact of left ventricular (LV) diastolic dysfunction on left atrial (LA) phasic volume and function using dual-source CT (DSCT) and to find a viable alternative prognos-tic parameter of CT for LV diastolic dysfunction through quantitative evaluation of LA phasic volume and function in patients with LV diastolic dysfunction.
Materials and Methods
Seventy-seven patients were examined using DSCT and Doppler echocardiography on the same day. Reservoir, conduit, and contractile function of LA were evaluated by measuring LA volume (LAV) during different cardiac phases and all parameters were normalized to body surface area (BSA). Patients were divided into four groups (normal, impaired relaxa-tion, pseudonormal, and restrictive LV diastolic filling) according to echocardiographic find-ings. The LA phasic volume and function in different stages of LV diastolic function was compared using one-way ANOVA analysis. The correlations between indexed volume of LA (LAVi) and diastolic function in different stages of LV were evaluated using Spearman correlation analysis.
Results
LA ejection fraction (LAEF), LA contraction, reservoir, and conduit function in patients in im-paired relaxation group were not different from those in the normal group, but they were
lower in patients in the pseudonormal and restrictive LV diastolic dysfunction groups (P<
0.05). For LA conduit function, there were no significant differences between the patients in
the pseudonormal group and restrictive filling group (P= 0.195). There was a strong
correla-tion between the indexed maximal left atrial volume (LAVmax, r = 0.85,P<0.001), minimal
left atrial volume (LAVmin, r = 0.91,P<0.001), left atrial volume at the onset of P wave
OPEN ACCESS
Citation:Wen Z, Ma H, Zhao Y, Fan Z, Zhang Z, Choi SI, et al. (2015) Left Ventricular Diastolic Dysfunction Assessment with Dual-Source CT. PLoS ONE 10(5): e0127289. doi:10.1371/journal. pone.0127289
Academic Editor:Elena Cavarretta, Sapienza University of Rome, ITALY
Received:January 20, 2015
Accepted:April 14, 2015
Published:May 18, 2015
Copyright:© 2015 Wen et al. This is an open access article distributed under the terms of the
Creative Commons Attribution License, which permits unrestricted use, distribution, and reproduction in any medium, provided the original author and source are credited.
Data Availability Statement:All relevant data are within the paper and its Supporting Information files.
(LAVp, r = 0.84,P<0.001), and different stages of LV diastolic function. The LAVi increased as the severity of LV diastolic dysfunction increased.
Conclusions
LA remodeling takes place in patients with LV diastolic dysfunction. At the same time, LA phasic volume and function parameters evaluated by DSCT indicated the severity of the LV diastolic dysfunction. Quantitative analysis of LA phasic volume and function parameters using DSCT could be a viable alternative prognostic parameter of LV diastolic function.
Introduction
The left atrium serves as a reservoir, conduit, and booster pump during the cardiac cycle [1]. With its reservoir, conduit, and contractile functions, the left atrium plays an integral role in cardiac performance by modulating LV filling [2]. As the LV diastolic function deteriorates, the diastolic pressure in the left ventricle increases [3]. In order to preserve adequate LV filling pressure, the LA pressure and wall tension increase, and eventually the size of the left atrium increases [3]. It has been demonstrated that there is significant correlation between LAV and LV diastolic dysfunction [4]. However, almost all the results about LAV and LV diastolic dys-function have been reported in studies involving echocardiography [5–9]. To date, there is no report about LAV and LV diastolic dysfunction evaluated by CT, and neither the relationship between LA phasic function and LV diastolic dysfunction has been evaluated by CT.
Coronary CT angiography (CCTA) examination has been widely used in clinical settings. Information regarding cardiac function can also be collected as a by-product of CCTA and can be used to evaluate heart function accurately [10–12]. In addition, LA phasic volume and func-tion evaluafunc-tion and informafunc-tion of coronary artery trees can be collected in one scan without additional radiation or contrast medium using CCTA examination. The advantage of DSCT coronary angiography is that it can reduce the dose exposure using DSCT ECG-gated tube cur-rent modulation technique for all the patients, as was previously recommended [13]. A previ-ous study had demonstrated that it produces accurate and reproducible results in the
assessment of LA volume and function using DSCT [10,14,15]. In most studies involving the CT evaluation of LA, the LA maximum volume, LA minimum volume and LAEF are usually evaluated, but LA phasic volume and function are seldom assessed by CT [16,17].
To date, there has been no report regarding the relationship of LA phasic volume and func-tion with LV diastolic dysfuncfunc-tion using DSCT measurement. The purpose of this study was to assess the impact of LV diastolic dysfunction on LA phasic volume and function using DSCT and to find a viable alternative prognostic parameter of CT for LV diastolic dysfunction through quantitative evaluation of LA phasic volume and function in patients with LV diastolic dysfunction.
Materials and Methods
Ethics statement
The study protocols and written informed consent forms were approved by the local ethics committee of Beijing Anzhen Hospital associated with Capital Medical University in China. Written informed consent for information to be used for the study was obtained from all participating patients.
sdnsf.gov.cn/portal/, Shandong Province Natural Science Foundation, HM; grant numbers: 2012090, Yantai City Science and Technology Development Plan, HM; grant numbers: 81200166, the URLs:
http://isisn.nsfc.gov.cn/egrantindex/funcindex/ prjsearch-list, National Natural Science Foundation Of China, YZ; The funders had no role in study design, data collection and analysis, decision to publish, or preparation of the manuscript.
Study population
Those patients who were referred for a clinically indicated CCTA were prospectively enrolled for possible participation in this study. The patients with arrhythmias, cardiac valvular heart diseases, congenital heart diseases, or implanted pacemakers or defibrillators were excluded. Additionally, patients were excluded if they could not undergo CCTA examination because of renal dysfunction (serum creatinine levels higher than 1.5 mg/dl) or a previous allergic reaction to iodinated contrast media. Only patients with normal LV systolic function were included (LVEF>50%). A total of 77 patients (42 men and 35 women; mean age, 53.99 ± 12.90 years)
met the study’s inclusion criteria. Of these, 49 had hypertension, 7 had history of myocardial infarction, 15 had coronary artery disease, and 26 had diabetes mellitus. For all the included pa-tients, Doppler echocardiography was performed after CT on the same day. The subjects’heart rates were continuously monitored throughout image acquisition by two modalities. No addi-tional ß-blockers were administered in the current study.
Echocardiographic imaging
A commercially available system, Philips IE33, was used for imaging. Pulsed wave (PW) Dopp-ler and tissue DoppDopp-ler (TD) were obtained using a S5-1 electronic transducer (1.7–3.4 MHz) and data were obtained from apical four-chamber view [18]. PW Doppler sample volume was placed parallel to the mitral valve flow to obtain Peak velocities of mitral inflows in early diasto-le (E), peak velocities of mitral inflows in atrial systodiasto-le (A), and decediasto-leration time of the E-wave velocity (DT). The E/A ratio was then calculated. The early diastolic mitral annular peak veloci-ties of septal side (e0s) and early diastolic mitral annular peak velocities of lateral side (e0l) were measured at the level of the mitral annulus using tissue Doppler imaging. The average of e0s and e0l (em) and the average E/e0of two side of mitral annulus (Av. E/e0) were then calcu-lated. All echocardiographic parameters were measured online, and the average among 2 to 3 cardiac cycles was calculated.
Classification of left ventricular diastolic function
The LV diastolic function was divided into four groups according to the recommendations for the Evaluation of Left Ventricular Diastolic Function by the American Society of Echocardiogra-phy and European Society of EchocardiograEchocardiogra-phy [19]. If e0s8 cm/s, e0l10 cm/s, E/A>1, and 160<DT<200 ms, LV diastolic function was defined as normal, If e0s<8 cm/s, e0l<
10 cm/s, and em<8 cm/s, then LV diastolic function was divided into an impaired relaxation
group (grade I) (E/A<0.8, Av.E/e08 cm/s, and DT>200 ms); pseudonormal filling group
(grade II) (0.8<E/A<1.5, 9 cm/s<Av.E/e012 cm/s, and 160<DT<200 ms); restrictive
filling group (grades III and IV) (E/A2, Av.E/e0
13 cm/s, and DT<160 ms).
DSCT imaging
CT examination was performed using a 64-slice DSCT scanner (Somatom Definition, Siemens Medical Solutions, Forchheim, Germany). The scanning range covered the entire heart from 1 cm below the level of the tracheal bifurcation to the diaphragm. A 50–75 ml bolus of Iopami-dol 370 (Bracco, Shanghai, China) followed by 20 ml of saline solution was continuously in-jected into an antecubital vein at a rate of 4–5 ml/s via a dual-head power injector (Stellant; Medrad, Indianola, PA, U.S.). The CT angiography was triggered automatically and image ac-quisition started 4 s after the attenuation reached the predefined threshold of 100 HU at the aortic root. The data were acquired in a craniocaudal direction with a tube voltage of 100 kV—
slice collimation of 2 × 32 × 0.6 mm, slice acquisition of 2 × 64 × 0.6 mm by means of a z-flying focal spot, detector collimation of 64 × 0.5 mm, a gantry rotation time of 330 ms, pitch of 0.2–
0.5 (depending on the heart rate), reconstructed slice thickness of 0.75 mm (at 0.4 mm incre-ments), and B26f kernels. Electrocardiography (ECG)-gated tube current modulation was used to reduce the required dose of radiation during scanning for all the patients, as recommended [13]. The estimated radiation dose in this study was about 6–10 mSv using this protocol. Retrospective ECG-gating was used to synchronize the data with the ECG, and 20 series of axial images were reconstructed every 5% of the R–R interval (0%–95%) with an effective slice thickness of 0.75 mm, a reconstruction increment of 0.4 mm and a field of view of 180 mm × 170 mm (matrix: 512 × 512). The images obtained at the onset of the P-wave on ECG were also reconstructed using the same parameters to obtain LAV before atrial active contrac-tion. All the reconstructed DSCT data were post-processed on a dedicated workstation (Multi Modality Work Place, CT 2008A, Siemens Medical Solutions, Forchheim, Germany).
Two independent observers with more than 5 years experience in cardiovascular imaging evaluated the images and measured the parameters of the left atrium. Assessment of the LAV was performed with a dedicated software package for cardiac function analysis (Circulation, Siemens Medical Solutions, Forchheim, Germany) with threshold-based region-growing 3D segmentation of the LA cavity. When necessary, the LA endocardial contours were manually corrected frame by frame on 360° rotational MPRs to make sure that all the CT images had a discernible cardiac cavity (Figs1and2). The atrial appendages and pulmonary veins were ex-cluded from the delineation of the LA endocardial border. The post-processing software auto-matically calculated the LA volumetric parameters. All the volumes were normalized to the body surface area (BSA).
Index of LAV and function
The left atrial function was defined as follows [20]:
1. left atrial reservoir function = (LAVmax—LAVmin)/LAVmin × 100%
2. left atrial conduit function = (LAVmax—LAVp)/LAVmax × 100%
3. left atrial active contractile function = (LAVp—LAVmin)/ LAVp × 100%
4. LAEF = (LAVmax—LAVmin)/LAVmax × 100%.
All the volumes were normalized to the body surface area (BSA). LAVmax = maximal left atrial volume
LAVmin = minimal left atrial volume
LAVp = left atrial volume at the onset of P wave LAEF = left atrial ejection fraction.
Statistical analysis
Results
1. Clinical characteristics of different diastolic function groups
The clinical characteristics and echocardiographic variables are listed inTable 1. The E value were significantly lower in the impaired relaxation group (P<0.001) and significantly higher
in the restrictive filling group (P0.01) than in the other 3 groups. On the contrary, the A value were significantly higher in the impaired relaxation group (P<0.001) and significantly
lower in the restrictive filling group (P0.05) than in the other 3 groups. There were signifi-cant differences in E/A ratios between the normal group and LV diastolic dysfunction groups and with the other 3 groups (P<0.01). In addition, e0s, e0l, and em were significantly lower in
LV diastolic dysfunction groups than in the normal (P<0.001). In the pseudonormal filling
group and restrictive filling group, the Av. E/e values were more pronounced than in the nor-mal group and impaired relaxation group (P<0.001). DT time was significantly greater in the
impaired relaxation group than in the other 3 groups (P<0.001), but DT time was
significant-ly lower in the restrictive filling group (P<0.001). LVEF>50% in all groups, but it was
signif-icantly lower in the pseudonormal filling group (P= 0.002) and restrictive filling group than in the normal group (P= 0.009).
Fig 1. 2D image of LA.Two-dimensional image illustrating how to delineate left atrial endocardium during postprocessing LA volume data.
2. Differences in LA reservoir, conduit, and contractile function in
different diastolic function groups measured by DSCT
The differences in LA reservoir, conduit, and contractile function in different diastolic function groups as measured by DSCT are given inTable 2. LA reservoir function was considerably lower in the pseudonormal group and restrictive filling group than in the impaired relaxation group and normal group (P<0.001). The LA reservoir function in restrictive filling group was
significantly lower than in the pseudonormal group (P<0.001). There was no significant
dif-ference between impaired relaxation group and normal group for left atrial reservoir function (P= 0.181). There was also no significant difference between impaired relaxation group and normal group for left atrial conduit function (P= 1.000). The LA conduit function in pseudo-normal group (P= 0.033) and in restrictive filling group (P<0.001) was significantly lower
than in normal group. The LA conduit function in restrictive filling group was significantly lower than in the impaired relaxation group (P= 0.001). There was no significant difference be-tween the impaired relaxation group and normal group for LA contractile function (P= 1.000). The LA contractile function in the pseudonormal group and restrictive filling group was signif-icantly lower than in the impaired relaxation group and normal group (P<0.001). The LA
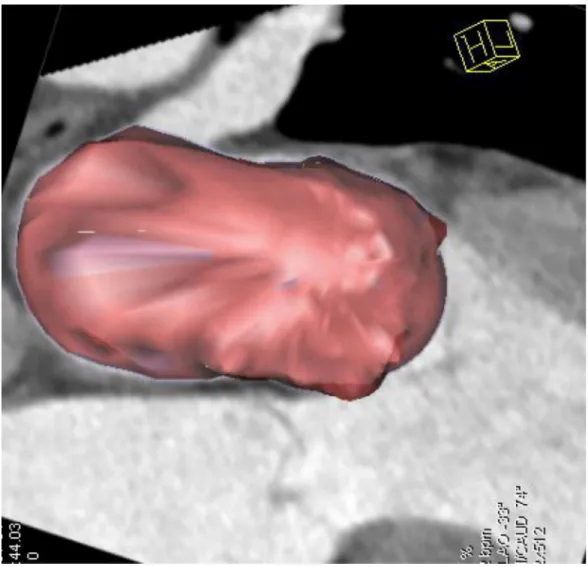
Fig 2. 2D and 3D fusion image of LA.The fusion image providing true 3D rendering of LA without taking any geometrical assumptions.
contractile function in the restrictive filling group was significantly lower than in the pseudo-normal group (P= 0.001). The indexed LAVmax, the indexed LAVmin, and the indexed LAVp in LV diastolic dysfunction groups were significantly higher than in the normal group (all Pvalues<0.05). The LA ejection fraction (LAEF) was lower in the impaired relaxation group
than in the normal group but not significantly so (P= 0.139). The LAEF was significantly lower in the pseudonormal group and restrictive filling group than in the normal group and impaired relaxation group (allPvalues0.001).
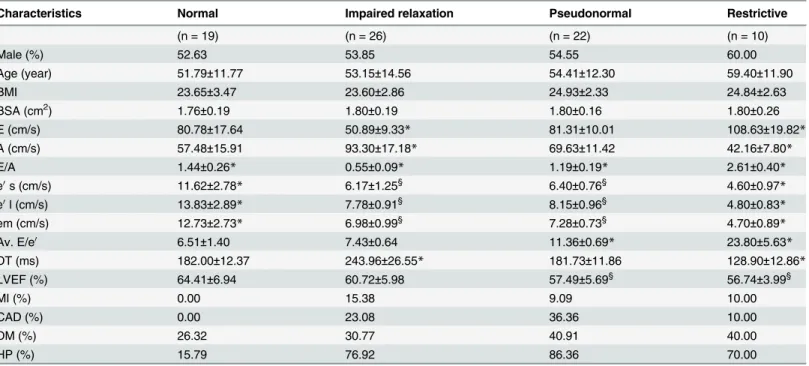
Table 1. Clinical characteristics and echocardiographic variables of the normal group and LV diastolic dysfunction groups.
Characteristics Normal Impaired relaxation Pseudonormal Restrictive
(n = 19) (n = 26) (n = 22) (n = 10)
Male (%) 52.63 53.85 54.55 60.00
Age (year) 51.79±11.77 53.15±14.56 54.41±12.30 59.40±11.90
BMI 23.65±3.47 23.60±2.86 24.93±2.33 24.84±2.63
BSA (cm2) 1.76±0.19 1.80±0.19 1.80±0.16 1.80±0.26
E (cm/s) 80.78±17.64 50.89±9.33* 81.31±10.01 108.63±19.82*
A (cm/s) 57.48±15.91 93.30±17.18* 69.63±11.42 42.16±7.80*
E/A 1.44±0.26* 0.55±0.09* 1.19±0.19* 2.61±0.40*
e0s (cm/s) 11.62±2.78* 6.17±1.25§
6.40±0.76§ 4.60±0.97*
e0l (cm/s) 13.83±2.89* 7.78±0.91§ 8.15±0.96§ 4.80±0.83
*
em (cm/s) 12.73±2.73* 6.98±0.99§ 7.28±0.73§ 4.70±0.89
*
Av. E/e0 6.51±1.40 7.43±0.64 11.36±0.69
* 23.80±5.63*
DT (ms) 182.00±12.37 243.96±26.55* 181.73±11.86 128.90±12.86*
LVEF (%) 64.41±6.94 60.72±5.98 57.49±5.69§ 56.74±3.99§
MI (%) 0.00 15.38 9.09 10.00
CAD (%) 0.00 23.08 36.36 10.00
DM (%) 26.32 30.77 40.91 40.00
HP (%) 15.79 76.92 86.36 70.00
MI: myocardial infarction; CAD: coronary artery disease; DM: diabetes mellitus; HP: systematic hypertension *P<0.05, relative to the other 3 groups,
§
P<0.05, relative to the normal group
doi:10.1371/journal.pone.0127289.t001
Table 2. Comparison of the LA volume and function among the 4 study groups.
LA volume and function Normal Impaired relaxation Pseudonormal Restrictive
(n = 19) (n = 26) (n = 22) (n = 10)
Indexed LAVmax (ml/m2) 23.32±5.10
* 32.83±5.77* 40.83±5.21* 52.14±9.05*
Indexed LAVmin(ml/m2) 9.00±2.33* 13.62±2.79* 23.32±4.37* 37.73±9.48*
Indexed LAVp (ml/m2) 16.15±3.99
* 23.39±4.20* 31.30±6.15* 43.49±10.95*
LAEF (%) 61.57±4.43 58.46±4.42 42.94±7.57* 28.23±7.88*
LA reservoir function 1.64±0.32 1.43±0.27 0.78±0.24* 0.41±0.17*
LA conduit function 0.31±0.07 0.28±0.07 0.24±0.09§ 0.17±0.09§&
LA contractile function 0.44±0.07 0.41±0.08 0.25±0.09* 0.13±0.04*
*P<0.05, Relative to the other 3 groups
§
P<0.05, relative to the normal group,
&
P<0.05, relative to the impaired relaxation group,
3. Correlation between indexed LAVmax, LAVmin, LAVp, and severity of
LV diastolic dysfunction
There was good correlation (r = 0.85) between the indexed LAVmax and different degrees of LV diastolic dysfunction (Fig 3). The indexed LAVmax increased significantly as LV diastolic dysfunction decreased (P<0.001). Similarly, there was a strong correlation (r = 0.91) between
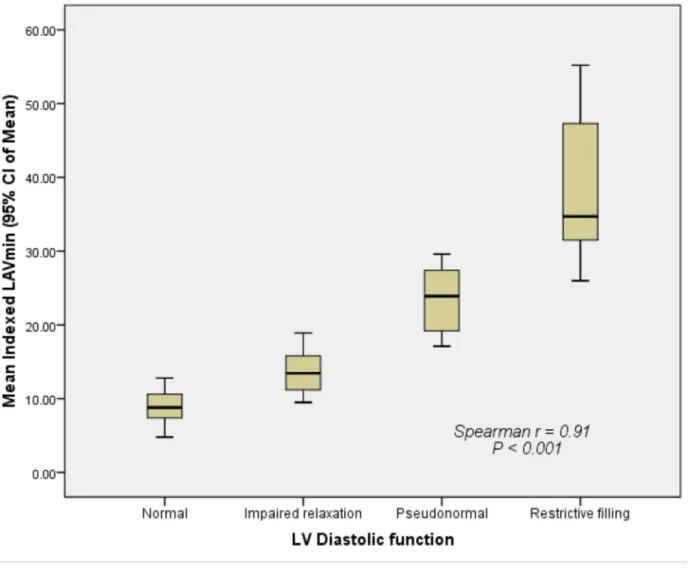
the indexed LAVmin and different degrees of LV diastolic dysfunction (Fig 4). The indexed LAVmin increased significantly as the LV diastolic dysfunction decreased (P<0.001). There
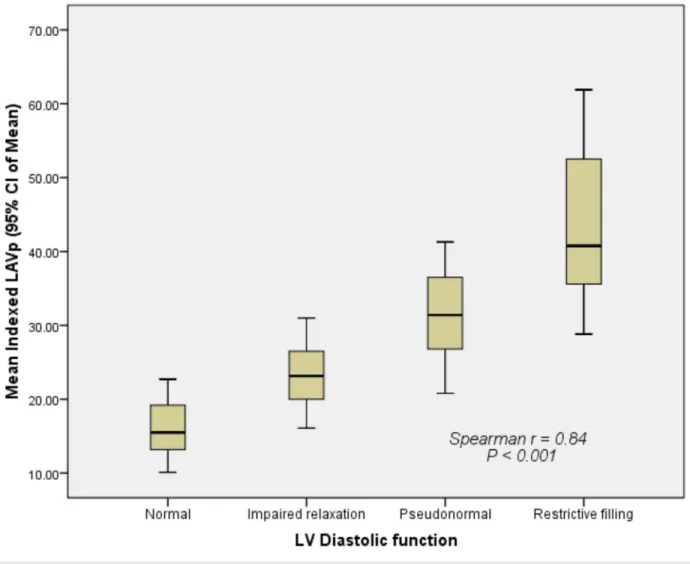
was also a strong correlation (r = 0.84) between the indexed LAVp and different degrees of LV diastolic dysfunction (Fig 5). The indexed LAVp increased significantly as the LV diastolic dys-function decreased (P<0.001).
Fig 3. Correlation between the indexed LAVmax and different grades of left ventricular diastolic dysfunction.The indexed LAVmax increased significantly as LV diastolic dysfunction decreased (P<0.001).
Discussion
The main findings of the current study were that (a) left atrial reservoir, conduit, and contrac-tile function decreases as the left ventricular diastolic function worsens, and (b) there is a signif-icant correlation between indexed left atrial volume assessed by DSCT and different stages of LV diastolic dysfunction.
The current study demonstrated that there were no significant differences in LAEF between the impaired relaxation group and the normal group. There was also no significant difference in the LA contractile function, reservoir, or conduit function between these two groups. How-ever, all these functions showed a downward trend. One explanation may be that there is a compensatory mechanism for the decreased LA functions that helps maintain total LA empty-ing volume [21]. However, in patients in pseudonormal group and restrictive group, LAEF, LA contractile function, and reservoir function deteriorated in parallel with the changes in LV dia-stolic dysfunction, becoming lower than in normal controls. This is because LA filling pressure increases as the severity of LV diastolic dysfunction increases [22]. The duration of increase in Fig 4. Correlation between the indexed LAVmin and different grades of left ventricular diastolic dysfunction.The indexed LAVmin increased significantly as LV diastolic dysfunction decreased (P<0.001).
LA pressure becomes longer, and the LA wall tension increases, which causes LA dilatation and stretching of the LA myocardium. Eventually, LA mechanical dysfunction causes the loss of LA compensation, and LAEF, LA reservoir function, and contractile function decreased visi-bly [23]. There were no significant difference in LA conduit function between the patients in the pseudonormal group and restrictive filling group. This indicated that, at the end stage of LV diastolic dysfunction, LA mainly serves as a conduit. As in the current work, which in-volved two-dimensional volume indices and speckle tracking echocardiography, Santos et al. found that patients with heart failure with preserved ejection fraction (HFpEF) had worse LA reservoir, conduit, and pump function than controls [24]. In this way, LA phasic function eval-uation by DSCT could be an index marker for identifying the LA compensatory stage and de-compensated stage in patients with LV diastolic dysfunction.
There is a growing body of evidence demonstrating that LA enlargement is closely associat-ed with the severity of diastolic dysfunction and can serve as prassociat-edictor of future stroke, atrial fi-brillation, and death [25–28]. In addition, the left atrium reflects left ventricular filling pressure Fig 5. Correlation between the indexed LAVp and different grades of left ventricular diastolic dysfunction.The indexed LAVp increased significantly as LV diastolic dysfunction decreased (P<0.001).
and LA enlargement is a positive form of remodeling that occurs in response to increases in LV filling pressure. Tsang et al [29]. reported that LA volume provides a long-term view that may indicate the diastolic dysfunction of the patient regardless of the loading conditions of heart at the time of the examination and that LA size might be an important clinical risk stratified fac-tor in preclinical cardiovascular disease.
Traditionally, echocardiography is first-line imaging modality for evaluation of LA size. However, in the patients with poor echo window, LA volume is impossible to evaluate. The evaluation of LA size and function by echocardiography is not accurate since using Simpson’s method, which involves making geometrical assumptions. And 3D echocardiographic quanti-tation of LA volume tends to skew results lower than magnetic resonance imaging (MRI) or CT techniques [30,31]. Cardiac MRI was found to accurately assess LA phasic volume and function during the heart cycle. However, it is usually impractical for routine clinical use with MRI because of its costs and limited availability. DSCT can be used to measure LA phasic vol-ume and function reliably using real volvol-ume data acquisition and 3D segmentation. DSCT can also be used as an alternative means of evaluating LV diastolic dysfunction because it can pro-vide cyclic changes in LA volume and function on the basis of true 3D rendering of the LA vol-ume without geometrical assumptions [32]. For this reason, it is here suggested though LA phasic volume and function assessment, DSCT could reflect left ventricular diastolic function in different stages of LV diastolic dysfunction.
Previous studies involving echocardiography showed that indexed LAVmax has a strong graded correlation to the severity of LV diastolic function [23,33]. In this study, results showed that indexed LAVmax, indexed LAVmin, and indexed LAVp all had a strong graded correla-tion to the severity of LV diastolic dysfunccorrela-tion. The explanacorrela-tion is that during the cardiac cycle, LA is directly exposed to the increased LV filling pressure in LV diastolic dysfunction. In order to maintain LV filling, LA pressure increases, and eventually the LA wall stretches and LA increases in size. In this way, the LA phasic volumes may reflect LV filling pressure and may be capable of positive remodeling (dilating) in response to its elevation.
Although the feasibility of LA assessment by CT has been already reported [10,14], most studies about LA and CT reported only LAVmax, LAVmin and LAEF evaluation by CT. To date, there is no report about relationship between LAV and LV diastolic dysfunction evaluated by CT, and neither the relationship between LA phasic function (left atrial contractile function, conduit function and reservoir function) and LV diastolic dysfunction evaluated by CT. In ad-dition, there are many modalities that could be used to evaluate LV diastolic dysfunction. Each modality has its own advantage and disadvantage for LV diastolic dysfunction measurement. LV diastolic function measurement by Doppler provdes information about a single point in time and may not reflect the severity of LV diastolic dysfunction over time, whereas increased LA size may reflect the cumulative effect of filling pressures over time. However, with real vol-ume data acquisition and real three dimensional segmentation postprocessing technique, the use of DSCT, make the determinations of LA phasic volume and function more accurate and are therefore of value.
Conclusions
In summary, LA remodeling occurs in patients with LV diastolic dysfunction. LA phasic vol-ume and function parameters evaluated by DSCT were found to indicate the severity of the LV diastolic dysfunction. Quantitative analysis of LA phasic volume and function parameters using DSCT was found to be a viable alternative prognostic parameter for LV diastolic dysfunction.
Supporting Information
S1 Dataset. Clinical characteristics and echocardiographic measurements of the 4 study groups.
(XLS)
S2 Dataset. LA volume and function measurements of the 4 study groups. (XLS)
Acknowledgments
We would like to thank Dr. YKZ, Dr. YL, Dr. ZXY, and Dr. HJ for their efforts during data scanning.
Author Contributions
Conceived and designed the experiments: JYL ZQZ ZMF. Performed the experiments: ZYW YZ. Analyzed the data: ZYW YZ. Contributed reagents/materials/analysis tools: HM. Wrote the paper: ZYW YZ SIC YHC HM.
References
1. Kono T, Sabbah HN, Rosman H, Alam M, Stein PD, Goldstein S (1992) Left atrial contribution to ven-tricular filling during the course of evolving heart failure. Circulation 86: 1317–1322. PMID:1394938
2. To AC, Flamm SD, Marwick TH, Klein AL (2011) Clinical utility of multimodality LA imaging: assessment of size, function, and structure. JACC Cardiovasc Imaging 4: 788–798. doi:10.1016/j.jcmg.2011.02. 018PMID:21757171
3. Greenberg B, Chatterjee K, Parmley WW, Werner JA, Holly AN (1979) The influence of left ventricular filling pressure on atrial contribution to cardiac output. Am Heart J 98: 742–751. PMID:495426
4. Tsang TS, Barnes ME, Gersh BJ, Bailey KR, Seward JB (2002) Left atrial volume as a morphophysiolo-gic expression of left ventricular diastolic dysfunction and relation to cardiovascular risk burden. Am J Cardiol 90: 1284–1289. PMID:12480035
5. Welles CC, Ku IA, Kwan DM, Whooley MA, Schiller NB, Turakhia MP (2012) Left atrial function predicts heart failure hospitalization in subjects with preserved ejection fraction and coronary heart disease: lon-gitudinal data from the Heart and Soul Study. J Am Coll Cardiol 59: 673–680. doi:10.1016/j.jacc.2011.
11.012PMID:22322084
6. Demirkol S, Kucuk U, Baysan O, Balta S, Celik T, Kurt IH, et al. (2012) The impact of mitral stenosis on left atrial function assessed by two-dimensional speckle tracking echocardiography. Echocardiography 29: 1064–1070. doi:10.1111/j.1540-8175.2012.01751.xPMID:22672328
7. La Meir M, Gelsomino S, Luca F, Pison L, Rao CM, Wellens F, et al. (2013) Improvement of left atrial function and left atrial reverse remodeling after minimally invasive radiofrequency ablation evaluated by 2-dimensional speckle tracking echocardiography. J Thorac Cardiovasc Surg 146: 72–77. doi:10.
1016/j.jtcvs.2012.05.068PMID:22713302
8. Khan UA, de Simone G, Hill J, Tighe DA, Aurigemma GP (2013) Depressed atrial function in diastolic dysfunction: a speckle tracking imaging study. Echocardiography 30: 309–316. doi:10.1111/echo.
12043PMID:23237327
diastolic dysfunction in beta-thalassemia major. Am J Hematol 89: 13–18. doi:10.1002/ajh.23581
PMID:24038100
10. Stolzmann P, Scheffel H, Trindade PT, Plass AR, Husmann L, Leschka S, et al. (2008) Left ventricular and left atrial dimensions and volumes: comparison between dual-source CT and echocardiography. Invest Radiol 43: 284–289. doi:10.1097/RLI.0b013e3181626853PMID:18424948
11. Wolf F, Ourednicek P, Loewe C, Richter B, Gossinger HD, Gwechenberger M, et al. (2010) Evaluation of left atrial function by multidetector computed tomography before left atrial radiofrequency-catheter ablation: comparison of a manual and automated 3D volume segmentation method. Eur J Radiol 75: e141–146. doi:10.1016/j.ejrad.2010.03.020PMID:20430558
12. Mahabadi AA, Truong QA, Schlett CL, Samy B, O'Donnell CJ, Fox CS, et al. (2010) Axial area and anteroposterior diameter as estimates of left atrial size using computed tomography of the chest: com-parison with 3-dimensional volume. J Cardiovasc Comput Tomogr 4: 49–54. doi:10.1016/j.jcct.2009.
10.013PMID:20159629
13. Leschka S, Scheffel H, Desbiolles L, Plass A, Gaemperli O, Valenta I, et al. (2007) Image quality and re-construction intervals of dual-source CT coronary angiography: recommendations for ECG-pulsing win-dowing. Invest Radiol 42: 543–549. PMID:17620936
14. Christiaens L, Lequeux B, Ardilouze P, Ragot S, Mergy J, Herpin D, et al. (2009) A new method for measurement of left atrial volumes using 64-slice spiral computed tomography: comparison with two-di-mensional echocardiographic techniques. Int J Cardiol 131: 217–224. doi:10.1016/j.ijcard.2007.10.
020PMID:18177958
15. Wen Z, Zhang Z, Yu W, Fan Z, Du J, Lv B (2010) Assessing the left atrial phasic volume and function with dual-source CT: comparison with 3T MRI. Int J Cardiovasc Imaging 26 Suppl 1: 83–92. doi:10.
1007/s10554-009-9569-4PMID:20054713
16. Stojanovska J, Cronin P, Gross BH, Kazerooni EA, Tsodikov A, Frank L, et al. (2014) Left atrial function and maximum volume as determined by MDCT are independently associated with atrial fibrillation. Acad Radiol 21: 1162–1171. doi:10.1016/j.acra.2014.02.018PMID:25022763
17. Kuhl JT, Moller JE, Kristensen TS, Kelbaek H, Kofoed KF (2011) Left atrial function and mortality in pa-tients with NSTEMI an MDCT study. JACC Cardiovasc Imaging 4: 1080–1087. doi:10.1016/j.jcmg.
2011.08.008PMID:21999867
18. Garcia MJ, Thomas JD, Klein AL (1998) New Doppler echocardiographic applications for the study of diastolic function. J Am Coll Cardiol 32: 865–875. PMID:9768704
19. Nagueh SF, Appleton CP, Gillebert TC, Marino PN, Oh JK, Smiseth OA, et al. (2009) Recommenda-tions for the evaluation of left ventricular diastolic function by echocardiography. Eur J Echocardiogr 10: 165–193. doi:10.1093/ejechocard/jep007PMID:19270053
20. Spencer KT, Mor-Avi V, Gorcsan J 3rd, DeMaria AN, Kimball TR, Monaghan MJ, et al. (2001) Effects of aging on left atrial reservoir, conduit, and booster pump function: a multi-institution acoustic quantifica-tion study. Heart 85: 272–277. PMID:11179264
21. Chinali M, de Simone G, Liu JE, Bella JN, Oberman A, Hopkins PN, et al. (2005) Left atrial systolic force and cardiac markers of preclinical disease in hypertensive patients: the Hypertension Genetic Epidemiology Network (HyperGEN) Study. Am J Hypertens 18: 899–905. PMID:16053984
22. Matsuzaki M, Tamitani M, Toma Y, Ogawa H, Katayama K, Matsuda Y, et al. (1991) Mechanism of aug-mented left atrial pump function in myocardial infarction and essential hypertension evaluated by left atrial pressure-dimension relation. Am J Cardiol 67: 1121–1126. PMID:2024603
23. Otani K, Takeuchi M, Kaku K, Haruki N, Yoshitani H, Tamura M, et al. (2010) Impact of diastolic dys-function grade on left atrial mechanics assessed by two-dimensional speckle tracking echocardiogra-phy. J Am Soc Echocardiogr 23: 961–967. doi:10.1016/j.echo.2010.06.023PMID:20667694
24. Santos AB, Kraigher-Krainer E, Gupta DK, Claggett B, Zile MR, Pieske B, et al. (2014) Impaired left atri-al function in heart failure with preserved ejection fraction. Eur J Heart Fail 16: 1096–1103. doi:10.
1002/ejhf.147PMID:25138249
25. Hillis GS, Moller JE, Pellikka PA, Gersh BJ, Wright RS, Ommen SR, et al. (2004) Noninvasive estima-tion of left ventricular filling pressure by E/e' is a powerful predictor of survival after acute myocardial in-farction. J Am Coll Cardiol 43: 360–367. PMID:15013115
26. Benjamin EJ, D'Agostino RB, Belanger AJ, Wolf PA, Levy D (1995) Left atrial size and the risk of stroke and death. The Framingham Heart Study. Circulation 92: 835–841. PMID:7641364
27. Tsang TS, Barnes ME, Bailey KR, Leibson CL, Montgomery SC, Takemoto Y, et al. (2001) Left atrial volume: important risk marker of incident atrial fibrillation in 1655 older men and women. Mayo Clin Proc 76: 467–475. PMID:11357793
29. Tsang TS, Barnes ME, Gersh BJ, Takemoto Y, Rosales AG, Bailey KR, et al. (2003) Prediction of risk for first age-related cardiovascular events in an elderly population: the incremental value of echocardi-ography. J Am Coll Cardiol 42: 1199–1205. PMID:14522480
30. Kircher B, Abbott JA, Pau S, Gould RG, Himelman RB, Higgins CB, et al. (1991) Left atrial volume de-termination by biplane two-dimensional echocardiography: validation by cine computed tomography. Am Heart J 121: 864–871. PMID:2000754
31. Rodevan O, Bjornerheim R, Ljosland M, Maehle J, Smith HJ, Ihlen H (1999) Left atrial volumes as-sessed by three- and two-dimensional echocardiography compared to MRI estimates. Int J Card Imag-ing 15: 397–410. PMID:10595406
32. Savino G, Zwerner P, Herzog C, Politi M, Bonomo L, Costello P, et al. (2007) CT of cardiac function. J Thorac Imaging 22: 86–100. PMID:17325580