www.nat-hazards-earth-syst-sci.net/12/3287/2012/ doi:10.5194/nhess-12-3287-2012
© Author(s) 2012. CC Attribution 3.0 License.
and Earth
System Sciences
A comparative analysis of the effectiveness of flood management
measures based on the concept of “retaining water in the landscape”
in different European hydro-climatic regions
S. Salazar1, F. Franc´es1, J. Komma2, T. Blume3, T. Francke4, A. Bronstert4, and G. Bl¨oschl2
1Research Institute of Water Engineering and Environment, Technical University of Valencia, Camino de Vera s/n,
46022 Valencia, Spain
2Institute of Hydraulic Engineering and Water Resources Management, Vienna University of Technology, Karlsplatz 13/222,
1040 Vienna, Austria
3GFZ German Research Centre for Geosciences, Section 5.4 Hydrology, Telegrafenberg, 14473 Potsdam, Germany 4Institute of Earth and Environmental Science, Chair for Hydrology and Climatology, University of Potsdam,
Karl-Liebknecht-Str. 24–25, 14476 Potsdam-Golm, Germany
Correspondence to:F. Franc´es ([email protected])
Received: 2 May 2012 – Revised: 18 September 2012 – Accepted: 27 September 2012 – Published: 12 November 2012
Abstract.In this paper, we analyse the effectiveness of flood management measures based on the concept known as “re-taining water in the landscape”. The investigated measures include afforestation, micro-ponds and small-reservoirs. A comparative and model-based methodological approach has been developed and applied for three meso-scale catch-ments located in different European hydro-climatological re-gions: Poyo (184 km2) in the Spanish Mediterranean, Upper Iller (954 km2) in the German Alps and Kamp (621 km2) in Northeast-Austria representing the Continental hydro-climate. This comparative analysis has found general simi-larities in spite of the particular differences among studied areas. In general terms, the flood reduction through the con-cept of “retaining water in the landscape” depends on the fol-lowing factors: the storage capacity increase in the catchment resulting from such measures, the characteristics of the rain-fall event, the antecedent soil moisture condition and the spa-tial distribution of such flood management measures in the catchment. In general, our study has shown that, this concept is effective for small and medium events, but almost negligi-ble for the largest and less frequent floods: this holds true for all different hydro-climatic regions, and with different land-use, soils and morphological settings.
1 Introduction
Flood management measures are actions that are taken to re-duce either the probability of flooding or the consequences of flooding or some combination of the two (Samuels et al., 2009). Pre-flood preparedness, as one of the components of holistic flood management (Kundzewicz and Takeuchi, 1999), involves decisions for future planning that could pro-duce long-term environmental changes. Here, the concept of change is central to both the processes involved as well as the methodologies used in their analysis (Bronstert, 2004; Bl¨oschl et al., 2007). Hydrological processes are a key con-sideration when characterising floods during the hazard de-termination stage and in subsequent risk analysis (Schu-mann, 2011). The methodology used for flood management planning must be able to distinguish broad strategic op-tions and it requires an approximate precision of informa-tion to support decisions (Hall et al., 2003). For this purpose, hydrological models should be used because they are able to reflect landscape characteristics as well as hydrological scales (Plate, 2009).
flexibility and future-orientation. It offers an opportunity for assessment of the present and possible future situation, but bearing in mind that it is to be understood as a projection rather than a prediction (Niehoff et al., 2002). If the same relevant hydrological processes are assumed, we can use val-idated models to assess the impact of changed pressure con-ditions responding to a known system (Kl¨ocking and Haber-landt, 2002). Then, a calibrated and validated model can be used as reference to analyse a new scenario (Wegehenkel, 2002). Assuming a hydrological model which represents the dominant processes operating in a catchment under current conditions, the following considerations are of particular im-portance: (i) deciding which model parameters will change, and (ii) the extent to which the new characteristics of the al-tered system should be reflected (Wagener, 2007).
The knowledge of the effectiveness of various measures is the basis for designing an efficient strategy in the context of flood management (Hooijer et al., 2004). An indicator to evaluate the measure effectiveness will be via peak discharge reduction because it will contribute to evaluating the attain-ment of the flooding probability reduction. Regarding this indicator, there is an important body of literature on individ-ual catchments and individindivid-ual measures, but there are few comparative studies regarding several measures, scales and places simultaneously. Two published integrated modelling projects applied on large scale river basins were carried out in the Rhine and Meuse rivers by Hooijer et al. (2004) and by Bronstert et al. (2007) for the Rhine basin. Both groups con-cluded that upstream water retention measures, along chan-nels or through land use changes, can significantly reduce the frequency of small and intermediate floods in small basins, or contribute to the reduction of medium floods in large basins. However, no significant effect was noted in extreme flood events occurring in large basins and far downstream. Changes induced by similar measures on hydrological pro-cesses in a particular catchment may or may not appear to be similar to those experienced in another catchment with dif-ferent characteristics. Wagener et al. (2010) call for an inter-disciplinary collaborative effort to help understand changes across locations and spatiotemporal scales through a “com-parative hydrology” which help us to understand the spatial variability of system behaviour and its controls. On this ba-sis, this approach would help with understanding similarities and identifying dissimilarities.
The aim of this paper is to carry out a combination of comparative hydrological analysis with scenario based mod-elling, to assess the effectiveness of three flood management measures, in terms of their capacity for peak discharge re-duction. To do so, we analyse a set of particular pre-flood preparedness measures, based on the concept of “retaining water in the landscape”, in order to assess its possible role in achieving the goals of the EU Flood Directive. Within this concept, we evaluate source control measures through the al-teration of runoff generation processes in the catchment and runoff routing mechanisms, both in the catchment hillslopes
and in the headwater channel networks. Measures to pre-vent flood generation and prepre-ventive flood control measures were those identified in the classification given by Hooijer et al. (2004). In this sense, effects on flood characteristics will be expected, especially a reduction in peak discharges.
Three types of measures are often part of this flood mit-igation strategy: afforestation, ponds and small-reservoirs. Afforestation was introduced in several catchment policies, such as in the Elbe river basin (Wahren et al., 2007) and the Rhine river basin (Disse and Engel, 2001). Ponds are valu-able elements in both local and regional landscapes, because they can help fulfil a variety of goals in flood control, water quality and ecological or agricultural functions (De Laney, 1995). A cascade of reservoirs is more effective in terms of peak delay than a single reservoir with the same storage ca-pacity, because this system tends to generate a multi-peaked hydrograph (Valdes and Marco, 1995); thereby reductions in maximum peak discharges will be expected. Also, a set of small dams (maximum height 15 m) with small reservoirs (maximum volume 100 000 m3) may reduce both the envi-ronmental impacts of such engineering works as well as the severity of potential downstream damages through a dam failure.
The aim of this paper is based on the following scien-tific questions: (i) what are the differences in terms of ef-fectiveness among these types of measures? and (ii) which factors control these differences?. To answer these, we have analysed the hydrological processes in three catchments with significant differences (in terms of size, climate, land cover, soil and hydrogeology), using distributed hydrological mod-els and a scenario approach, i.e., assuming current conditions as a reference situation and the scenarios reflecting the pre-flood measures proposed in future planning. In order to fo-cus on the dominant mechanism for runoff generation, we have chosen three meso-scale catchments where flood wave routing in the floodplain does not affect the discharge at the catchment outlet (Bronstert et al., 2007) and where hydro-logical modelling is considered to be a very useful and ap-propriate tool (Hundecha and B´ardossy, 2004; Plate, 2009).
The paper is organised as follows. Section 2 presents a brief description of each study area in terms of their main physical characteristics. Section 3 gives a description of each hydrological model, followed by the methodology for the pa-rameterisation of flood management scenarios (Sect. 4). Sec-tion 5 presents the results and discusses them in terms of the methodology applied and the effectiveness of the pre-flood measures proposed. Section 6 presents the conclusions and some final recommendations.
2 Study areas
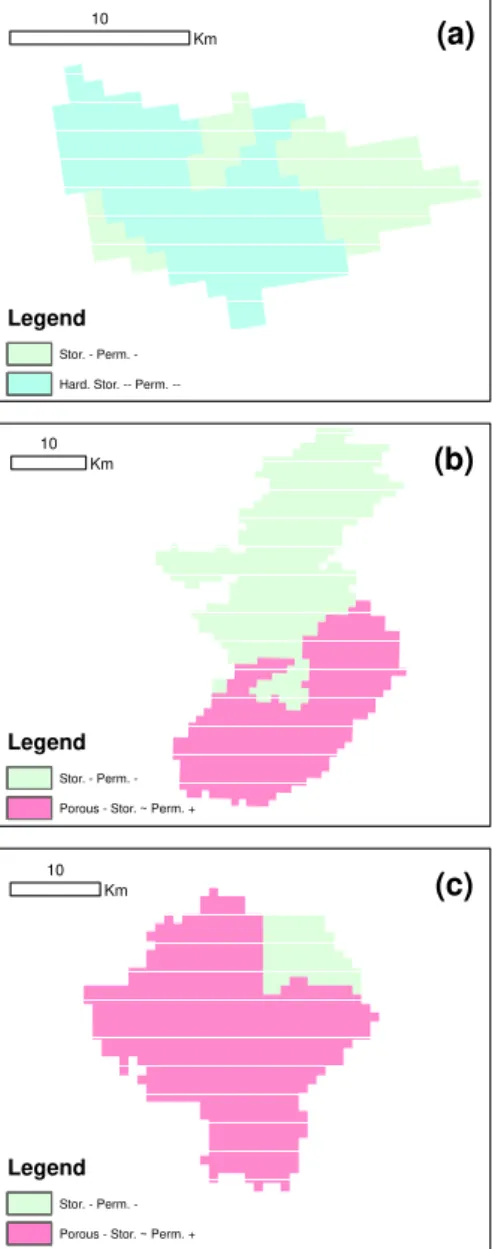
Fig. 1.Location of the studied catchments:(a)Poyo,(b)Upper Iller and(c)Kamp. Hydro-climatic regions adapted from European Biogeo-graphical regions map (Source: European Environment Agency).
soils, hydrogeology and flood processes. Figure 1 shows the location of the catchments from left to right: (a) the “Ram-bla del Poyo” on the East coast of Spain; (b) “Upper Iller River” in Southern Germany in an alpine region close to the Austrian border; and (c) “Kamp River” in north-eastern Austria close to the Czech border. In the same order, catch-ment drainage areas are 184 km2, 954 km2and 621 km2, rep-resenting the Mediterranean, Alpine and Continental Euro-pean hydro-climatological regions, respectively. There are a number of differences in topographical conditions, with al-titudes ranging between 111 and 1030 m a.s.l. in Poyo, 500 and 996 m a.s.l. in Kamp and 658 and 2638 m a.s.l. in Up-per Iller (see Fig. 1). Data from the 1kmx1km raster library of the European Soil Database (Panagos et al., 2012) have helped us to identify several parent material hydrogeologi-cal types (Fig. 2) and soil codes from the World Reference Base (Fig. 3). Land cover is also quite different across catch-ments, as can be seen in Fig. 4; there are different land cover classes which were obtained from CORINE Land Cover 2000 codes (CLC2000) at label 3. The catchments are briefly described in the following, while the main hydro-climatic characteristics are compiled in Table 1. Spatial characteris-tics extracted from European Soil Database and CLC2000 (Figs. 2, 3 and 4) are based on original sources from the na-tional databases listed in Table 2. The spatial data shown in
Table 2 were used in each case study as explained in the next section.
The Poyo catchment is characterised by a semiarid Mediterranean climate, with a mean annual rainfall of about 450 mm and a potential evapotranspiration about 1100 mm. The flow regime in Poyo catchment is typically ephemeral (i.e., without baseflow) and dominated by ex-treme rainfall events, whose intensity is the main cause of flash floods. The annual runoff coefficient is approximately 2 %, but Camarasa and Segura (2001) computed an aver-age event-based runoff coefficient of about 8 %, which is highly variable. Camarasa and Segura (2001) found that as a function of rainfall characteristics and the synchronisa-tion of tributaries, the responses can be either single high peak discharges (with low volumes and short duration) or multipeak discharges (with higher volumes and longer dura-tion). Associated are to two distinct rainfall patterns: (i) con-vective cells that show the greatest intensity, shortest dura-tion and fastest movement mainly over coastal areas, and (ii) persistent, larger cells showing intermediate intensity and slower movement over mountainous areas. The most impor-tant flood registered took place in October 2000, producing considerable damages in the floodplain area.
(a)
(b)
(c)
10
Km
10 Km
Legend
Stor. Perm.
-Hard. Stor. Perm.
--Legend
Stor. Perm.
-Porous - Stor. ~ Perm. +
10 Km
Legend
Stor. Perm.
-Porous - Stor. ~ Perm. +
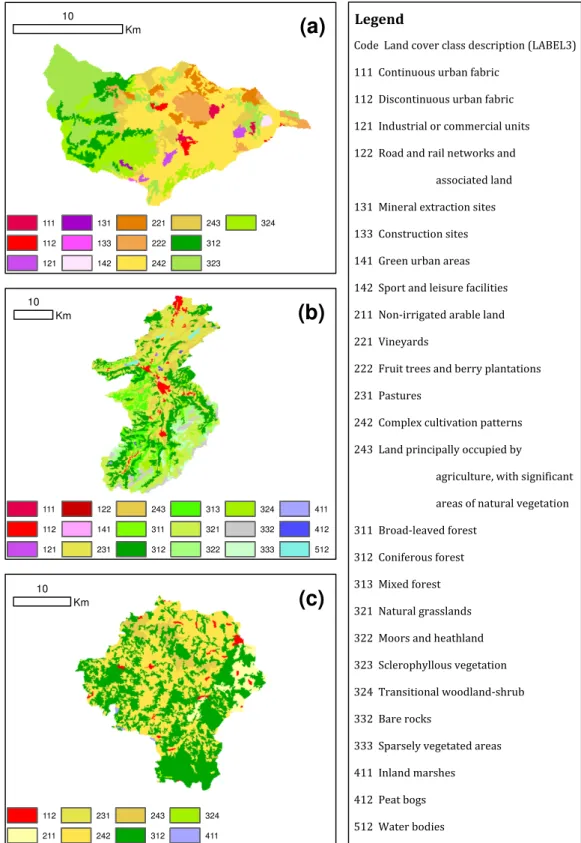
Fig. 2.Parent material hydrogeological types (1 km×1 km raster
library of the European Soil Database, Panagos et al., 2012) in the catchments:(a)Poyo,(b)Upper Iller and(c)Kamp. (Stor. – Perm. – = weakly or unconsolidated microporous substratum with a low permeability and storage capacity. Hard. Stor. – Perm. – = hard mas-sive rock with negligible permeability and storage capacity. Porous – Stor.∼Perm. + = hard, non- or weakly porous limestone, sand-stone and crystalline rock with moderate storage capacity and high permeability because of well developed fissure/joint systems).
coefficient of about 78 %. It is noteworthy that, as precip-itation is likely to be underestimated due to a bias in rain gauge locations to lower elevations, the runoff coefficient is likely to be overestimated. The average maximum annual flood flow is about 382 m3s−1and the average annual
dis-charge is about 47 m3s−1. The flow regime of the Iller can be
characterised as alpine and sub-alpine with low flow in win-ter, high discharge during spring snowmelt and medium flow
(a)
(b)
(c)
10
Km
10 Km
Legend
Calcaric Cambisol
Calcaric Leptosol
Legend
Water body
Eutric Fluvisol
Rendzic Leptosol
Eutric Cambisol
Dystric Histosol
Haplic Luvisol
Calcaric Leptosol
10 Km
Legend
Dystric Cambisol
Haplic Podzol
Dystric Planosol
Fig. 3. Soil codes from the World Reference Base (1 km×1 km
raster library of the European Soil Database, Panagos et al., 2012) in the catchments:(a)Poyo,(b)Upper Iller and(c)Kamp.
in summer. The main flood season is summer, where heavy rainfall events lasting between 24 and 48 h, usually orograph-ically enhanced, can cause disastrous floods. The two largest floods ever recorded in over 100 yr of record took place in May 1999 (peak discharge at Kempten gauge: 850 m3s−1)
and August 2005 (peak discharge 900 m3s−1).
(a)
(b)
(c)
10Km
10 Km
10 Km
111
112
121
131
133
142
221
222
242
243
312
323
324
111
112
121
122
141
231
243
311
312
313
321
322
324
332
333
411
412
512
112
211
231
242
243
312
324
411
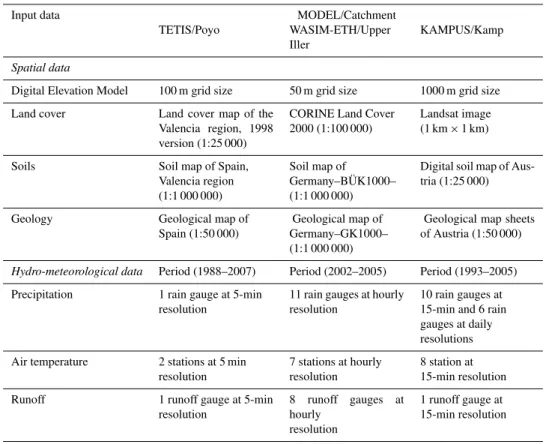
Code Land cover class description (LABEL3)
111 Continuous urban fabric
112 Discontinuous urban fabric
121 Industrial or commercial units
122 Road and rail networks and
associated land
131 Mineral extraction sites
133 Construction sites
141 Green urban areas
142 Sport and leisure facilities
211 Non-irrigated arable land
221 Vineyards
222 Fruit trees and berry plantations
231 Pastures
242 Complex cultivation patterns
243 Land principally occupied by
agriculture, with significant
areas of natural vegetation
311 Broad-leaved forest
312 Coniferous forest
313 Mixed forest
321 Natural grasslands
322 Moors and heathland
323 Sclerophyllous vegetation
324 Transitional woodland-shrub
332 Bare rocks
333 Sparsely vegetated areas
411 Inland marshes
412 Peat bogs
512 Water bodies
Legend
Fig. 4.CLC2000 classes (Source: European Environment Agency) obtained for the catchments:(a)Poyo,(b)Upper Iller and(c)Kamp. The
Table 1.Main characteristics of the study areas.
Name of the Catchment Poyo Upper Iller Kamp
Hydro-climatological region
Mediterranean Alpine Continental
Mean annual precipitation
(mm yr−1)
450 2000 900
Mean runoff coefficient (%)
2 (annual); 8 (event-based)
78 (annual) 33 (annual)
The flood-producing rainfall
Convective rainstorms Heavy orographic
rainfall
Synoptic events, convective storms and rain on snow
Main flood typologies
Flash floods Largest floods Largest floods,
flash floods, snow melt floods
Drainage area
(km2)
184 954 621
Range of altitude (m a.s.l.)
111–1030 658–2638 500–996
Mean slope (%) 12.3 17.9 6
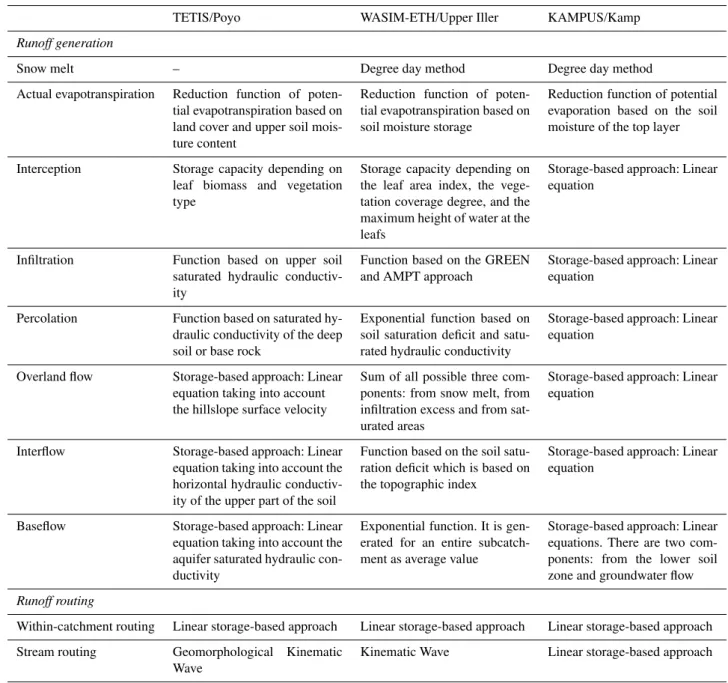
Table 2.Summary of available data for each catchment model.
Input data MODEL/Catchment
TETIS/Poyo WASIM-ETH/Upper
Iller
KAMPUS/Kamp
Spatial data
Digital Elevation Model 100 m grid size 50 m grid size 1000 m grid size
Land cover Land cover map of the
Valencia region, 1998 version (1:25 000)
CORINE Land Cover 2000 (1:100 000)
Landsat image
(1 km×1 km)
Soils Soil map of Spain,
Valencia region (1:1 000 000)
Soil map of
Germany–B ¨UK1000–
(1:1 000 000)
Digital soil map of Aus-tria (1:25 000)
Geology Geological map of
Spain (1:50 000)
Geological map of Germany–GK1000– (1:1 000 000)
Geological map sheets of Austria (1:50 000)
Hydro-meteorological data Period (1988–2007) Period (2002–2005) Period (1993–2005)
Precipitation 1 rain gauge at 5-min
resolution
11 rain gauges at hourly resolution
10 rain gauges at 15-min and 6 rain gauges at daily resolutions
Air temperature 2 stations at 5 min
resolution
7 stations at hourly resolution
8 station at 15-min resolution
Runoff 1 runoff gauge at 5-min
resolution
8 runoff gauges at
hourly resolution
volumes. Other flood processes are flash floods driven by convective storms that occur at smaller spatial scales and which can lead to a very rapid rise in the flood stages. Still other flood types are snow melt floods and rain on snow floods that may occur in winter or spring which are typically associated with gradual rises of stream water levels. A num-ber of floods have been recorded in this catchment, with the most important and exceptional event taking place in August 2002, which caused significant damage to the catchment.
3 Hydrological models
Three process-oriented distributed rainfall-runoff models specifically tailored and adapted for the peculiarities of the different catchments and their hydro-climatic settings, were applied and compared in this study. Under the current con-ditions pertaining to each study area, the methodology in-volved: (i) the identification of the model structure and its respective parameters, including the possibility of a model calibration; and (ii) a model evaluation using the recorded historical events not used in calibration, following the con-siderations given by Klemeˇs (1986). Therefore, it is nec-essary to bear in mind that the process-oriented hydrolog-ical modelling in this framework is for planning purposes, decision-making support and performance is judged with his-torical observations. In this sense, the model evaluation is to demonstrate that physical dominant processes in the basin have been simulated appropriately and the model is capa-ble of performing projections based on the characteristics prevailing in the catchment for the reference period. Model evaluation methods such as quantitative statistics and graph-ical techniques were used in this stage according to standard recommendations (e.g., Moriasi et al., 2007). On this ba-sis, the proposed flood management measures were analysed by means of changes in the model parameters based on the current physical characteristics identified previously. Subse-quent simulations using the same recorded historical event were realised with this new set of altered parameters. The results of this analysis were the hydrographs for both cur-rent conditions and each scenario which allowed us to com-pare the effectiveness of each measure on flood magnitude in terms of peak discharge reduction.
The three catchment models applied and compared in this study are: TETIS model (Franc´es et al., 2007) for the Poyo catchment, WASIM-ETH version 1 (Schulla and Jasper, 2007) for the Upper Iller catchment and KAMPUS model (Bl¨oschl et al., 2008) for the Kamp catchment. Each model has been successfully used for different model-based appli-cations in similar hydro-climatic regions. For example, the TETIS model was performed for a regional water resources study in the Basque Country Region, northern Spain (V´elez et al., 2009), the WASIM-ETH was applied in SW Germany to analyse the impact of land-use change impacts on storm-runoff generation (Niehoff et al., 2002), while the KAMPUS
model is in operational use for forecasting flash floods in northern Austria (Bl¨oschl et al., 2008).
TETIS, WASIM-ETH and KAMPUS have two important common characteristics: they are distributed in cells and their parameters have a physical meaning. They require two kinds of input data (see Table 2): a physical characterisation of the study area (topography, land cover, soils, geology) to build a set of spatial parameters, and a hydro-meteorological time series for parameter identification, model evaluation and sim-ulations. As can be seen in Table 2, spatial data from different resolutions were obtained in each case study. With the help of geographic information systems it is possible to use the spa-tial data from different resolutions and combine them. Based on these pre-processed data, grid cell sizes were established as follows: 50 m at Upper Iller, 100 m at Poyo and 1000 m at Kamp. Time steps were equal to 5 min at Poyo, 15 min at Kamp and 60 min at Upper Iller. On the other hand, the models differ in the conceptualization for the hydrological processes. The main hydrological processes represented by them are summarised in Table 3, while a brief description is presented as follows. In the TETIS model, runoff genera-tion processes at each cell is based on linked storages, each one representing the different water storages in an “extended soil column”, while runoff routing of the flow components (overland, interflow and baseflow) collected by the drainage network is performed using the so called “Geomorpholog-ical Kinematic Wave” approach (Franc´es et al., 2007). The WASIM-ETH model is grid-based in the calculation of evap-otranspiration, interception, snow melt and snow storage, in-filtration and vertical soil water movement. It emphasises runoff generation by explicitly accounting for processes like infiltration, macropore flows, infiltration excess and satura-tion excess. The overland, interflow and baseflow are sim-ulated as linear storages, with the former two being calcu-lated per grid cell, while baseflow is calcucalcu-lated on the basis of the entire subcatchments (8 in the case of Upper Iller). For streamflow routing, the “Kinematic Wave” approach is used. The Kamp catchment at Zwettl was divided into three sub-catchments with two river reaches. In the KAMPUS model, the processes which are represented at grid scale are snow, soil moisture and hillslope scale routing. In addition, a trans-fer function is used to represent the runoff routing in the streams within the subcatchment and stream routing pro-cesses are formulated at the reach scale using a lumped rout-ing model.
Table 3.Main process descriptions of each catchment model.
TETIS/Poyo WASIM-ETH/Upper Iller KAMPUS/Kamp
Runoff generation
Snow melt – Degree day method Degree day method
Actual evapotranspiration Reduction function of
poten-tial evapotranspiration based on land cover and upper soil mois-ture content
Reduction function of poten-tial evapotranspiration based on soil moisture storage
Reduction function of potential evaporation based on the soil moisture of the top layer
Interception Storage capacity depending on
leaf biomass and vegetation type
Storage capacity depending on the leaf area index, the vege-tation coverage degree, and the maximum height of water at the leafs
Storage-based approach: Linear equation
Infiltration Function based on upper soil
saturated hydraulic conductiv-ity
Function based on the GREEN and AMPT approach
Storage-based approach: Linear equation
Percolation Function based on saturated
hy-draulic conductivity of the deep soil or base rock
Exponential function based on soil saturation deficit and satu-rated hydraulic conductivity
Storage-based approach: Linear equation
Overland flow Storage-based approach: Linear
equation taking into account the hillslope surface velocity
Sum of all possible three com-ponents: from snow melt, from infiltration excess and from sat-urated areas
Storage-based approach: Linear equation
Interflow Storage-based approach: Linear
equation taking into account the horizontal hydraulic conductiv-ity of the upper part of the soil
Function based on the soil satu-ration deficit which is based on the topographic index
Storage-based approach: Linear equation
Baseflow Storage-based approach: Linear
equation taking into account the aquifer saturated hydraulic con-ductivity
Exponential function. It is gen-erated for an entire subcatch-ment as average value
Storage-based approach: Linear equations. There are two com-ponents: from the lower soil zone and groundwater flow
Runoff routing
Within-catchment routing Linear storage-based approach Linear storage-based approach Linear storage-based approach
Stream routing Geomorphological Kinematic
Wave
Kinematic Wave Linear storage-based approach
optimisation algorithm based on the SCE-UA method (Duan et al., 1994). In the Upper Iller catchment, this stage was carried out with WASIM-ETH model, involving a combina-tion of two procedures: the first one involving a initial pa-rameter estimate using a long list of papa-rameter sets (100– 200) based on spatial data listed in Table 2, and the second one based on the freely available PEST software for non-linear parameter optimisation, using the Gauss-Marquardt-Levenberg algorithm (Doherty, 2005). The calibration com-prised only the 10 most relevant model parameters related to runoff generation. In the Kamp catchment, the strategy used with KAMPUS model was based on the “multi-source model identification” and on the “dominant processes concept” of
Table 4.Summary of the main model parameters identified at each case study.
MODEL/Catchment Parameter Description Unit
TETIS/Poyo
Hu Maximum static storage mm
λ(m) Vegetation cover index for month –
ks Infiltration capacity cm h−1
u Overland runoff velocity m s−1
kp Percolation capacity cm h−1
kss Interflow velocity cm h−1
v Channel velocity m s−1
WASIM-ETH/Upper Iller
m Recession parameter for baseflow m
Tcorr Correction factor for soil transmissivity –
Kcorr Correction factor for vertical percolation –
kD Single reservoir recession const.-surface runoff h
Hmax Maximum storage capacity of interflow storage mm
kH Single reservoir recession const.-interflow h
t0r Temperature limit for rain C
t0 Temperature limit for snow melt C
c0 Degree-day-factor mm d C−1
cmelt Fraction of snowmelt which is surface runoff –
KAMPUS/Kamp
D Melt factor mm dk
Lp Limit for potential evaporation mm
Ls Maximum soil moisture storage mm
β Nonlinearity parameter which controls the characteristics of runoff generation
L1 Threshold value for surface runoff generation mm
Lcp Maximum percolation rate mm d−1
Lby Maximum percolation rate to the storage of the lower soil zone mm d−1
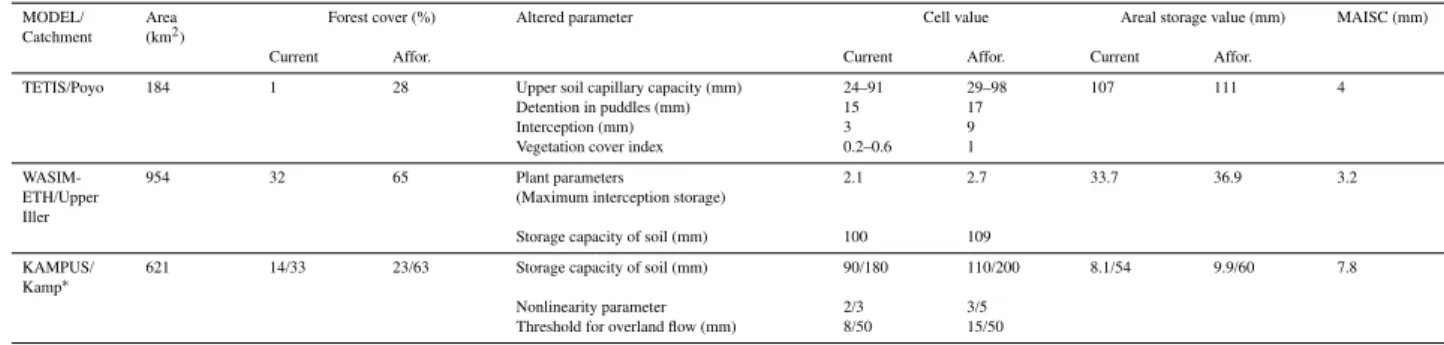
Table 5.Parameters altered by the afforestation scenario.
MODEL/ Catchment
Area
(km2)
Forest cover (%) Altered parameter Cell value Areal storage value (mm) MAISC (mm)
Current Affor. Current Affor. Current Affor.
TETIS/Poyo 184 1 28 Upper soil capillary capacity (mm) 24–91 29–98 107 111 4
Detention in puddles (mm) 15 17
Interception (mm) 3 9
Vegetation cover index 0.2–0.6 1
WASIM-ETH/Upper Iller
954 32 65 Plant parameters
(Maximum interception storage)
2.1 2.7 33.7 36.9 3.2
Storage capacity of soil (mm) 100 109
KAMPUS/
Kamp∗
621 14/33 23/63 Storage capacity of soil (mm) 90/180 110/200 8.1/54 9.9/60 7.8
Nonlinearity parameter 2/3 3/5
Threshold for overland flow (mm) 8/50 15/50
∗Distinction made between steep slopes/hills.
can be seen in the references given above (i.e., Franc´es et al., 2007; Schulla and Jasper, 2007; and Bl¨oschl et al., 2008, respectively).
4 Flood management scenarios and its parameterisation
The flood management measures studied in this paper (af-forestation, micro-ponds and small-reservoirs) are based on the “retaining water in the landscape” concept, all of them producing a higher retention capacity within the catchment, but in different ways. Afforestation has been proposed as one of the most popular land-use changes for runoff gener-ation reduction. On the other hand, micro-ponds and
small-reservoirs have been suggested as two kinds of measures that focus on the introduction of small retention elements in the landscape forming small wetland areas. Here, the distinc-tion between micro-pond and small-reservoir lies in the lo-cation of these small retention elements: while micro-ponds are located on hillslopes, small-reservoirs are situated within the channel network. These measures are introduced in each catchment model to compare their similarities and differ-ences.
storage capacity of water retention and catchment area. MAISC=
Si− S0 A
(1) where S0 is the current catchment storage capacity, Si is
the future scenario catchment storage capacity andAis the catchment area.
4.1 Afforestation
For the Poyo catchment, afforestation was proposed as a way of ecological restoration on current agricultural areas (mainly complex cultivation patterns). Based on this crite-rion, the forest cover can be increased from 1 % to 28 %. In the Upper Iller catchment, the potential areas for afforesta-tion were chosen in the following way: (i) afforestaafforesta-tion areas were only derived from land characterised as pastures below the tree line; (ii) only pastures with a gradient of more than 5 % were chosen, as this area is characterised by a steep to-pography and the more level terrain was the more valuable to farmers; and iii) plots had to be greater than 5000 m2. The resulting forested area totalled 620 km2, corresponding to an increase from 32 % to 65 % of the whole catchment area. In the Kamp catchment, agricultural areas (mainly complex cul-tivation patterns) were assumed to be planted with pine trees, but making a distinction between hills and steep slopes to take into account their differences in the runoff generation: steep slopes are characterised by a lower soil storage capac-ity and faster runoff response. In the end, forest area was in-creased from 14 % to 23 % on steep slopes, and from 33 % to 63 % on hills. Percentages of afforestation scenario com-pared to the current conditions are given in Table 5. Figure 4 specifies the current land cover which is to be converted to forest cover.
Modelling the impacts of afforestation and/or other land-use or vegetation changes has the major challenge of reflect-ing the nature of changes in model parameter values, given an associated uncertainty in the modelling of discharges un-der current conditions (Beven, 2001). According to Bronstert et al. (2007), the effects of land-use changes on runoff pro-cesses can be estimated by establishing a relationship be-tween the model parameters and the land use characteristics of the catchment. Niehoff et al. (2002) suggest taking into account the following runoff generation issues: (i) the role of land-cover and soil characteristics in infiltration processes; (ii) the role of initial soil moisture conditions before flood events and (iii) the spatiotemporal dynamic of rainfall events. In this study, we have assumed changes in the soil structure, keeping in mind the actual characteristics of present forest soils. We expect an increase in processes such as interception and infiltration rates in forested areas, with a concomitant re-duction in surface runoff and flood response (Calder and Ayl-ward, 2006; Jewitt, 2005). The forest hydrology recognises that soil properties can change in two different ways in the mid- and long-term: (i) changes due to forest management
that will tend to revert to the antecedent conditions before the disturbance; and (ii) changes due to the growth of trees and their effects on soil properties, causing an increase in soil storage capacity. In this sense, changes in model parameteri-sation have been made by taking into account changes in the soil and vegetation properties defined for each model struc-ture.
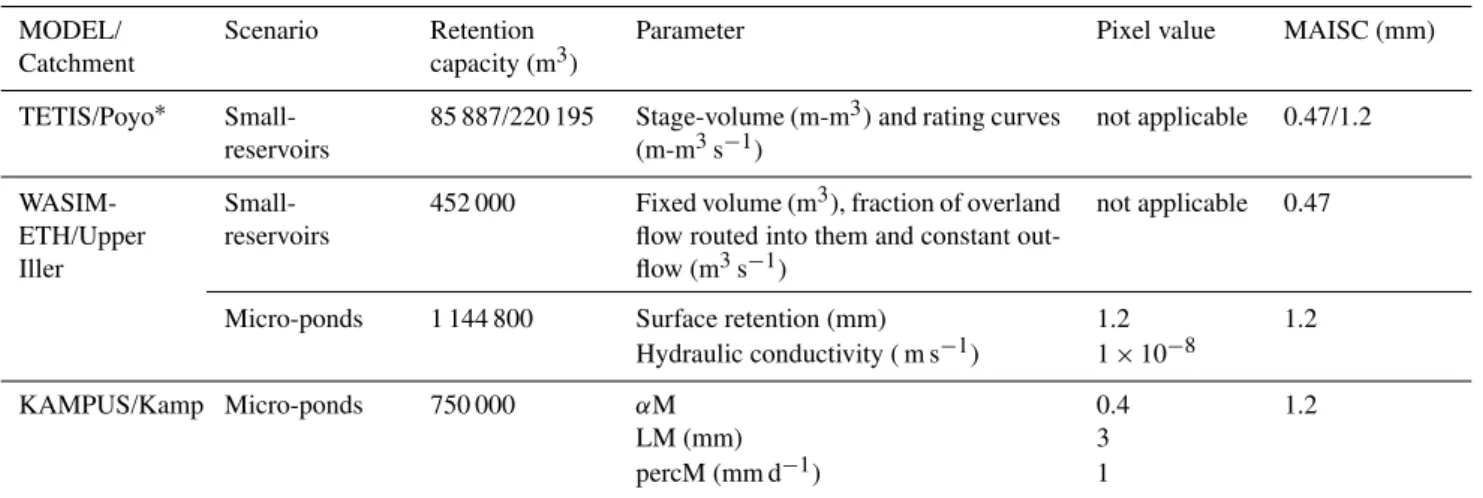
Table 6.Parameters to be considered in the analysis of the retention elements in the landscape scenarios (current storage capacity is null).
MODEL/ Catchment
Scenario Retention
capacity (m3)
Parameter Pixel value MAISC (mm)
TETIS/Poyo∗
Small-reservoirs
85 887/220 195 Stage-volume (m-m3)and rating curves (m-m3s−1)
not applicable 0.47/1.2
WASIM-ETH/Upper Iller
Small-reservoirs
452 000 Fixed volume (m3), fraction of overland
flow routed into them and constant out-flow (m3s−1)
not applicable 0.47
Micro-ponds 1 144 800 Surface retention (mm) 1.2 1.2
Hydraulic conductivity ( m s−1) 1×10⁻⁸
KAMPUS/Kamp Micro-ponds 750 000 αM 0.4 1.2
LM (mm) 3
percM (mm d−1) 1
∗In Poyo catchment there are two small-reservoir scenarios (see text for more explanations.)
4.2 Retention elements in the landscape: small-reservoirs and micro-ponds
A set of small dams (to produce small-reservoirs) for the channel network was proposed for both Poyo and Upper Iller catchments. An example of the spatial distribution of these retention elements can be seen in Fig. 5. For Poyo, this scenario was based on a technical proposal for flood con-trol prepared by the Jucar River Basin Authority which pro-posed 184 reservoirs in the headwater catchment area with a total storage of 16 million cubic metres. These reservoirs include dams of different sizes (ranging from 5 to 30 m), with similar spillway characteristics and none of them pos-sesses a bottom outlet. Based on this realistic scenario, we have generated two scenarios with dams lower than 10 m and seeking the same MAISC used in the other study areas (as it is described below); i.e., a MAISC equal to 0.47 mm for the small-reservoir scenario in the Upper Iller catchment and a MAISC equal to 1.2 mm for the micro-pond scenar-ios in both the Upper Iller and Kamp catchments. As a re-sult, there was one scenario with three five-metre high dams, and nine ten-metre high dams. Its volume retention ranges between 432 to 41 725 m3, with a total water storage capac-ity of about 85 887 m3inundating a catchment area of about 0.02 % (0.04 km2). The other scenario has three five-metre high dams and 34 ten-metre dams. It has a potential water storage capacity of about 220 195 m3, with a inundated area in the catchment of about 0.05 % (0.09 km2). The Modified Puls Method (see e.g., Ponce, 1989) was used to represent the runoff routing at each small-reservoir. In the Upper Iller catchment, the potential locations and volume of the small-reservoirs were determined during a field campaign in May 2007. The selection of locations was based on the local mi-crotopography. The reservoirs are thought to be restricted by a small dam (maximum height 5 m) with a culvert. These small-reservoirs are characterised by the fraction of overland
Fig. 5. Small-reservoir scenario for the Poyo catchment
(MAISC = 0.47 mm).
flow routed into them or their inflows (defined by the ratio of catchment size of the reservoir over the size of the sub-catchment), a constant outflow and a fixed volume from 1000 to 100 000 m3. Summing up all values over the entire catch-ment, a retention volume of 452 000 m3can be obtained and an accumulated reservoir catchment area of 90.3 km2(9.5 % of the whole area). This scenario is equivalent to a MAISC about 0.47 mm.
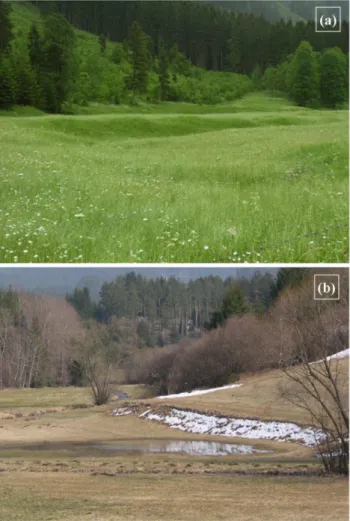
Fig. 6.Examples of feasible locations for micro-ponds in the catch-ments:(a)Upper Iller and(b)Kamp.
at lesser rainfall intensities) the storage is emptied by infiltra-tion. This results in a potential capacity of water retention of about 1 144 800 m3and a MAISC of about 1.2 mm. However, as these water-filled soil hollows are likely to cause sedimen-tation of fines on the soil surface, the hydraulic conductiv-ity assumed for infiltration was reduced to 1×10⁻⁸m s−1. In
the Kamp catchment, the volume of each micro-pond was of the order of 100 m3, with a total capacity for water retention of about 750 000 m3(7500 micro-ponds or 12 micro-ponds per km2), giving a MAISC value of about 1.2 mm. Some modifications were made to the KAMPUS model structure of the Kamp catchment in order to represent the additional wa-ter retention of the micro-ponds. These elements were repre-sented by additional bucket storages with a fixed spill-over. The micro-ponds were only drained by constant deep per-colation to ground water storage. The drained water from the micro-ponds contributes to runoff with a certain delay in time and, hence, does not contribute to the fast runoff processes during the rising limb of floods. This is because of the very slow ground water processes. The modification of the hydrologic model accounts for these micro-ponds in
the catchment results with the addition of three model pa-rameters: the areal fraction of the grid elements drained into micro-ponds (αM), the threshold for limiting the storage ca-pacity of the bucket (LM) and the constant deep percolation rate (percM) for drainage of the bucket storage. The parame-ters were set as lumped values for the entire catchment. Full bucket storage (3 mm) empties within a dry period of three days and the full retention capability of the bucket storage is recovered. For each pixel element (1 km2)an additional stor-age capacity was obtained by multiplying this value with the other parameters (i.e.,αM×LM×percM).
As can be explained above, the scenarios described were introduced in each hydrological model either by changing model parameters or by using new parameters in the reser-voir routing. Table 6 shows a summary of the new retention capacity in each catchment model and the model parameters introduced with these measures and their values.
5 Results and discussion
5.1 Modelling the current conditions
There are only relatively few hydro-meteorological data for the Poyo catchment, with only one rain gauge and one flow gauge providing observations every 5 min, which are oper-ated by the Real Time System of Hydrological Information of the Jucar River Basin Authority. Since the late 1980s (when this system became operational) three flood events with dis-charges greater than 100 m3s−1and twelve flood events with
discharges less than 100 m3s−1 were recorded. Based on
optimisation, giving reasonable values according to continu-ous simulation at daily scale with the support of the regional rain gauge network operated by the Meteorology Spanish Agency. The results of the modelled events showed that the main component of the total discharge was the overland flow, as was found by Camarasa and Segura (2001).
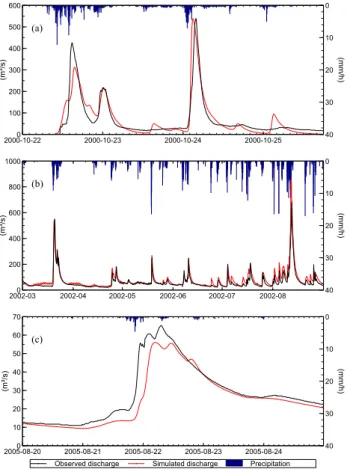
For the Upper Iller catchment, a total of 11 rain gauges and 8 runoff gauges were used. In the WASIM-ETH model, a model time discretisation of one day was applied for the es-tablishment of initial conditions, while the actual simulations were carried out using hourly time steps. A regression-based method was used to improve input data to solve the problem of the strong gradient of temperature and precipitation with altitude, which is often not captured by the available climate station data. The calibration was carried out for each sub-catchment separately for the time period March–September 2002. During the calibration phase, downstream subcatch-ments received measured discharge time series from their re-spective upstream counterparts. This ascertains that model errors from upstream catchments are not compensated by the parameters determined for the lower catchments. The model performance showed balance errors between 4 % and 23 % and NSE indices between 0.78 and 0.87, which is quite high given the above described difficulties with the input data. Figure 7b shows the results for the lowest subcatchment. In most cases base flow is only produced at a very low level, with interflow taking over and providing streamflow during periods between rainfall events. Only one subcatchment had a higher interflow component producing event dynamics in-stead of overland flow. It is only during the snow melt pe-riod as well as during larger rainfall events that a pronounced and strong response in overland flow occurs. Model valida-tion was carried out for the March–August 2005 period, with one year as warming-up period. As the discharge time se-ries of most gauging stations have one or more gaps of at least several months, validation was only carried out for one of the headwater subcatchments. In this case, the validation was very good with a NSE of 0.86.
For the development of the distributed model at the Kamp catchment, data from 16 rain gauges were used. Of these, 10 rain gauges had 15-min recording intervals while the oth-ers were daily gauges. Climatologically scaled radar infor-mation was used to interpolate input data at each time step in the model. Additionally, spatially distributed air temperature grids were interpolated, based on observed air temperatures recorded at eight gauging stations in the study catchment. The gridded meteorological input data were used to simu-late state variables such as soil moisture, reservoir storage and snow water equivalent at each modelling time step. For the development of the distributed model, discharge data be-tween 1993 and 2005 from Zwettl station were used. The simulations were compared with observed runoff data at a seasonal scale and at the event scale stratified by hydrolog-ical situations. Event analysis was stratified by magnitude and event types as synoptic (large scale), convective (small
(a)
(mm/h)
0
10
20
30
40
(m³/s)
0 100 200 300 400 500 600
2000-10-22 2000-10-23 2000-10-24 2000-10-25
(b)
(mm/h)
0
10
20
30
40
(m³/s)
0 200 400 600 800 1000
2002-03 2002-04 2002-05 2002-06 2002-07 2002-08
Observed discharge Simulated discharge Precipitation
(c)
(mm/h)
0
10
20
30
40
(m³/s)
0 10 20 30 40 50 60 70
2005-08-20 2005-08-21 2005-08-22 2005-08-23 2005-08-24
Fig. 7.Calibration periods at catchments:(a)Poyo,(b)Upper Iller
and(c)Kamp.
scale), snow melt, and rain-on-snow events. During the cal-ibration and validation process hydrologic reasoning based on field surveys, expert knowledge from local water profes-sionals and additional data sets (e.g., ground-water levels) was used as external information to test the plausibility of the model structure and parameters. The model performance for the entire simulation period (from October 1993 to August 2005) with a NSE of 0.88 and a balance error about 5 % was very good. The result for a convective event (August 2005) is shown in Fig. 7c: the hydrograph was very well represented with an error in the peak discharge of about 14 %, with a NSE index of 0.84.
5.2 Effects of afforestation
5
Upper )ller tendency Poyo tendency
5
tation
% Kamp tendency
5
by aff
or
es
t
5
eduction
b
schar
ge r
e
5
Pe
ak
d
i
. .5 . .5 . .5 .
Specific peak discharge at current conditions m /s/km Specific peak discharge at current conditions m /s/km
Fig. 8.Effect of the afforestation scenario on peak discharge with
two initial soil moisture conditions (solid symbols means “wet” and empty symbols means “dry”) in the catchments:(a)Poyo (red trian-gles),(b)Upper Iller (green squares) and(c)at Kamp (blue circles). MAISC values are 4.0, 3.2 and 7.8 mm, respectively.
the forest in the rainfall abstraction, which can represent a significant proportion of rainfall volume in the case of small storms, but is relatively insignificant for the largest rainfall events (Calder and Aylward, 2006). Although these results agree with the predominant findings in forest hydrology, re-cent studies showed a contrary effect, that the effects of this land use change remain important even for extreme floods. Hicks et al. (2005) combined field methods with modelling to analyse the flood response of a small Appalachian catch-ment (2.1 km2)to a largest event. They concluded that even under extreme rainfall conditions, land use (45 % forested and 55 % grass/pasture) can play a role in determining the magnitude and timing of flood peaks at small scales. Kuras et al. (2012) used a modelling-based investigation on a planned forest harvesting (50 % of a catchment with 4.74 km2 lo-cated in south central British Columbia), where the effect on peak reduction (9 %–25 %) increased with return period (10–100 yr). It was attributable to the snow-dominated runoff generation processes in the catchment. A possible explana-tion for these differences in findings may be due to different factors related to catchment size such as peak discharge syn-chronisation, the proportionate change in land use and rain-fall spatial scale (Calder and Aylward, 2006). Calder and Ayl-ward (2006) stated that “although land use change effects on floods may be detectable on small catchments the “signal” is likely to be weaker on large catchments”.
Regarding the effect of initial soil moisture, Fig. 8 shows that in general terms, this kind of measure tends to be more effective in peak discharge reduction with dry initial condi-tions than with wet initial condicondi-tions. This is because with wetter initial conditions the interception storage is rapidly saturated and the infiltration capacity is smaller
(L´opez-Moreno et al., 2006). Figure 8 and Table 7 show effectiveness as a function of MAISC index, where the lower the MAISC value, the lower the peak discharge reduction. The small dif-ference in the upper quartiles between Kamp and Poyo (Ta-ble 7) could be due to the particular flood-producing rain-fall characteristics of their hydro-climate regimes: Poyo has a drier regime than Kamp. The effect of land use measures strongly depends on antecedent conditions and on the type of precipitation, as concluded by Niehoff et al. (2002) and by Hooijer et al. (2004). Additionally, the potential of flood control by land-use management measures is also dependent on the site-specific soil and relief conditions (Wahren et al., 2007).
The tendency line of the Poyo case study (red line in Fig. 8) shows the influence of the afforestation scenario on the ten historical events that were simulated. The largest event was not mitigated (peak reduction was almost insignif-icant) because it was a long event of large magnitude, with high-intensity intervals and wet initial soil moisture condi-tions. This effect was found also by Bellot et al. (2001) in one small Mediterranean catchment (∼6 km2). For the remaining long events (which were generally of medium magnitude) flow peak reductions ranged between 5–6 % for wet and 10 % for dry initial soil moisture condition. For summer convective storms (which were generally of low magnitude and exhibit-ing dry antecedent conditions), reductions of about 22–33 % were found. These values of peak reduction agree with the results found in similar hydro-climatological regions by both Cognard-Plancq et al. (2001) with annual flood peak reduc-tions up to 20 % and with the results found by Cossandey et al. (2005) who reported reductions of about 31 % for the annual peak floods and 5 % for 10-yr peak floods.
The tendency line of the Upper Iller catchment (green line in Fig. 8) shows the peak flow reduction was between 2 % and 8 %: very small for extreme floods with peak discharges above 300 m3s−1 (>0.3 m3s−1km−2) and rather
moder-ate for small and medium floods. The results for small and medium floods were found to have the same order of magni-tude as that found in the study by Papankova et al. (2006) for events between 2 and 50 yr return period for an afforestation scenario in the Hron River basin (central Slovakia). The kind of soils in the Upper Iller catchment could be another reason why there is little effect on peak flow reduction. On shallow soils and low-permeable bedrock, subsurface flow processes are quite important as was observed in this study as well as in another given by Bronstert et al. (2007) for one subcatchment of the Rhine River basin located in the Maritime-Continental hydro-climatic region.
The tendency line of the Kamp study (blue line in Fig. 8) shows the influence of afforestation scenario on the ten flood events at the Zwettl/Kamp gauge station. The effect of this land use change is very small for extreme floods with peak discharges above 350 m3s−1(>0.5 m3s−1km−2).
Table 7.Peak discharge reduction quartiles for the afforestation sce-narios (more optimistic giving different MAISC at each catchment).
MAISC (mm) 3.2 4.0 7.8
Quartile Upper Iller Poyo Kamp
Minimum 0.6 % 0.0 % 0.0 %
First 2.1 % 5.1 % 11.5 %
Second 3.7 % 7.9 % 19.5 %
Third 5.3 % 22.3 % 24.1 %
Maximum 8.2 % 33.0 % 29.7 %
results agree with the findings in the Poyo catchment: the two case studies indicate that the systematic afforestation of agricultural areas will reduce peak flows for small and medium events, but with no reduction for large events. Also, these results agree with some findings in the same hydro-climatic region. In the Schwarze Pockau catchment in Ger-many (129 km2), Wahren et al. (2007) found a decrease in peak flow of 24 % in the flood-producing heavy rainfall event, 21 % for a typical frequent event and practically no ef-fect (3 %) for the highly infrequent event from August 2002 (which contributed to the devastating “Elbe flood” event). Merta et al. (2008) analysed the effects of several scenarios in the Weißeritz catchment (German-Czech border) in terms of both reduction of areas with quick runoff components and re-duction of peak discharge. One of these scenarios was a par-tial afforestation on H¨ockenbach subcatchment (16.7 km2) where peak flow reductions were less than 20 % for intense but short summer rain events, depending on the recurrence intervals and was higher for the most frequent events. In the case of rain events with longer duration the peak discharge could be reduced by up to 10 %.
5.3 Effects of landscape retention elements: small-reservoirs and micro-ponds
Retention elements at headwater channel networks with a low MAISC index (small-reservoirs with a MAISC equal to 0.47 mm at both Poyo and Upper Iller) were shown to have limited effects on peak flows (peak reduction quar-tile values are shown in Table 8). The low effectiveness of this kind of measure can be explained by the low incre-ment in retention capacity and the runoff generation in ar-eas downstream of the small-reservoirs. In fact, the topogra-phy and size of the Iller catchment (Iller is 5.2 times bigger than Poyo) forced a worst distribution of the small-reservoirs and consequently a smaller peak discharge reduction than in Poyo catchment. This confirms the statements by Leopold and Maddock (1954) who argued that a series of small head-water dams were ineffective during the biggest floods at large catchments scales. Also, Hooijer et al. (2004) found that re-tention measures along upstream channels may help reduce
%
General tendency
elements
ret
ention
e
8
uction b
y
r
har
ge r
ed
u
Peak disc
h
. . . .
P
S ifi k di h t t diti / /k
Specific peak discharge at current conditions m /s/km
Fig. 9. Effect of the flood retention measures on peak discharge
in the catchments outlets considering the same MAISC equal to 1.2 mm and two initial soil moisture conditions: solid sym-bols means “wet” and empty symsym-bols means “dry”. Catchments: (a)small-reservoirs at Poyo (red triangles),(b)micro-ponds at Up-per Iller (green squares) and(c)micro-ponds at Kamp (blue circles).
flood risk in the upstream sub-basins, but will contribute little to flood risk reduction far downstream.
In the case of retention elements at hillslopes using micro-ponds, with a MAISC equal to 1.2 mm for both Upper Iller and Kamp, there was greater effectiveness than in the small-reservoir scenarios, but the difference was moderate, as can be seen in Table 8. The differences between Iller and Kamp in the magnitude of peak flow reduction can be attributed to the same situation seen in the small-reservoirs; i.e., Up-per Iller catchment is 1.5 times larger than Kamp and it has a higher probability of runoff generation on drainage areas located downstream from the measurement locations. Notice also that for retention elements on hillslopes, MAISC is three times higher than for retention elements within the channel network. Table 8 shows that for the scenarios with MAISC values of about 1.2, effectiveness was greater than for sce-narios with values of about 0.47 mm. For a large river basin and large reservoirs, Batalla et al. (2004) used the ratio of reservoir capacity to mean annual runoff and concluded that, when this ratio increased, flood frequency and magnitude de-creased.
Table 8.Peak discharge reduction quartiles for the retention elements in the landscape scenarios.
MAISC (mm) 0.47 1.2
Quartile Upper Iller,
small-reservoirs
Poyo, small-reservoirs
Upper Iller, micro-ponds
Poyo, small-reservoirs
Kamp, micro-ponds
Minimum 0.0 % 0.0 % 0.0 % 0.0 % 0.6 %
First 0.0 % 0.5 % 0.4 % 0.5 % 4.3 %
Second 0.0 % 2.4 % 0.8 % 3.6 % 6.6 %
Third 0.4 % 6.1 % 1.2 % 10.8 % 9.0 %
Maximum 0.8 % 7.2 % 3.4 % 12.8 % 14.1 %
but analysing only one large reservoir. Similarly, Chen et al. (2007) found that the effectiveness of analogous measures decreased whilst flood event characteristics increased. Fig-ure 9 separates events according to dry and wet antecedent soil moisture conditions. While flood retention measures (small-reservoirs and micro-ponds) were more effective dur-ing events with wet initial conditions than for dry events for the Poyo and Kamp catchments, at the Upper Iller catchment there was no clear relationship. Each case study was analysed separately in an effort to explain this different behaviour.
In the case of the Poyo catchment (red triangles in Fig. 9) a clear pattern was found as a function of the event character-istics. Peak discharge reduction in summer convective rain-storms with small magnitudes, short duration and dry initial conditions were almost insignificant. Flood genesis in these cases was due to flashiness responses in the lowest part of the catchment. In these areas the effect of the set of small-reservoirs is almost nil because they are distributed at head-water and middle areas of the catchment. For longer storm events affecting larger areas of the catchment, the runoff gen-erated and concentrated at headwaters can be captured by the small-reservoirs, affecting more significantly the peak dis-charge at the outlet. As expected, this influence diminishes when event magnitude increases.
The micro-pond scenario in Upper Iller catchment was clearly more effective than small-reservoirs for smaller events, but the difference diminishes with larger floods. The events analysed for the peak reduction study were sepa-rated into events with wet antecedent conditions and events with dry antecedent conditions. For the headwater subcatch-ment we found that, in general, both micro-ponds and small-reservoirs were more effective for dry antecedent conditions whereas no clear pattern was observed for the entire catch-ment. These results might be caused by the small sample size and a mixing of effects such as location of runoff genera-tion and event characteristics (magnitude, duragenera-tion and an-tecedent conditions).
Circles in Fig. 9 represent the influence of micro-ponds on ten historical flood events simulated in the Kamp catch-ment. The peak discharge reduction rapidly decreases with larger flood peaks. The influence of the micro-ponds on flood
0 5 10 15
0.47 0.84 1.2 1.49 1.89 2.14 2.48 2.77 3.15 3.41
P
e
a
k
d
is
c
h
a
rg
e
r
e
d
u
c
ti
o
n
(
%
)
0 5 10 15
0.47 0.84 1.2 1.49 1.89 2.14 2.48 2.77 3.15 3.41
MAISC (mm)
P
e
a
k
d
is
c
h
a
rg
e
r
e
d
u
c
ti
o
n
(
%
) (b) (a)
Fig. 10.Effect of MAISC and two different small-reservoirs spatial
distribution in the Poyo catchment:(a)more concentred at headwa-ter areas and(b)distributed both at headwater and at middle areas.
response was examined for different event types. For small events, mostly convective events, flood peak reductions of up to 14 % were observed. For extreme flood events with peak discharges above 350 m3s−1(>0.5 m3s−1km−2), the
poten-tial reduction of the micro-ponds is nearly zero. In the case of extreme events that occur when large parts of the catch-ment are already saturated after the first intensive rainfall, the reduction in soil moisture due to the construction of micro-ponds has only a small effect on the flood peak. The peak reduction through micro-ponds is higher for wet initial con-ditions. This is due to the fact that the fraction of surface runoff is greater in the case of high soil moisture and more water drains into the micro-ponds.
quartile of peak discharge reduction. In addition, for similar MAISC values, the set of reservoirs influencing headwater and middle areas showed higher peak reductions than the other set which mainly influences headwater areas. This ef-fect was more accentuated for MAISC values lower than 1.49 mm.
5.4 Applicability and limitations
The model evaluation demonstrated that physical dominant processes in the studied catchments have been simulated ap-propriately for the reference period. The model performances were satisfying with respect to runoff simulations, but could be checked only qualitatively due to limited observations. On this basis, it is assumed that the models are capable of per-forming projections based on the characteristics prevailing in the catchment. Parameters changes should be considered when analysing the effects of flood management measures in scenarios studies providing that the model assumptions made in this approach are valid. As was discussed above, the effect of the measures depend on different factors such as rainfall-producing floods, soil moisture antecedent conditions, soil characteristics, catchment size, relative storage capacity in the catchment and measurement location. But, the results also depend on each model conceptualisation and parame-terisation. Although these effects are likely to be specific in each catchment, the results showed similar tendencies in all catchment investigated. These results should be representa-tive for other catchments in similar hydro-climatic regions.
The results also showed that each hydrological model has different sensitivities related to the assumed parameter changes. Although the quantification of the uncertainties un-derlying this approach are beyond the scope of this study, it should be considered in subsequent analysis. To this end, there is a wide body of literature. For example, Nandaku-mar and Mein (1997) quantified the levels of uncertainty in rainfall-runoff model predictions due to the errors in hydro-logical and climatic data and considered the implications for prediction of the hydrologic effect of land-use changes. Also, an approach to assess the effects of different land covers on model outputs was given by Eckhardt et al. (2003). Methods to ensemble different models were presented by Huisman et al. (2009) where the probabilistic reliability ensemble aver-aging method allowed a quantification of the model structure uncertainty in the land use scenario predictions. The latter has become standard practice in analysis of predictions of future climate.
6 Conclusions and recommendations
This study covered a wide spectrum of hydrologi-cal processes in catchments located in different hydro-climatological regions in Europe (Mediterranean, Alpine and Continental). The respective processes have been
ad-equately represented with a physical meaning using dis-tributed process-oriented hydrological models and a proper model identification and parameterisation. According to standard model evaluation techniques (Moriasi et al., 2007), the three models (TETIS, WATSIM-ETH and KAMPUS) produced performance rating from satisfactory to very good simulations for the reference period. The use of the fitted models for modelling assumed flood management scenarios was possible and potentially useful for planning purposes. However, the uncertainties of this kind of approach due to typical errors related to model structure, parameters and in-put data are of major importance. A way to demonstrate the model transferability should be implemented using data from a wide range of climatic conditions and with an ensemble of different models or, possibly, with an ensemble of a given model using different parameter sets (Duan et al., 2006). Huisman et al. (2009) applied an ensemble of hydrological models to analyse the same set of land use change scenar-ios, increasing their confidence in the scenario predictions. However, they suggest its use in a well-instrumented catch-ment that has experienced, or is still experiencing, land use change.
The combination of comparative analysis and model-based scenario assessment has helped to find general tenden-cies in spite of the particular differences among studied ar-eas. The results possibly depend on both specific catchment characteristics and specific model assumptions, but the indi-vidual effects were similar for all catchment studied. As was concluded by Robinson et al. (2003) a relative consistency of results between regions gives confidence in the generality of the findings. Therefore, these results could be representa-tive for other catchments in similar hydro-climatic regions. In general terms, the potential capacity for flood peak reduc-tion through the concept of “retaining water in the landscape” (i.e., the effectiveness of the particular measures analysed) is clearly a function of the relative storage capacity in the catchment and the event magnitude. This relative storage ca-pacity can be measured by the MAISC index. Also, the ef-fectiveness is dependent upon the rainfall characteristics and antecedent soil moisture conditions, and it is controlled by the spatial distribution of the retention measures within the catchment.
frequently and is thus no longer regularly reminded of this particular risk.
In particular, afforestation and micro-ponds may also have other benefits. Afforestation could play an important role in preventing landslides and related flood processes as it pro-tects the soil from temperature and moisture extremes, as well as offering protection against erosional forces such as raindrop impact (Jewitt, 2005), especially on steep slopes. These effects are likely to be site and possibly event spe-cific (Calder and Aylward, 2006). Micro-ponds managed in conjunction with ecologically sound agricultural practices may help to improve water quality (De Laney, 1995).
Finally, we want to make two sets of recommendations. First, we suggest that the following should be considered for future research in this area:
1. An analysis beyond individual hydrographs or dis-charge time series when examining changes in the flood frequency curve as a support for the analysis of changes in both flood hazard and flood risk (O’Connell et al., 2007).
2. Recent studies call for interdisciplinary frameworks to take into account the ongoing hydro-climatic changes in the context of water-resource risk assessment and plan-ning. To this end, Milly et al. (2008) suggest that future water management measures and landscape changes should be routinely included in climate models. Alter-native techniques to the current scenario approach such as the so-called sensitive methods and trading space for time can add more credibility to model projections (Peel and Bl¨oschl, 2011). Merz et al. (2011) suggest the use of models which can use hydrological response data other than outlet discharges to identify model structures capa-ble of representing hydrological processes in a changing world.
Different strategies for parameter changes due to the pro-posed measures were presented as a function of the model and available information. But, in the case of afforestation scenarios, we found a high uncertainty when translating hy-drological characteristics from the real world to the hydro-logical model parameters. So, in our second set of recom-mendations, we suggest the following:
1. Estimated changes in model parameters could be sup-ported by the use of physical or empirical relationships with uncertainty analysis (Wagener, 2007).
2. A review of experimental results about infiltration fea-tures of top soils and the hydraulic soil conductivities as a function of forest state, development and age. In this respect, a series of field experiments should be consid-ered to add data about the response of these important parameters where needed.
3. Due to the complexity of the interacting processes that could be affected by land use changes and their feed-backs at large spatial scales (Calder and Aylward, 2006), it is necessary to conduct more studies at the catchment scale, as in the project led by the Flood Risk Manage-ment Research Consortium in UK (FRMRC, 2012) and using different data sources (Bulygina et al., 2012).
Acknowledgements. Most of this research was done within the ERANET-Crue project “Room for the River”, which was sponsored by: Lebensministerium (Austria), Bundesministerium f¨ur Bildung und Forschung (Germany) and Ministerio de Ciencia y Educaci´on (Spain). We would like to thank each basin authority and national weather agencies for providing the hydro-meteorological data. The authors would like to thank to the Editor Andreas G¨unther and two anonymous referees for their valuable comments.
Edited by: A. G¨unther
Reviewed by: two anonymous referees
References
Batalla, R. J., Gomez, C. M., and Kondolf, G. M.: Reservoir-induced hydrological changes in the Ebro River basin (NE Spain), J. Hydrol., 290, 117–136, 2004.
Bellot, J., Bonet, A., Sanchez, J., and Chirino, E.: Likely effects of land use changes on the runoff and aquifer recharge in a semiarid landscape using a hydrological model, Landscape Urban Plann., 55, 41–53, 2001.
Beven, K. J.: Predicting the effects of change, in: Rainfall-Runoff Modelling – The Primer, Wiley, Chichester, 277–295, 2001. Bl¨oschl, G., Ardoin-Bardin, S., Bonell, M., Dorninger, M.,
Goodrich, D., Gutknecht, D., Matamoros, D., Merz, B., Shand, P., and Szolgay, J.: At what scales do climate variability and land cover change impact on flooding and low flows?, Hydrol. Pro-cess., 21, 1241–1247, doi:10.1002/hyp.6669, 2007.
Bl¨oschl, G., Reszler, C., and Komma, J.: A spatially distributed flash flood forecasting model, Environ. Model. Soft., 23, 464-478, 2008.
Bronstert, A.: Rainfall-runoff modelling for assessing impacts of climate and land-use change, Hydrol. Process., 18, 567–570, 2004.
Bronstert, A. and B´ardossy, A.: Uncertainty of runoff modelling at the hillslope scale due to temporal variations of rainfall intensity, Phys. Chem. Earth, 28, 283–288, 2003.
Bronstert, A., B´ardossy, A., Bismuth, C., Buiteveld, H., Disse, M., Engel, H., Fritsch, U., Hundecha, Y., Lammersen, R., and Niehoff, D.: Multi-scale modelling of land-use change and river training effects on floods in the Rhine basin, River Res. Applic., 23, 1102–1125, 2007.