www.biogeosciences.net/14/271/2017/ doi:10.5194/bg-14-271-2017
© Author(s) 2017. CC Attribution 3.0 License.
Turnover of microbial groups and cell components in soil:
13
C analysis of cellular biomarkers
Anna Gunina1,2, Michaela Dippold1, Bruno Glaser3, and Yakov Kuzyakov1,4,5
1Department of Agricultural Soil Science, Georg August University of Göttingen, Büsgenweg 2,
37077 Göttingen, Germany
2Department of Soil Biology and Biochemistry, Dokuchaev Soil Science Institute, 119017 Moscow, Russia 3Department of Soil Biogeochemistry, Institute of Agricultural and Nutritional Science, Martin Luther University
Halle-Wittenberg, von-Seckendorff-Platz 3, 06120 Halle (Saale), Germany
4Department of Soil Science of Temperate Ecosystems, Georg August University of Göttingen, Büsgenweg 2,
37077 Göttingen, Germany
5Institute of Environmental Sciences, Kazan Federal University, 420049 Kazan, Russia
Correspondence to:Anna Gunina ([email protected])
Received: 18 May 2016 – Published in Biogeosciences Discuss.: 7 June 2016
Revised: 23 November 2016 – Accepted: 21 December 2016 – Published: 18 January 2017
Abstract. Microorganisms regulate the carbon (C) cycle in soil, controlling the utilization and recycling of organic sub-stances. To reveal the contribution of particular microbial groups to C utilization and turnover within the microbial cells, the fate of13C-labelled glucose was studied under field conditions. Glucose-derived13C was traced in cytosol, amino sugars and phospholipid fatty acid (PLFA) pools at intervals of 3, 10 and 50 days after glucose addition into the soil.
13C enrichment in PLFAs (∼1.5 % of PLFA C at day 3)
was an order of magnitude greater than in cytosol, showing the importance of cell membranes for initial C utilization. The 13C enrichment in amino sugars of living
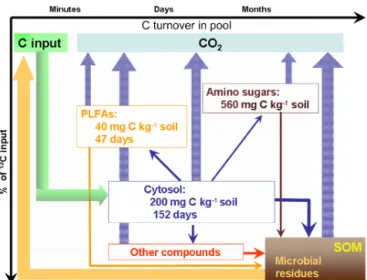
microorgan-isms at day 3 accounted for 0.57 % of total C pool; as a result, we infer that the replacement of C in cell wall components is 3 times slower than that of cell membranes. The C turnover time in the cytosol (150 days) was 3 times longer than in PLFAs (47 days). Consequently, even though the cytosol pool has the fastest processing rates compared to other cel-lular compartments, intensive recycling of components here leads to a long C turnover time.
Both PLFA and amino-sugar profiles indicated that bac-teria dominated in glucose utilization. 13C enrichment de-creased with time for bacterial cell membrane components, but it remained constant or even increased for filamentous microorganisms. 13C enrichment of muramic acid was the 3.5 times greater than for galactosamine, showing a more
rapid turnover of bacterial cell wall components compared to fungal. Thus, bacteria utilize a greater proportion of low-molecular-weight organic substances, whereas filamentous microorganisms are responsible for further C transforma-tions.
Thus, tracing13C in cellular compounds with contrasting turnover rates elucidated the role of microbial groups and their cellular compartments in C utilization and recycling in soil. The results also reflect that microbial C turnover is not restricted to the death or growth of new cells. Indeed, even within living cells, highly polymeric cell compounds are con-stantly replaced and renewed. This is especially important for assessing C fluxes in soil and the contribution of C from mi-crobial residues to soil organic matter.
1 Introduction
part is assimilated into cell polymers and ultimately incorpo-rated into soil organic matter (SOM) after cell death (Kindler et al., 2006). Understanding the fate of substances originated from plants and microbial residues into living biomass is therefore crucial for estimating the recycling of carbon (C) in soil and its stabilization as SOM.
Living microbial biomass (MB) is a highly active and het-erogeneous pool (Malik et al., 2015), although it accounts for only 2–4 % of the total SOM (Jenkinson and Ladd, 1981). Heterogeneity is evident at the level of single cells in the var-ious cellular compartments with different properties, struc-tures and biochemistry: from the highly heterogeneous cy-tosol (Malik et al., 2013) to well-structured cell membranes and cell walls. Due to their chemical composition and func-tions, compounds of cell membranes (phospholipid fatty acids (PLFAs)) and cell walls (amino sugars) have different turnover times within the cell as well as different stabilities within SOM.
Organic compounds that are taken up by microorganisms first enter the cytosol (Gottschalk, 1979), which has a high heterogeneity in composition (includes components of vari-ous chemical structure and molecular weight). However, due to the heterogeneity of this pool, the calculated C turnover time is a mean of C turnover times in various components. The calculated turnover time of intact PLFAs in soil after microbial death is 2.8 days (Kindler et al., 2009); result-ing PLFAs are mainly used to characterize the livresult-ing mi-croorganisms (Frostegard et al., 2011; Rethemeyer, 2004). However, no data concerning turnover time of C in PLFA of living biomass are currently published. The formation of amino sugars from plant biomass is relatively rapid at 6.2– 9.0 days (Bai et al., 2013), whereas their turnover times in soil vary between 6.5 and 81.0 yr−1 (Glaser et al., 2006).
Thus, PLFAs and amino sugars can be used to trace the fate of C within the living microorganisms as well as to estimate the contribution of microbial residues to SOM (Schmidt et al., 2007).
Some cell compartments, such as the cytosol, are not spe-cific for various microbial groups, whereas phospholipids are partly specific and consequently can be used to estimate microbial community structure. Thus, PLFAs of bacterial (i16:0,a16:0,i15:0,a15:0, 16:1ω7, 18:1ω7) and fun-gal communities (18:2ω6,9; 18:3ω6,9,12; 16:1ω5) are used to draw conclusions about the qualitative composition of living microbial communities, their contribution to utiliza-tion of C by various origin (plant or microbial) and to under-stand trophic interactions within the soil (Ruess et al., 2005). In contrast, amino sugars (glucosamine, galactosamine, man-nosamine and muramic acid) are usually used to assess the contributions of bacterial and fungal residues to SOM (En-gelking et al., 2007; Glaser et al., 2004). Muramic acid is of bacterial origin, whereas glucosamine is derived from both fungal and bacterial cell walls (Glaser et al., 2004). Galac-tosamine is more abundant in fungal than in bacterial cell walls (Engelking et al., 2007; Glaser et al., 2004).
Bacteria and fungi have different chemical composition, which strongly contributes to their turnover rates in soil: for bacteria it constitutes 2.3–33 days, whereas for fungi it ac-counts for 130–150 days (Moore et al., 2005; Rousk and Baath, 2007; Waring et al., 2013). Despite the fact that the turnover of microorganisms directly affects the C turnover rates in intercellular compounds (cell membrane and cell wall biomarkers), this relationship has rarely been investi-gated so far. However, the comparison of C turnover for cell membrane and cell wall components can be used to characterize the contribution of various microbial groups to medium-term C utilization and to the stabilization of micro-bially derived C in SOM.
Combination of PLFAs and amino-sugar biomarker anal-yses, as well as cytosol C measurement with isotope tracing techniques (based on13C natural abundance or13C/14C la-belling), has been used in various studies to characterize or-ganic C utilization by microbial community (Bai et al., 2013; Brant et al., 2006). However, to date no systematic studies have compared these contrasting cell compartments in a sin-gle soil within a C turnover experiment. Therefore, this study aimed to examine C allocation to various cell compartments following13C labelling with a ubiquitous monomer, glucose.
Glucose has a higher concentrations in the soil solution com-pared to other low-molecular-weight organics (Fischer et al., 2007), due to its diverse origin: from cellulose decomposi-tion, presence in rhizodeposition (Derrien et al., 2004; Gun-ina and Kuzyakov, 2015), and synthesis by microorganisms. It is also used by most of the microbial groups and is thus the most suitable substance for such a study.
We analysed glucose-derived13C partitioning into the cy-tosol, cell membranes and cell walls in order to evaluate the turnover time of C in each pool and to assess the contribu-tion of bacterial and fungal biomass to SOM. We hypothe-sized that (1) turnover times of C in pools follow the order cytosol < PLFA < amino sugars, because substances taken up by cells first are transported by membrane proteins into cy-tosol, from where they get distributed to other cellular pools, and (2) recovery of13C glucose should be faster and higher
for bacterial than for fungal biomarkers, because bacterial biomass has a faster cell turnover than fungal biomass.
2 Material and methods
2.1 Field site and experimental design
content 22 %, CEC 13 cmolCkg−1. The annual precipitation
is 870 mm and mean annual temperature is+7◦C.
In summer 2010, following harvest of the triticale, columns (diameter 10 cm and height 13 cm) were installed to a depth of 10 cm. Each column contained 1.5 kg of soil and bulk density was 1.36 g cm−3. The 50 mL of uniformly labelled 13C glucose (99 atom %13C) was injected into the columns via a syringe at five points inside the column to spread the tracer homogeneously. The syringe was equipped with a special pipe (13 cm long) with perforations along the whole length, while the end of the pipe was sealed to prevent glucose injection below the column. Each column received 93.4 µmol 13C of tracer (0.06 µmol13C g−1soil), and
simi-lar amounts of non-labelled glucose were applied to the con-trol columns to make the experimental conditions equal. The concentration was chosen to trace the natural pool of glucose in soil solution (Fischer et al., 2007), rather than stimulate the activity or growth of microorganisms.
The experiment was done in four field replicates, which were organized in a randomized block design. Labelled and control columns were present within each block. For the first 10 days of the experiment rainfall was excluded by a protec-tive shelter, which was removed thereafter, with the experi-ment running for 50 days in total. The rainfall was excluded to prevent the added glucose from being leached out from the soil profile, due to processes of microbial uptake progressing slower in the field conditions than in the controlled labora-tory. After 3, 10 and 50 days, separate soil columns (four columns where 13C was applied and four control columns) were destructively sampled. The columns had no vegetation by the collecting time, nor was there any when the13C glu-cose was applied.
The soil was removed from the column and weighed, and the water content was determined in a subsample. Soil mois-ture was determined by drying samples for 24 h at 105◦C and was essentially constant during the experiment, rang-ing between 21 and 25 % (25.7±1.2 (3 days), 23.3±1.3 (10 days), and 21.4±0.7 (50 days)). Each soil sample was sieved to < 2 mm and divided into three parts. One part was stored frozen (−20◦C) for PLFA analysis, another was
cooled (+5◦C) (over 1 week) before the microbial biomass
analysis, and the rest was freeze-dried and used for amino-sugar analysis and for measurement of the total amount of glucose-derived13C remaining in the soil.
2.2 Bulk soilδ13C analysis
The soil for theδ13C analysis was milled andδ13C values of bulk SOM were determined using a Euro EA elemental anal-yser (Eurovector, Milan, Italy) unit coupled via a ConFlo III interface (Thermo Fisher, Bremen, Germany) to a Delta V Advantage isotope ratio mass spectrometer (IRMS; Thermo Fisher, Bremen, Germany). The amount of glucose-derived
13C remaining in the soil was calculated based on a
mix-ing model (Eqs. 1 and 2), where the amount of C in the
background sample in Eq. (1) was substituted according to Eq. (2).
[C]soil·atom%soil= [C]BG·atom%BG+ [C]glc·atom%glc (1)
[C]soil= [C]BG+ [C]glc, (2)
where [C]soil/BG/glc is the C amount of enriched soil
sample/background soil sample/glucose-derived C in soil (mol×g−soil1) and atom %soil/BG/glc is 13C in enriched soil
sample/background soil sample/applied glucose (atom %).
2.3 Cytosol C pool
The cytosol pool was determined by the fumigation– extraction technique from fresh soil shortly after sampling, according to Wu et al. (1990) with slight changes. Briefly, 15 g of fresh soil was placed into glass vials, which were ex-posed to chloroform over 5 days. After removing the rest of chloroform from the soil, the cytosol C was extracted with 45 mL of 0.05 M K2SO4. As the fumigation–extraction
tech-nique produces not only soluble components but also cell or-ganelles and cell particles, we referred to the pool of C in fumigated extracts as “cytosol” only for simplification of ter-minology. Organic C was measured with a high-temperature combustion TOC analyser (multi N/C 2100 analyser, Ana-lytik Jena, Germany). The cytosol pool was calculated as the difference between organic C in fumigated and unfumi-gated samples without correcting for extraction efficiency. After organic C concentrations were measured, the K2SO4
extracts were freeze-dried and theδ13C values of a 30–35 µg subsample were determined using EA-IRMS (instrumenta-tion identical to soilδ13C determination). The recovery of glucose-derived13C in fumigated and unfumigated samples was calculated according to the above-mentioned mixing model (Eqs. 1 and 2). The13C in the microbial cytosol was calculated from the difference in these recoveries.
2.4 Phospholipid fatty acid analysis
The PLFA analysis was performed using the liquid– liquid extraction method of Frostegard et al. (1991) with some modifications (Gunina et al., 2014). Briefly, 6 g of soil was extracted with a 25 mL one-phase mixture of chloroform, methanol and 0.15 M aque-ous citric acid (1:2:0.8 v/v/v) with two extraction steps. The 19:0-phospholipid (dinonadecanoylglycerol-phosphatidylcholine, Larodan Lipids, Malmö, Sweden) was used as internal standard one (IS1) and was added directly to soil before extraction (25 µL with 1 µg µL−1). Additional
by methylation with 0.75 mL of BF3dissolved in methanol.
The resulting fatty acid methyl esters (FAMEs) were purified by liquid–liquid extraction with hexane (three times). Before the final quality and quantity measurements, internal stan-dard two (IS2) (13:0 FAME) (15 µL with 1 µg µL−1)was added to the samples (Knapp, 1979).
All PLFA samples were analysed by gas chromato-graph (GC) (Hewlett Packard 5890 GC coupled to a mass-selective detector 5971A) (Gunina et al., 2014). A 25 m HP-1 methylpolysiloxane column (internal diameter 0.25 mm, film thickness 0.25 µm) was used (Gunina et al., 2014). Peaks were integrated and the ratio to IS2 was calculated for each peak per chromatogram. Substances were quantified using a calibration curve, which was constructed using 29 sin-gle standard substances (13:0, 14:0, i14:0, a14:0, 14: 1ω5, 15:0,i15:0,a15:0, 16:0,a16:0,i16:0, 16:1ω5, 16:1ω7, 10Me16:0, 17:0,a17:0,i17:0,cy17:0, 18:0, 10Me18:0, 18:1ω7, 18:1ω9, 18:2ω6,9, 18:3ω6,9,12, cy19:0, 19:0, 20:0, 20:1ω9, 20:4ω6) at six concentra-tions. The recovery of extracted PLFA was calculated using IS1, and the PLFA contents of samples were individually cor-rected for recovery. Based on the measured PLFA contents, the PLFA C was calculated for the each single compound.
The 13C/12C isotope ratios of the single fatty acids
were determined by an IRMS Delta PlusTM coupled to a gas chromatograph (GC; Trace GC 2000) via a GC-II/III-combustion interface (all units from Thermo Fisher, Bremen, Germany) (Gunina et al., 2014). A 15 m HP-1 methylpolysiloxane column coupled with a 30 m HP-5 (5 % phenyl)-methylpolysiloxane column (both with an internal diameter of 0.25 mm and a film thickness of 0.25 µm) was used. The measuredδ13C values of the fatty acids were cor-rected for the effect of derivative C by analogy to Glaser and Amelung (2002) and were referenced to Pee Dee Belemnite by external standards. The enrichment of13C in single fatty acids was calculated by analogy to bulk soil and cytosol ac-cording to Eqs. (1) and (2), following a two-pool dilution model (Gearing et al., 1991).
2.5 Amino-sugar analysis
Acid hydrolysis was performed to obtain amino sugars from soil and further ion removal was performed according to the method of Zhang and Amelung (1996) with optimization for δ13C determination (Glaser and Gross, 2005). Methyl-glucamine (100 µL, 5 mg mL−1) was used as IS1 and was
added to the samples after hydrolysis. Following iron and salt removal, non-cationic compounds such as monosaccha-rides and carboxylic acids were removed from the extracts using a cation exchange column (AG 50W-X8 resin, H+ form, mesh size 100–200, Biorad, Munich, Germany) (Indorf et al., 2012). For final measurement, IS2 – fructose (50 µL, 1 mg mL−1) – was added to each sample. The amino-sugar
contents and 13C enrichments were determined by
LC-O-IRMS (ICS-5000 SP ion chromatography system coupled
by an LC IsoLink to a Delta V Advantage IRMS (Thermo-Fischer, Bremen, Germany)) (Dippold et al., 2014). Amino sugars were quantified using a calibration curve, which was constructed using four single standard substances (glu-cosamine, galactosamine, mannosamine and muramic acid) as external standards at four different concentrations (Dip-pold et al., 2014).
2.6 Calculations and statistical analysis
Factor analysis with the principal component extraction method of mass % of individual PLFAs was done. The final assignment of fatty acids to distinct microbial groups was made by combining the results of the factor loadings table with databases of the presence of particular fatty acids in mi-crobial groups (Zelles, 1997). Fatty acids which were loaded into the same factor with the same sign (+or −) and be-longed to one group (base of the table provided in Zelles, 1997) were related to one specific microbial group and their PLFA contents were summed. This method enables quality separation of microbial groups within the soils (Apostel et al., 2013; Gunina et al., 2014). The results of the factor anal-ysis are presented in Supplement Table S1.
Recovery of glucose-derived13C (13Crec) (means13C
re-covery represented as % of total applied13C) and enrichment (13Cenrichm)(means13C recovery represented as % of total C
pool) of the cytosol, PLFAs and amino sugars was calculated according to Eqs. (3) and (4), respectively. The C turnover times in the cell pools were calculated as 1/ k; thekvalues were obtained from Eq. (5).
13C rec=
CGlc
13CApplied×100 %, (3)
13C
enrichm=
CGlc
TotalCPool×100 %, (4)
where CGlcis the amount of glucose-derived C incorporated
into a distinct cell compartment calculated by Eqs. (1) and (2) (µmol13C per column),13CApplied is the amount of
ap-plied glucose13C (µmol13C per column), andTotalC Pool is
the amount of pool C (µmol C per column).
Cenrichm(t)=Cenrichm(0)·exp−kt, (5)
where Cenrichm(t)is the13C enrichment of the compartment,
obtained from Eq. (4) at timet(%), Cenrichm(0)is the13C
en-richment of the compartment at time 0 (%),kis the decom-position rate constant (% d−1), andtstands for time (days).
One-way ANOVA was used to estimate the significance of differences in total13C recovery and enrichment of non-specified SOM pool, cytosol, PLFAs and amino sugars. The data always represent the mean of four replications±SE. The13C in the non-specified SOM was calculated by
sub-tracting 13C incorporated into cytosol, PLFAs and amino
sugars from total13C measured in the soil. To describe
was applied to the enrichment of13C in the pool of cytosol, PLFAs and amino sugars (Eq. 5) (Kuzyakov, 2011; Parton et al., 1987).
3 Results
3.1 Glucose utilization and its partitioning within microbial biomass pools
The amino-sugar C pool was the largest, due to accumula-tion of these substances in SOM, whereas pools that mainly characterize living MB showed smaller C contents (Table 1). The cytosol pool (C content 210±7.10 for day 3; 195±14.8 for day 10; 198±19.9 mg C kg−1soil for day 50) as well as nearly all PLFA groups (Table S2) remained constant during the experiment.
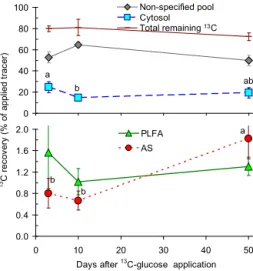
The highest recovery of 13C was found for cytosol pool
(15–25 % of applied 13C), whereas the lowest was reported
for amino sugars (0.8–1.6 % of applied13C) (Fig. 1). The re-covery of glucose-derived13C in the cytosol pool decreased over time, with the largest decline from day 3 to day 10, and then remained constant for the following month (Fig. 1). The
13C recovery into PLFA was generally very low and was in
the same range as recovery into amino sugars (Fig. 1). The
13C recovery in PLFA showed no clear trend between the
sampling points (high standard error) (Fig. 1). In contrast,
13C recovery in amino sugars increased 2-fold on the 50th
day of the experiment (p<0.05).
3.2 Turnover time of C in microbial biomass pools
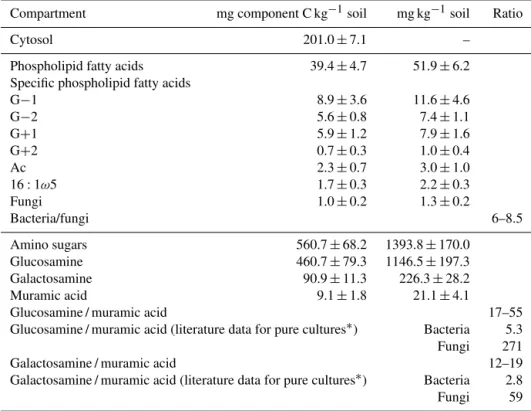
To evaluate C turnover in the cytosol, PLFAs and amino sug-ars, we calculated the enrichment (% of incorporated13C rel-atively to pool C) of each pool by glucose-derived13C. The pool enrichment was the highest for PLFAs and the lowest for amino sugars (Fig. 2).
Based on the decrease in 13C enrichments over time (Fig. 2), the C turnover times in the cytosol and PLFAs were calculated as 151 and 47 days, respectively. The C turnover time in the amino-sugar pool could not be calculated by this approach because the maximum enrichment had not yet been reached and, consequently, a decomposition function could not be fitted.
3.3 Phospholipid fatty acids
Fatty acids of bacterial origin dominated over those of fungal origin within the living microbial community characterized by PLFA composition (Table 1). The PLFA content of most groups did not change significantly during the experiment, reflecting steady-state conditions for the microbial commu-nity (see Table S2).
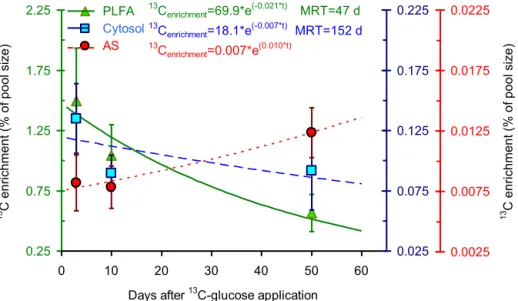
Higher 13C recovery was found in bacterial than in
fun-gal PLFAs (Fig. 3, top). Remarkably, the 13C enrichment
decreased over time for all bacterial PLFAs, whereas it
in-0 20 40 60 80
100 Non-specified pool Cytosol Total remaining 13C
b a
ab
0.0 0.4 0.8 1.2 1.6 2.0
0 10 20 30 40 50
PLFA AS
a
b b
Days after 13
C-glucose application
1
3C
r
ec
ov
er
y
(
%
o
f
a
pp
lie
d
t
ra
c
e
r)
Figure 1.Partitioning of glucose-derived13C in SOM presented as
the13C recovery (% of initially applied13C) between the following
pools: non-specified SOM (calculated as total13C recovery subtract
13C recovery in cytosol, PLFAs and amino sugars), cytosol, PLFAs
and amino sugars. Brown line indicates the total remaining
glucose-derived13C glucose in the soil and is a sum of13C in non-specified
SOM, cytosol, PLFAs and amino sugars. Small letters reflect dif-ferences between the sampling points for the distinct pool. Data
present mean (n=4) and bars present standard errors (SEs). The
SEs for the amino sugars are not fully shown.
creased or remained constant for 16:1ω5, fungi and actino-mycetes (Fig. 3, bottom), indicating differences in C turnover in single-celled organisms compared to filamentous organ-isms.
3.4 Amino sugars
The content of amino sugars followed the order muramic acid <galactosamine < glucosamine (Table 1). The galac-tosamine / muramic acid ratio ranged between 12 and 19 (Ta-ble 1), showing that bacterial residues were dominant in the composition of microbial residues in SOM.
The recovery of glucose-derived 13C into amino sug-ars increased in the order muramic acid=galactosamine < glucosamine (Fig. 4, top), partly reflecting their pool sizes. The13C recovery showed no increase from day 3 to day 50 for any amino sugars. The ratio of galactosamine / muramic acid, calculated for the incorporated13C, was about six. This is much lower than the ratio observed for the pools of amino sugars. The13C enrichment did not increase from day 3 to day 50 for any of the amino sugars. The highest enrichment was observed for muramic acid and the lowest for galac-tosamine (Fig. 4, bottom). The13C enrichment in amino
Table 1. Amount of microbial biomass compartments, their C content, PLFA content of microbial groups and composition of microbial residues in investigated soil. G−1 and G−2 are Gram-negative group one and two, respectively; G+1 and G+2 are Gram-positive group one
and two, respectively; Ac – actinomycetes; 16:1ω5 – saprotrophic fungi. Data present mean of three time points (with four replications for
each time point)±SE.
Compartment mg component C kg−1soil mg kg−1soil Ratio
Cytosol 201.0±7.1 –
Phospholipid fatty acids 39.4±4.7 51.9±6.2
Specific phospholipid fatty acids
G−1 8.9±3.6 11.6±4.6
G−2 5.6±0.8 7.4±1.1
G+1 5.9±1.2 7.9±1.6
G+2 0.7±0.3 1.0±0.4
Ac 2.3±0.7 3.0±1.0
16:1ω5 1.7±0.3 2.2±0.3
Fungi 1.0±0.2 1.3±0.2
Bacteria/fungi 6–8.5
Amino sugars 560.7±68.2 1393.8±170.0
Glucosamine 460.7±79.3 1146.5±197.3
Galactosamine 90.9±11.3 226.3±28.2
Muramic acid 9.1±1.8 21.1±4.1
Glucosamine / muramic acid 17–55
Glucosamine / muramic acid (literature data for pure cultures∗) Bacteria 5.3
Fungi 271
Galactosamine / muramic acid 12–19
Galactosamine / muramic acid (literature data for pure cultures∗) Bacteria 2.8
Fungi 59
∗Data are taken from Glaser et al. (2004).
4 Discussion
4.1 Glucose decomposition
The amount of glucose-derived 13C remaining in soil af-ter 50 days was in the range 80 % which was higher than reported by other studies. Glanville et al. (2012) observed that 50 % of glucose C remained in SOM after 20 days; Wu et al. (1993) reported that 55 % of glucose-derived 14C
re-mained after 50 days; Perelo and Munch (2005) reported the mineralization of 50 % of 13C glucose within 98 days. The amounts of applied C (Bremer and Kuikman, 1994; Schneck-enberger et al., 2008), as well as differences in microbial ac-tivity (Bremer and Kuikman, 1994; Schimel and Weintraub, 2003) in the investigated soils, explain the variations between studies in the portion of remaining glucose C.
The highest mineralization of glucose-derived13C (20 %) was found within the first 3 days after tracer application (Fig. 1), whereas at day 50 mineralization was much slower. Glucose is decomposed in soil in two stages (Gunina and Kuzyakov, 2015): during the first one, part of glucose C is immediately mineralized to CO2and part is incorporated into
the microbial compartments; and second one, when C incor-porated into MB is further transformed and is used for mi-crobial biosynthesis, and mineralization of glucose-C to CO2
occurs much slower (Bremer and Kuikman, 1994). This first stage takes place in the first day after substrate addition and is 30 times faster than the second stage (Gregorich et al., 1991; Fischer et al., 2010). Due to the first sampling point in our experiment was 3 days after glucose addition, the obtained data on glucose mineralization can be mainly related to the second stage.
0.25 0.75 1.25 1.75 2.25
0 10 20 30 40 50 60
0.025 0.075 0.125 0.175 0.225 PLFA Cytosol AS 13
Cenrichment=69.9*e(-0.021*t) MRT=47 d
13
Cenrichment=18.1*e (-0.007*t)
MRT=152 d
13
Cenrichment=0.007*e (0.010*t) 13 C e n ri ch me n t (% o f p o o l si ze )
Days after C13 -glucose application
13 C e n ri ch me n t (% o f p o o l si ze ) 0.0025 0.0075 0.0125 0.0175 0.0225
Figure 2.13C enrichment in the cytosol, PLFA and amino-sugar cell pools as well as functions to calculate the C turnover times in these
microbial cell pools. The leftyaxis represents the PLFA pool, the first rightyaxis the cytosol, and the secondyaxis the amino-sugar pool.
Data present mean (n=4) and bars present standard errors.
0 0.1 0.2 0.3 0.4 % o f C p oo l s iz e
3 10 50 3 10 50 3 10 50 3 10 50 3 10 50 3 10 50 3 10 50
Days after 13C-glucose application
a l x* x m b mn bc yz bcd no xy mn 13
C enrichm ent
0 0.2 0.4 0.6 % o f a p pl ie d g lu c o s e C 1 3
G-1 G-2 G+1 G+2 Ac 16:1w 5 Fu n gi x* xy y y 13 C recovery 0 0.02 0.04 0.06 y* y 0 0.02 0.04
yz* cd yz
o d
o
Figure 3.Recovery of glucose-derived13C (top) and13C enrichment (bottom) of the microbial PLFAs. Note that the values for 16:1ω5
and fungi are scaled up 10 times (secondaryyaxis) compared to those of other groups (yaxis on the left). Data present the mean (n=4)
and bars present standard errors. Small letters reflect differences between the microbial groups for13C recovery and13C enrichment from
glucose; letters (a–d) are for day 3, (l–o) are for day 10, and (x–z) are for day 50.
4.2 Partitioning of13C-derived glucose between cell compounds
To estimate the residual amount of C derived from applied
13C-labelled low-molecular-weight organic substances
Fur-0 0.4 0.8 1.2
1.6 Galactosamine Glucosamine Muramic acid
%
o
f
a
p
pl
ie
d
g
lu
c
o
s
e
C
13
a
b b
l
m
m x
y
y 13
C recovery
0.000 0.002 0.004 0.006 0.008
3 10 50 3 10 50 3 10 50
%
of
C
pool
s
iz
e
b b
a x
y
y
Days after 13C-glucose application
13
C enrichment
Figure 4.Recovery of glucose-derived13C (top) and13C enrich-ment (bottom) of amino sugars and muramic acid. Letters reflect
significant differences in the recovery and13C enrichment from
glu-cose13C into amino sugars on a particular day; letters (a–b) are for
day 3, (l–m) are for day 10, and (x–y) are for day 50. No significant differences were observed between the three sampling days. Data
present mean (n=4) and bars present standard errors.
thermore, the living MB contains cell compartments with a broad spectrum of C turnover times. The approach applied in the present study allows the partitioning of glucose-derived C in living MB to be estimated, as well as the contribution of LMWOS-C to SOM composition.
4.3 Cytosol
We calculated the13C enrichment of the cytosol C pool, ex-tracted after chloroform fumigation. The estimated turnover time of C in this pool was about 151 days. This value lies close to the previously reported range of 87–113 days, for the same pool for soils incubated for 98 days with13C
glu-cose (Perelo and Munch, 2005), but was lower than MB C turnover time calculated using a conversion factor (2.22) for soils incubated for 60 days with14C glucose (Kouno et al., 2002). The long C turnover time in cytosol is related to the high heterogeneity of this pool, which includes compounds with various molecular masses (Malik et al., 2013) and func-tions, with different turnover times. Thus, C turnover time in cytosol presents the mean value of turnover times of these compounds.
4.4 Phospholipid fatty acids
4.4.1 Phospholipid fatty acid content and turnover
Phospholipid fatty acid C comprised 0.27 % of the soil organic carbon (SOC). The 13C recovery into PLFAs, in the case of constant PLFAs content during the experi-ment, reflects microbial activity under steady-state condi-tions (growth and death of microorganisms occur with the same rates) and processes of the exchange and replacement of existing PLFA C within living cells.
Few studies have estimated the C turnover time in PLFAs or the turnover time of PLFAs themselves in soil, as very few options exist to estimate these parameters under steady-state conditions. The turnover time of13C-labelled PLFAs con-tained in dead microbial cells was 2.7 days (Kindler et al., 2009). The PLFAs turnover times estimated in the field con-ditions using a C3–C4 vegetation change (Amelung et al.,
2008; Glaser, 2005) or14C dating (Rethemeyer et al., 2005)
were between 1 and 80 years. However, these approaches es-timate the turnover time of C bound in PLFA, which can be much older than the PLFA molecules due to repeated C recy-cling before incorporation. In contrast,13C pulse labelling is an approach that enables direct estimation of the turnover of freshly added C by the initial recovery peak. The approach used in the present study showed that the C turnover time in PLFA is about 47 days (Fig. 2). Accordingly, if the decom-position after cell death is about 3 days, the PLFA turnover time in living cells is about 44 days. This short turnover time of PLFAs is significantly lower than the C turnover time in the cytosol (Figs. 2, 5). This is because the membrane is an interacting surface between the cell and the environment, and thus frequent and rapid adaptations of its structure are crucial for active microorganisms (Bossio et al., 1998; Kieft et al.,1997). In contrast, the extracted cytosol pool includes C from both active and dormant microorganisms (Blago-datskaya and Kuzyakov, 2013), and the latter can dilute the
13C signal incorporated into the active pool with non-labelled
C, yielding a lower turnover of this pool.
4.4.2 Contribution of microbial groups to glucose-derived C utilization
More glucose-derived 13C was incorporated into bacterial PLFAs (Fig. 3, top), than into filamentous microorganisms. This can be a consequence of low C loading rates (less than 4 mg C g−1soil; see Reischke et al., 2014), under which
con-ditions the added C is utilized primarily by bacterial com-munities, whereas at higher concentrations of applied sub-strate the dominance of fungi in subsub-strate utilization is ob-served (Reischke et al., 2014).
The 13C recovery into Gram-negative fatty acids was
Figure 5.Dynamic relationships between microbial glucose utiliza-tion and C turnover times in cytosol, cell membrane and cell wall components.
or (ii) glucose uptake activity, which was higher for G−than G+ groups. In contrast, the13C enrichment (13C recovery
related to total C in particular biomarkers) for G−bacterial PLFAs was not higher than that for G+ (Fig. 3, bottom). Thus, the high 13C recovery into G−bacterial biomarkers can mainly correspond to their high content in the soil, not to higher activity of microbial groups. However, enrichment of PLFA C by glucose-derived 13C is only a proxy of mi-crobial activity and can only partly estimate the real activity of microbial groups. This clearly suggests that the analysis of isotope data after labelling in general requires the calcu-lation and combined interpretation of both the total tracer C recovery and the13C enrichment in the investigated pool.
In contrast to our results, a higher recovery of glucose-derived13C into G+than G−PLFAs was observed in other
studies (Dungait et al., 2011; Ziegler et al., 2005). However, in these studies, much higher amounts of C were applied to the soil (15 µg C g−1 soil), which stimulated the growth of
G+bacteria. In contrast, under steady-state conditions with low glucose concentrations in soil, G− bacteria were the most competitive group for glucose uptake (Fig. 3).
The 13C enrichment of bacterial PLFAs decreased from day 3 to day 50, whereas 13C in fungal PLFAs increased (in the case of 16:1ω5) or stayed constant (Fig. 3, bot-tom). The decrease in13C enrichment in bacterial fatty acids indicates a partial turnover of bacterial lipid membranes, which is much faster than turnover in fungal membranes. This result is consistent with the turnover time of bacte-rial biomass in soil (Baath, 1998), which is about 10 days, whereas fungal biomass turnover times range between 130 and 150 days (Rousk and Baath, 2007). Consequently, the increase in13C enrichment in fungal PLFAs at late sampling
points indicates that fungi consume the exudation products of
bacteria or even dead bacterial biomass (Zhang et al., 2013; Ziegler et al., 2005).
4.5 Amino sugars
4.5.1 Amino-sugar content and amino-sugar C turnover in total and living microbial cell walls
Amino sugars represented the largest microbial pool in-vestigated in this study (Table 1) and comprised 3.7 % of SOC. Chitin and peptidoglycan, the direct sources of the amino sugars, comprise no more than 5 % of cell biomass (Park and Uehara, 2008; Wallander et al., 2013). Therefore, the high amount of amino sugars, relative to PLFAs, can only be explained by their high proportion in mi-crobial residues/necromass (Glaser et al., 2004; Liang et al., 2008). Irrespective of the large pool size of the amino sug-ars, their recovery and pool enrichment with glucose-derived
13C was the lowest compared to other compartments in
liv-ing cells and increased durliv-ing the experiment. Consequently, amino sugars can have the slowest turnover in soils, presum-ably even within living cells, for three reasons: (1) cell walls are polymers that require a rather complex biosynthesis of the amino-sugar fibres, (2) cell wall polymerization occurs extracellularly (Lengeler et al., 1999) and (3) microorgan-isms do not need to synthesize peptidoglycan unless they multiply. To calculate C turnover time in this pool, it is nec-essary to conduct long-term experiments.
The majority of amino sugars, extracted after acid hydrol-ysis, represent microbial necromass, which does not incor-porate any glucose-derived13C but strongly dilutes the13C incorporated into the walls of living cells. To estimate the
13C enrichment into amino sugars of living cells, we first
4.5.2 Contribution of bacterial and fungal cell walls to SOC
Glucosamine was the dominant amino sugar in the soil, whereas muramic acid was the least abundant (Table 1), which agrees with the most literature data (Engelking et al., 2007; Glaser et al., 2004). To conclude about the propor-tions of bacterial and fungal residues in the SOM, the ratio of galactosamine / muramic acid (Glaser et al., 2004) was calcu-lated (Table 1), showing bacteria to be the dominant within the soil microbial community. The bacterial origin of micro-bial residues in the soil is supported by (1) the dominance of bacterial PLFA biomarkers and (2) the environmental con-ditions of the site, namely long-term agricultural use, which promotes the development of bacterial communities.
Three-fold more glucose-derived 13C was recovered in glucosamine than in galactosamine and muramic acid (Fig. 4, top). This correlates with the pool size and indicates that glu-cosamine is the most dominant amino sugar not only in total amino sugars but also within the walls of living cells. The galactosamine / muramic acid ratio of the incorporated 13C was 6 and, consequently, was significantly lower than the ra-tio calculated for the amount of amino sugars (Table 1). This indicates that bacteria are more active in glucose-derived13C utilization than fungi, a conclusion also supported by the
13C-PLFA data (Fig. 3, top). Thus, even if the composition
of amino sugars does not allow a clear conclusion concern-ing livconcern-ing microbial communities in soil, amino-sugar analy-sis combined with13C labelling reveals the activity of living microbial groups in terms of substrate utilization.
The calculated13C enrichment was the highest in muramic acid (Fig. 4, bottom). This is in agreement with the high
13C enrichment of bacterial PLFAs compared to 16:1ω5
and fungi (Fig. 3). Due to differences in cell wall architec-ture, G+bacteria contain more muramic acid (approximately 4 times) than G−bacteria (Lengeler et al., 1999) and thus make a higher contribution to the13C enrichment of muramic acid.
The13C enrichment of glucosamine was 2-fold lower than muramic acid (Fig. 4, bottom). This confirms the hypothe-sis that glucosamine originates from bacterial as well as fun-gal cell walls and, consequently, has a mixed enrichment be-tween the fungal galactosamine and bacterial muramic acid.
5 Conclusions
Tracing the 13C-labelled glucose through cytosol, PLFAs and amino sugars is a prerequisite for understanding the fate of organic substrates in soil and can be used to es-timate C turnover times in various microbial cell com-partments. In contradiction to the first hypothesis, the C turnover times were as follows: PLFA (47 days) < cytosol (150 days) < amino sugars. The long C half-life in cytosol can be explained by efficient C recycling and cytosol
het-erogeneous composition, which involves compounds with different turnover rates. Due to significant part of amino-sugar pool was in the composition of microbial residues, the 13C enrichment of this pool was still increasing at the end of the experiment, which reflects the slowest C turnover time here. An approximate calculation of13C enrichment of amino sugars in the living biomass accounted for 0.57 % of pool size, which was lower than for PLFAs. This reflects that C turnover in cell wall components is slower than in mem-brane components.
Both PLFA and amino-sugar analysis showed the preva-lence of bacterial biomass/bacterial residues in investigated soil. Much higher recovery and enrichment by
glucose-13C was found in bacterial than in fungal PLFAs. A lower 13C enrichment of filamentous PLFAs compared to
bacte-rial demonstrates that (i) C turnover in filamentous PLFAs is slower compared to bacterial and (ii) filamentous organisms might consume bacterial biomass and utilize products of its metabolism. The ratio of galactosamine / muramic acid for incorporated13C evidences that bacteria were more active in glucose utilization than fungi. The13C enrichment was the highest for muramic acid and the lowest for galactosamine, demonstrating that the turnover of bacterial cell wall compo-nents is more rapid than fungal. Consequently, the combina-tion of13C labelling with the subsequent analysis of several microbial cell compartments and biomarkers is a unique ap-proach to understanding C partitioning within microbial cells and the microbial communities in soil. This knowledge is not only crucial for assessing C fluxes and recycling in soil but also important for estimating the contribution of C from mi-crobial residues to SOM.
6 Data availability
Underlying research data can be accessed by request from the first author of the paper.
The Supplement related to this article is available online at doi:10.5194/bg-14-271-2017-supplement.
Author contributions. Yakov Kuzyakov and Bruno Glaser designed the experiments and Michaela Dippold and Anna Gunina carried them out. Anna Gunina prepared the manuscript with contributions from all co-authors.
University Halle-Wittenberg, for performing the bulk isotope and amino-sugar measurements. Thanks are extended to MolTer and DAAD, which provided a fellowship for Anna Gunina. We are very grateful to the Centre for Stable Isotope Research and Analysis
(KOSI) of the University of Göttingen for theδ13C measurements.
This open-access publication was funded by the University of Göttingen.
Edited by: E. Pendall
Reviewed by: P. Dijkstra and one anonymous referee
References
Amelung, W., Brodowski, S., Sandhage-Hofmann, A., and Bol, R.: Combining biomarker with stable isotope analyses for assess-ing the transformation and turnover of soil organic matter, in: Advances in Agronomy, edited by: Sparks, D. L., Advances in Agronomy, 100, 155–250, 2008.
Amelung, W., Kimble, J. M., Samson-Liebig, S., and Follett, R. F.: Restoration of microbial residues in soils of the Conservation Re-serve Program, Soil Sci. Soc. Am. J., 65, 1704–1709, 2001a. Amelung, W., Miltner, A., Zhang, X., and Zech, W.: Fate of
micro-bial residues during litter decomposition as affected by miner-als, Soil Sci., 166, 598–606, doi:10.1097/00010694-200109000-00003, 2001b.
Apostel, C., Dippold, M. A., Glaser, B., and Kuzyakov, Y.: Bio-chemical pathways of amino acids in soil: Assessment by
position-specific labeling and 13C-PLFA analysis, Soil Biol.
Biochem., 67, 31–40, 2013.
Baath, E.: Growth rates of bacterial communities in soils at varying pH: A comparison of the thymidine and leucine
incorporation techniques, Microb. Ecol., 36, 316–327,
doi:10.1007/s002489900118, 1998.
Bai, Z., Bode, S., Huygens, D., Zhang, X., and Boeckx, P.: Kinetics of amino sugar formation from organic residues of different quality, Soil Biol. Biochem., 57, 814–821, doi:10.1016/j.soilbio.2012.08.006, 2013.
Blagodatskaya, E. and Kuzyakov, Y.: Active microorganisms in soil: critical review of estimation criteria and approaches, Soil Biol. Biochem., 67, 192–211, 2013.
Bossio, D. A., Scow, K. M., Gunapala, N., and Graham, K. J.: De-terminants of soil microbial communities, Effects of agricultural management, season, and soil type on phospholipid fatty acid profiles, Microb. Ecol., 36, 1–12, doi:10.1007/s002489900087, 1998.
Brant, J. B., Sulzman, E. W., and Myrold, D. D.: Microbial commu-nity utilization of added carbon substrates in response to long-term carbon input manipulation, Soil Biol. Biochem., 38, 2219– 2232, doi:10.1016/j.soilbio.2006.01.022, 2006.
Bremer, E. and Kuikman, P.: Microbial utilization of14C-U-glucose
in soil is affected by the amount and timing of glucose ad-ditions, Soil Biol. Biochem., 26, 511–517, doi:10.1016/0038-0717(94)90184-8, 1994.
Derrien, D., Marol, C., and Balesdent, J.: The dynamics of neu-tral sugars in the rhizosphere of wheat. An approach by C-13 pulse-labelling and GC/C/IRMS, Plant Soil, 267, 243–253, doi:10.1007/s11104-005-5348-8, 2004.
Dippold, M. A., Boesel, S., Gunina, A., Kuzyakov, Y., and Glaser, B.: Improved delta C-13 analysis of amino sugars in soil by ion chromatography-oxidation-isotope ratio mass spectrometry, Rapid Commun. Mass Sp., 28, 569–576, doi:10.1002/rcm.6814, 2014.
Dungait, J. A. J., Kemmitt, S. J., Michallon, L., Guo, S., Wen, Q., Brookes, P. C., and Evershed, R. P.: Variable responses of the
soil microbial biomass to trace concentrations of13C-labelled
glucose, using13C-PLFA analysis, Eur. J. Soil Sci., 62, 117–126,
doi:10.1111/j.1365-2389.2010.01321.x, 2011.
Engelking, B., Flessa, H., and Joergensen, R. G.: Shifts in amino sugar and ergosterol contents after addition of sucrose and cellulose to soil, Soil Biol. Biochem., 39, 2111–2118, doi:10.1016/j.soilbio.2007.03.020, 2007.
Fischer, H., Meyer, A., Fischer, K., and Kuzyakov, Y.: Carbohy-drate and amino acid composition of dissolved organic mat-ter leached from soil, Soil Biol. Biochem., 39, 2926–2935, doi:10.1016/j.soilbio.2007.06.014, 2007.
Fischer H., Ingwersen J., and Kuzyakov Y.: Microbial uptake of low-molecular-weight organic substances out-competes sorption in soil, Eur. J. Soil Sci., 61, 504–513, 2010.
Frostegard, A., Tunlid, A., and Baath, E.: Microbial biomass measured as total lipid phosphate in soils of different organic content, J. Microbiol. Meth., 14, 151–163, doi:10.1016/0167-7012(91)90018-l, 1991.
Frostegard, A., Tunlid, A., and Baath, E.: Use and misuse of PLFA measurements in soils, Soil Biol. Biochem., 43, 1621–1625, doi:10.1016/j.soilbio.2010.11.021, 2011.
Gearing, P. J., Gearing, J. N., Maughan, J. T., and Oviatt, C. A.: Iso-topic Distribution of Carbon from Sewage Sludge and Eutrophi-cation in the Sediments and Food Web of Estuarine Ecosystems, Environ. Sci. Technol., 25, 295–301, 1991.
Glanville, H., Rousk, J., Golyshin, P., and Jones, D. L.: Mineraliza-tion of low molecular weight carbon substrates in soil soluMineraliza-tion under laboratory and field conditions, Soil Biol. Biochem., 48, 88–95, doi:10.1016/j.soilbio.2012.01.015, 2012.
Glaser: Compound-specific stable-isotope (d13C) analysis in soil
science, 2005.
Glaser, B. and Amelung, W.: Determination of13C natural
abun-dance of amino acid enantiomers in soil: methodological con-siderations and first results, Rapid Commun. Mass Sp., 16, 891– 898, doi:10.1002/rcm.650, 2002.
Glaser, B. and Gross, S.: Compound-specificδ13C analysis of
in-dividual amino sugars – a tool to quantify timing and amount of soil microbial residue stabilization, Rapid Commun. Mass Sp., 19, 1409–1416, doi:10.1002/rcm.1913, 2005.
Glaser, B., Turrion, M. B., and Alef, K.: Amino sugars and muramic acid – biomarkers for soil microbial commu-nity structure analysis, Soil Biol. Biochem., 36, 399–407, doi:10.1016/j.soilbio.2003.10.013, 2004.
Glaser, B., Millar, N., and Blum, H.: Sequestration and turnover of bacterial- and fungal-derived carbon in a temperate grassland
soil under long-term elevated atmosphericpCO2, Glob. Change
Biol., 12, 1521–1531, doi:10.1111/j.1365-2486.2006.01186.x, 2006.
Gottschalk, G.: Bacterial Metabolism, Springer-Verlag New York, New York, 1979.
textures, Soil Biol. Biochem., 23, 799–805, doi:10.1016/0038-0717(91)90152-a, 1991.
Gunina, A. and Kuzyakov, Y.: Sugars in soil and sweets for microor-ganisms: Review of origin, content, composition and fate, Soil Biol. Biochem., 90, 87–100, doi:10.1016/j.soilbio.2015.07.021, 2015.
Gunina, A., Dippold, M., Glaser, B., and Kuzyakov, Y.: Fate of low molecular weight organic substances in an arable soil: From microbial uptake to utilisation and stabilisation, Soil Biol. Biochem., 77, 304–313, 2014.
Indorf, C., Stamm, F., Dyckmans, J., and Joergensen, R. G.: De-termination of saprotrophic fungi turnover in different sub-strates by glucosamine-specific delta C-13 liquid chromatogra-phy/isotope ratio mass spectrometry, Fungal Ecol., 5, 694–701, doi:10.1016/j.funeco.2012.07.001, 2012.
IUSS Working Group WRB: World Reference Base for Soil Re-sources 2014, update 2015 International soil classification sys-tem for naming soils and creating legends for soil maps, World Soil Resources Reports No. 106, FAO, Rome, 2015.
Jenkinson, D. S. and Ladd, J. N.: Microbial biomass in soil: mea-surement and turnover, Soil Biochemistry, Marcel Dekker, New York, 415–471, 1981.
Kieft, T. L., Wilch, E., O’Connor, K., Ringelberg, D. B, and White, D. C.: Survival and phospholipid fatty acid profiles of surface and subsurface bacteria in natural sediment microcosms, Appl. Environ. Microbiol., 63, 1531–1542, 1997.
Kindler, R., Miltner, A., Richnow, H.-H., and Kaestner, M.: Fate of gram-negative bacterial biomass in soil – mineralization and contribution to SOM, Soil Biol. Biochem., 38, 2860–2870, doi:10.1016/j.soilbio.2006.04.047, 2006.
Kindler, R., Miltner, A., Thullner, M., Richnow, H.-H., and Kaest-ner, M.: Fate of bacterial biomass derived fatty acids in soil and their contribution to soil organic matter, Org. Geochem., 40, 29– 37, doi:10.1016/j.orggeochem.2008.09.005, 2009.
Knapp, D.: Handbook of Analytical Derivatization Reagents, Wiley, New York, 1979.
Kouno, K., Wu, J., and Brookes, P. C.: Turnover of biomass C and P in soil following incorporation of glucose or ryegrass, Soil Biol. Biochem., 34, 617–622, doi:10.1016/s0038-0717(01)00218-8, 2002.
Kuzyakov, Y.: How to link soil C pools with CO2fluxes?,
Biogeo-sciences, 8, 1523–1537, doi:10.5194/bg-8-1523-2011, 2011. Lengeler, J. W., Drews, G., and Schlegel, H. G.: Biology of the
prokaryotes, Georg Thieme Verlag, 955, 110–163, 1999. Liang, C., Fujinuma, R., and Balser, T. C.: Comparing PLFA
and amino sugars for microbial analysis in an Upper Michi-gan old growth forest, Soil Biol. Biochem., 40, 2063–2065, doi:10.1016/j.soilbio.2008.01.022, 2008.
Lutzow, M. v., Koegel-Knabner, I., Ekschmitt, K., Matzner, E., Guggenberger, G., Marschner, B., and Flessa, H.: Stabilization of organic matter in temperate soils: mechanisms and their rele-vance under different soil conditions – a review, Eur. J. Soil Sci., 57, 426–445, doi:10.1111/j.1365-2389.2006.00809.x, 2006. Malik, A., Blagodatskaya, E., and Gleixner, G.: Soil microbial
carbon turnover decreases with increasing molecular size, Soil Biol. Biochem., 62, 115–118, doi:10.1016/j.soilbio.2013.02.022, 2013.
Malik, A., Dannert, H., Griffiths, R. I., Thomson, B. C., and Gleixner, G.: Rhizosphere bacterial carbon turnover is higher
in nucleic acids than membrane lipids: implications for un-derstanding soil carbon cycling, Front. Microbiol., 6, 268, doi:10.3389/fmicb.2015.00268, 2015.
Moore, J. C., McCann, K., and Ruiter, P. C. de: Modeling trophic pathways, nutrient cycling, and dynamic stability in soils, Pedo-biologia, 49, 499–510, doi:10.1016/j.pedobi.2005.05.008, 2005. Park, J. T. and Uehara, T.: How bacteria consume their own exoskeletons (Turnover and recycling of cell wall peptidoglycan), Microbiol. Mol. Biol. R., 72, 211–227, doi:10.1128/mmbr.00027-07, 2008.
Parton, W. J., Schimel, D. S., Cole, C. V., and Ojima, D. S.: Analysis of factors controlling soil organic matter levels in Great Plains grasslands, Soil Sci. Soc. Am. J., 51, 1173–1179, 1987. Perelo, L. W. and Munch, J. C.: Microbial immobilisation and
turnover of13C labelled substrates in two arable soils under field
and laboratory conditions, Soil Biol. Biochem., 37, 2263–2272, doi:10.1016/j.soilbio.2005.02.039, 2005.
Reischke, S., Rousk, J., and Bååth, E.: The effects of glucose loading rates on bacterial and fungal growth in soil, Soil Biol. Biochem., 70, 88–95, 2014.
Rethemeyer, J.: Age heterogeneity of soil organic matter, 2004. Rethemeyer, J., Kramer, C., Gleixner, G., John, B., Yamashita, T.,
Flessa, H., Andersen, N., Nadeau, M. J., and Grootes, P. M.: Transformation of organic matter in agricultural soils: radiocar-bon concentration versus soil depth, Geoderma, 128, 94–105, doi:10.1016/j.geoderma.2004.12.017, 2005.
Rousk, J. and Baath, E.: Fungal biomass production
and turnover in soil estimated using the
acetate-in-ergosterol technique, Soil Biol. Biochem., 39, 2173–2177, doi:10.1016/j.soilbio.2007.03.023, 2007.
Ruess, L., Schutz, K., Haubert, D., Haggblom, M. M., Kandeler, E., and Scheu, S.: Application of lipid analysis to understand trophic interactions in soil, Ecology, 86, 2075–2082, doi:10.1890/04-1399, 2005.
Schimel, J. P. and Weintraub, M. N.: The implications of exoen-zyme activity on microbial carbon and nitrogen limitation in soil: a theoretical model, Soil Biol. Biochem., 35, 549–563, 2003. Schmidt, S. K., Costello, E. K., Nemergut, D. R., Cleveland, C.
C., Reed, S. C., Weintraub, M. N., Meyer, A. F., and Mar-tin, A. M.: Biogeochemical consequences of rapid microbial turnover and seasonal succession in soil, Ecology, 88, 1379– 1385, doi:10.1890/06-0164, 2007.
Schneckenberger, K., Demin, D., Stahr, K., and Kuzyakov, Y.:
Mi-crobial utilization and mineralization of14C glucose added in six
orders of concentration to soil, Soil Biol. Biochem., 40, 1981– 1988, doi:10.1016/j.soilbio.2008.02.020, 2008.
Wagner, G. H.: Significance of microbial tissue to soil organic matter. In: Isotopes and radiation in soil organic matter studies, FAO/IAEA, Vienna, 197–205, 1968.
Wallander, H., Ekblad, A., Godbold, D. L., Johnson, D., Bahr, A., Baldrian, P., Bjork, R. G., Kieliszewska-Rokicka, B., Kjoller, R., Kraigher, H., Plassard, C., and Rudawska, M.: Evaluation of methods to estimate production, biomass and turnover of ec-tomycorrhizal mycelium in forests soils – A review, Soil Biol. Biochem., 57, 1034–1047, doi:10.1016/j.soilbio.2012.08.027, 2013.
ni-trogen cycling: Insights from meta-analysis and theoretical mod-els, Ecol. Lett., 16, 887–894, doi:10.1111/ele.12125, 2013. Wu, J., Joergensen, R. G., Pommerening, B., Chaussod, R., and
Brookes, P. C.: Measurement of soil microbial biomass C by fumigation extraction – an automated procedure, Soil Biol. Biochem., 22, 1167–1169, doi:10.1016/0038-0717(90)90046-3, 1990.
Wu, J., Brookes, P. C., and Jenkinson, D. S.: Formation and de-struction of microbial biomass during the decomposition of glu-cose and ryegrass in soil, Soil Biol. Biochem., 25, 1435–1441, doi:10.1016/0038-0717(93)90058-j, 1993.
Zelles, L.: Phospholipid fatty acid profiles in selected members of soil microbial communities, Chemosphere, 35, 275–294, doi:10.1016/s0045-6535(97)00155-0, 1997.
Zelles, L., Palojarvi, A., Kandeler, E., VonLutzow, M., Winter, K., and Bai, Q. Y.: Changes in soil microbial properties and phospho-lipid fatty acid fractions after chloroform fumigation, Soil Biol. Biochem., 29, 1325–1336, doi:10.1016/s0038-0717(97)00062-x, 1997.
Zhang, H., Ding, W., Yu, H., and He, X.: Carbon uptake by a microbial community during 30-day treatment with C-13-glucose of a sandy loam soil fertilized for 20 years with NPK or compost as determined by a GC-C-IRMS analysis of phospholipid fatty acids, Soil Biol. Biochem., 57, 228–236, doi:10.1016/j.soilbio.2012.08.024, 2013.
Zhang, X. D. and Amelung, W.: Gas chromatographic deter-mination of muramic acid, glucosamine, mannosamine, and galactosamine in soils, Soil Biol. Biochem., 28, 1201–1206, doi:10.1016/0038-0717(96)00117-4, 1996.