Average Monthly Appraisal of Inventory
Management Policy Using the Probabilistic
Model
aAchebo, J.I; bOmoregie, M.J.
a,b
Department of Production Engineering University of Benin, Benin City, Edo State, Nigeria
[email protected] ; [email protected]
Abstract
Developing an inventory policy for an organization appears to be a tedious process for most organizations. The lack of an effective inventory management culture can propagate material wastage while simultaneously lowering cost effectiveness. In this study, an average monthly appraisal of the inventory management policy of an indigenous company is investigated. This investigation was carried out by obtaining secondary data from the company and applying the probabilistic model to analyzed the data. The inventory variables being the optimum inventory level on the one hand, as well as the ordering and reordering of the packets of electrodes used for welding oil and gas pipelines, were both determined for the months of January through to December for the period spanning 2002 to 2012. The monthly buffer stock was also obtained. It is concluded that these inventory variables were applied to develop a policy which was recommended to guide the organization studied. A step by step approach is shown in the body of the work.
Keywords: inventory policy, probabilistic model
,
average monthly demand, buffer stock, coefficient of variation1. Introduction
Inventory management is a concept that has aided organizations and entrepreneurs alike in optimizing material procurement, handling, and distribution, in such a way that material wastage is minimized. If material resources are not properly managed, the cost of operating the organization would be inordinately high and as a result would consequently increase the selling price of the resultant finished product.
The higher the selling price, the smaller the crop of people who would be willing to buy. For less complex mass produces products or components, the proper management of the inflow and outflow of raw materials is crucial, requiring the formulation of more targeted strategic policies. These strategic policies are designed primarily to monitor the inflow of raw materials, the outflow of processed raw materials (finished) products, the meeting of the customer and end users expectations, and feed back from such customers or end users. The formulation and tailoring of inventory management policies are geared towards minimizing the phenomena of materials stock out on the one hand, and also to control buffer stock on the other hand, considering the cash flow, storage space, rate of use, product shelf life and other variables.
A formidable and efficient inventory management policy is expected to eventually optimize materials and financial resource allocations. Banjoko [1] described an inventory as a stock of items used in the operation of the business. They include items used within the production system such as basic raw materials, supplies of components or spare parts, work in progress, and finished goods. The author wrote that to keep an optimal level of inventory, an effective balance between the various inventory costs must be obtained. These costs must be managed optimally, and this is the main goal of formulating such policies.
Among other researchers who have investigated policies guiding inventory control management, are Russell and Taylor III [2] who wrote that the objective of inventory management has been to keep enough inventory to meet customer demand and also be cost-effective. The authors said that inventory is a stock of items kept by an organization to meet internal and external customer demand, therefore virtually every type of organization maintains some form of inventory. An inventory system formulates a policy that controls the level of inventory by determining how much to order and when to order. Walley [3] explained the inventory control practiced in different organizations and the management strategies that informed the policies applied. Durben et al. [4] were of the opinion that inventories represent a substantial portion of the total assets of a company, and considerable efforts is required to control the inventories. Once inventory is physically present, it is essential that it be handled and stored at minimum cost while at the same time allowing production schedules to be met, this can be done appropriately by formulating the right inventory policy and appraising this policy at pre-determined times by management.
study, several factors that affect inventory control are determined on a monthly basis in order to formulate the appropriate management policies that would guide the organization in keeping an optimum inventory level, ordering cost and adequate buffer stock by applying the Probabilistic Model. Probabilistic model is a statistical analysis tool that estimates, on the basis of past (historical) data, the probability of an event occurring again. A probability model can also be seen as a mathematical representation of a random phenomenon. It is defined by its sample space, events within the sample space, and the probabilities associated with each event. The sample space for a probability model is the set of all possible outcomes, whereas, a probability is a numerical value assigned to a given event.
Probabilistic inventory control is a method based on the assumption that the average demand for inventory items is reasonably constant over time, and therefore, it is possible to describe the probability distribution of the demand, especially during replenishment lead time. Probabilistic inventory control is also known as stochastic inventory control. The models that involve uncertainty are usually referred to as stochastic models. That is, models that involve probability; and such models are generally based on expected values. This involves the minimization of long-runaverage costin order to determine the optimal inventory policy.
An inventory policywill answer the questions of interest and specify the order quantity and its’ timing in order to minimize cost. The policy differs depending on firstly, whether shortagesare allowed so customers could decide to wait till the next order arrives (called backorder model), or secondly whether all demand is satisfied immediately.
This study is expected to eventually proffer a solution that would minimize materials wastages, meet customers’ demand at appropriate times and help the organization to generate more revenue.
2.Materials and Methods 2.1 Design Instrument
The research study was done using the secondary design instrument where data are collected by obtaining recorded data of the company’s daily operation
2.2: Sampling
The sample size is seen as a true representation of the population. The sample size of 11 years ranging from 2002 to 2012.
2.3 Fieldwork
The fieldwork was done by researchers who were trained on how to obtain relevant information from organizations and they were involved individuals in this study.
2.4 Research Design Technique
The tools used to analyze the secondary data obtained from the company investigated are presented as follows; The mean sample size is expressed by Eq (1)
1 1 , n i i i x
Mean X x
N N
(1)The corresponding standard deviation is shown in Eq (2),
n 2 2 1 1 1 1 1Standard deviation, = =
1 N-1
i n n
i i i i i x x x x N N
(2)and the coefficient of variation is defined by Eq (3)
Standard deviation
Coefficient of variation,CV x100%
Mean
(3)
The coefficient of variation is used to classify the average monthly demand of a company and its classification criteria is explained by Taha [5] as follows;
Classification Criteria
According to Taha [5]
1. If the average monthly demand is approximately constant for all months and CV is reasonably small ( 20%), then the demand maybe considered deterministic and constant, with its value equal to the average of all monthly demands;
2. If the average monthly demand varies appreciably among the different months but CV remains reasonably small, then the demand is considered deterministic but variable;
4. The only remaining case is the probabilistic non stationary demand which occurs when the means and coefficients of variation vary appreciably overtime.
Further investigation was made by determining the inventory policy variables as presented by Eqs (4) - (14) [5] Ordering cycle length (time units),
o
t y time unit D
(4)
Where, y = order quantity (number of units) D = Demand rate (units per unit time) Average inventory level =y
2
(5)
Total cost per unit time (TCU), y = setup cost per unit time + Holding cost per unit time
o o
Setup cost + Holding cost per cycle,t TCU(y) =
t
(6)
Eq. (6) is further simplified as shown in Eq. (7)
y k + h
2 TCU(y) =
o o
t
t
(7)
However, Daily inventory cost associated with the proposed inventory policy = k y
TCU(y) =
y 2
D
h
(8)
Where k is setup cost associated with the placement of an order h is the holding cost (Naira per inventory unit per unit time)
The optimum value of the order quantity, EOQ (y٭) is determined by minimizing TCU(y) with respect to y.
By differentiating 2
TCU y
d 0
dy 2
kD h y
(9)
The solution produces the EOQ, y٭ as
2
y kD
h
(10)
Thus, the optimum inventory policy for the proposed model is order, 2
y kD
h
units every
o
t y
D
time unit
Lead time, L occurs between the placement and the receipt of an order. Reorder point occurs when the inventory level drops to LD units
Effective lead time, Le L nto
(11)
Where n is the largest integer not exceeding
o
L t
. Thus the reorder point occurs at LeD units and the inventory
policy can be stated as order the quantity, y٭ whenever the inventory level drops to LeD units
Fig. 1 Graphical determination of Lead time and average inventory level
The average demand during lead time, µL = DmL (12)
Where Dm = mean demand and L = lead time between placing and receiving an order
and the corresponding standard deviation of demand during lead time, σL = √(σ2L) (13)
where σ is the standard deviation
Buffer size, B is determined from applying Eq. (14)
B ≥σL kα (14)
Where α is the maximum allowable probability of running out of stock during lead time Kα=0.05 is determined from the standard normal distribution table,
Optimal inventory policy with buffer, B calls for ordering y٭ units whenever the inventory level drops to (B + µL) units [5].
3. Discussion of Results
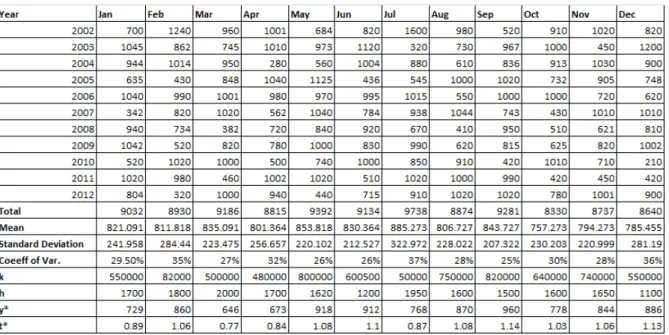
Table 1: Company’s Data and some calculated parameters
From the values obtained, in the individual coefficient of variance (CV). It is found that the coefficient of variance from January to December are above 20% and according to the classification criteria explained by Taha [5] that if the average monthly demand varies appreciably among the different months but CV is high, that is, above 20%, then the demand may be considered probabilistic non stationary demand which is said to occur when the means and coefficient of variation vary appreciably overtime. This Taha [5] explains that, this case occurs in real life situation.
Table 1, shows the demand for welding electrodes between 2002 and 2012. From Table 1, in the month of January, the optimum inventory policy requires that when the buffer stock for that month is less than 398 packets of welding electrodes, considering the volume of daily welding operations, the company’s total inventory level is expected to drop from 9032 packets, (for the 11 year period studied, giving a monthly average of 821 packets of welding electrodes), to 5501 packets (for 11 years as well, giving a monthly average of 500 packets of welding electrodes). As the inventory level drops further from 5501 to 5103 packets (now giving a monthly average of 464 packets of welding electrodes), a 14 day arrangement should be instituted to order 729 packets of welding electrodes which is most likely to fall on the 28th of every January spanning the 11 year period. This optimum inventory level of 729 packets is considered as being more economical than the initial average demand of 821 packets of welding electrode formerly slated for each January.
In the month of February, the optimum inventory policy requires that when the buffer stock for that month is less than 468 packets of welding electrode, considering the volume of daily welding operations, the company’s total inventory level is expected to drop from 8930 packets (for the 11 years period studied, giving a monthly average of 812 packets of welding electrodes), to 7133 packets ( for 11 years as well, giving a monthly average of 649 packets of welding electrodes). As the inventory level drops further from 7133 to 6665 packets ( now giving a monthly average of 606 packets of welding electrodes), a 16 day arrangement should be instituted to order 860 packets of welding electrodes which is most likely to fall on the 2nd day of every March spanning the 11 year period. This optimum inventory level of 860 packets is considered as being more economical than the initial average demand of 812 packets of welding electrode formerly slated for each February.
In the month of March, the optimum inventory policy requires that when the buffer stock for that month is less than 368 packets of welding electrode, considering the volume of daily welding operations, the company’s total inventory level is expected to drop from 9186 packets (for the 11 years period studied, giving a monthly average of 835 packets of welding electrodes), to 4244 packets ( for 11 years as well, giving a monthly average of 386 packets of welding electrodes). As the inventory level drops further from 4244 to 3876 packets ( now giving a monthly average of 352 packets of welding electrodes), a 12 day arrangement should be instituted to order 646 packets of welding electrodes which is most likely to fall on the 24th day of every March spanning the 11 year period. This optimum inventory level of 646 packets is considered as being more economical than the initial average demand of 835 packets of welding electrode formerly slated for each March.
average of 421 packets of welding electrodes). As the inventory level drops further from 4628 to 4206 packets ( now giving a monthly average of 382 packets of welding electrodes), a 13 day arrangement should be instituted to order 673 packets of welding electrodes which is most likely to fall on the 25th day of every April spanning the 11 year period. This optimum inventory level of 673 packets is considered as being more economical than the initial average demand of 801 packets of welding electrode formerly slated for each April.
In the month of May, the optimum inventory policy requires that when the buffer stock for that month is less than 362 packets of welding electrode, considering the volume of daily welding operations, the company’s total inventory level is expected to drop from 9392 packets (for the 11 years period studied, giving a monthly average of 854 packets of welding electrodes), to 6788 packets ( for 11 years as well, giving a monthly average of 617 packets of welding electrodes). As the inventory level drops further from 6788 to 6426 packets ( now giving a monthly average of 584 packets of welding electrodes), a 14 day arrangement should be instituted to order 918 packets of welding electrodes which is most likely to fall on the 3rd day of every June spanning the 11 year period. This optimum inventory level of 918 packets is considered as being more economical than the initial average demand of 854 packets of welding electrode formerly slated for each May.
In the month of June, the optimum inventory policy requires that when the buffer stock for that month is less than 350 packets of welding electrode, considering the volume of daily welding operations, the company’s total inventory level is expected to drop from 9738 packets (for the 11 years period studied, giving a monthly average of 830 packets of welding electrodes), to 7874 packets ( for 11 years as well, giving a monthly average of 716 packets of welding electrodes). As the inventory level drops further from 7874 to 7524 packets ( now giving a monthly average of 684 packets of welding electrodes), a 17 day arrangement should be instituted to order 912 packets of welding electrodes which is most likely to fall on the 3rd day of every July spanning the 11 year period. This optimum inventory level of 912 packets is considered as being more economical than the initial average demand of 830 packets of welding electrode formerly slated for each June.
In the month of July, the optimum inventory policy requires that when the buffer stock for that month is less than 531 packets of welding electrode, considering the volume of daily welding operations, the company’s total inventory level is expected to drop from 9738 packets (for the 11 years period studied, giving a monthly average of 885 packets of welding electrodes), to 5715 packets ( for 11 years as well, giving a monthly average of 520 packets of welding electrodes). As the inventory level drops further from 5715 to 5184 packets ( now giving a monthly average of 471 packets of welding electrodes), a 14 day arrangement should be instituted to order 768 packets of welding electrodes which is most likely to fall on the 27th day of every July spanning the 11 year period. This optimum inventory level of 768 packets is considered as being more economical than the initial average demand of 885 packets of welding electrode formerly slated for each July.
In the month of August, the optimum inventory policy requires that when the buffer stock for that month is less than 375 packets of welding electrode, considering the volume of daily welding operations, the company’s total inventory level is expected to drop from 8874 packets (for the 11 years period studied, giving a monthly average of 807 packets of welding electrodes), to 7770 packets ( for 11 years as well, giving a monthly average of 706 packets of welding electrodes). As the inventory level drops further from 7770 to 7395 packets ( now giving a monthly average of 672 packets of welding electrodes), a 17 day arrangement should be instituted to order 870 packets of welding electrodes which is most likely to fall on the 3rd day of every September spanning the 11 year period. This optimum inventory level of 870 packets is considered as being more economical than the initial average demand of 807 packets of welding electrode formerly slated for each August.
In the month of September, the optimum inventory policy requires that when the buffer stock for that month is less than 341 packets of welding electrode, considering the volume of daily welding operations, the company’s total inventory level is expected to drop from 9281 packets (for the 11 years period studied, giving a monthly average of 844 packets of welding electrodes), to 8501 packets ( for 11 years as well, giving a monthly average of 773 packets of welding electrodes). As the inventory level drops further from 8501 to 8160 packets ( now giving a monthly average of 742 packets of welding electrodes), a 17 day arrangement should be instituted to order 960 packets of welding electrodes which is most likely to fall on the 4th day of every October spanning the 11 year period. This optimum inventory level of 960 packets is considered as being more economical than the initial average demand of 844 packets of welding electrode formerly slated for each September.
economical than the initial average demand of 757 packets of welding electrode formerly slated for each October.
In the month of November, the optimum inventory policy requires that when the buffer stock for that month is less than 398 packets of welding electrode, considering the volume of daily welding operations, the company’s total inventory level is expected to drop from 8737 packets (for the 11 years period studied, giving a monthly average of 794 packets of welding electrodes), to 7150 packets ( for 11 years as well, giving a monthly average of 650 packets of welding electrodes). As the inventory level drops further from 7150 to 6752 packets ( now giving a monthly average of 614 packets of welding electrodes), a 16 day arrangement should be instituted to order 844 packets of welding electrodes which is most likely to fall on the 2nd day of every December spanning the 11 year period. This optimum inventory level of 844 packets is considered as being more economical than the initial average demand of 794 packets of welding electrode formerly slated for each November.
In the month of December, the optimum inventory policy requires that when the buffer stock for that month is less than 463 packets of welding electrode, considering the volume of daily welding operations, the company’s total inventory level is expected to drop from 8640 packets (for the 11 years period studied, giving a monthly average of 785 packets of welding electrodes), to 8215 packets ( for 11 years as well, giving a monthly average of 747 packets of welding electrodes). As the inventory level drops further from 8215 to 7753 packets ( now giving a monthly average of 705 packets of welding electrodes), a 18 day arrangement should be instituted to order 886 packets of welding electrodes which is most likely to fall on the 4th day of every January of a new year spanning the 11 year period. This optimum inventory level of 886 packets is considered as being more economical than the initial average demand of 785 packets of welding electrode formerly slated for each December.
4. Conclusion
In this study, an average monthly appraisal of the inventory management policies of an indigenous Company operating in Nigeria has been generated. From the secondary data obtained as shown in Table 1, it was found that probabilistic non stationary demand has occurred as the means and coefficient of variation of the monthly data which vary appreciably overtime. This indicates that the study is a practical example of what happens in a real life situation. The optimum monthly packets of welding electrodes expected to be ordered for the period spanning from 2002 to 2012 has been determined. The inventory levels, ordering units and time as well as buffer stock were also determined. These calculated inventory control variables have been able to sufficiently generate a monthly appraisal policy that would be utilized to run the company for each year of the period studied spanning from 2002 to 2012.
References
[1] Banjoko, S.A. Production and Operations Management. Ibadan, Wisdom Publisher Ltd (1994)
[2] Russell, R. S. and Taylor III, B.W. Operations Management, 2nd ed. Prentice Hall, Inc. N.J, pp. 566 (1998).
[3] Walley, B.H. Production Management Handbook. Gower Publishing Company Ltd, England, pp. 142 (1986)
[4] Durben, J.N; Piper, C.J. and Schultz, S. “Physical Handling and Control of Inventory”. Production and Inventory Control Handbook, 2nd Ed; Greene James H ed; McGraw Hill Book Company, N.Y. pp. 21.3 (1987)