Ordered Extension of Pseudopodia
Peter J. M. Van Haastert*
Department of Cell Biochemistry, University of Groningen, Haren, the Netherlands
Abstract
Cell migration in the absence of external cues is well described by a correlated random walk. Most single cells move by extending protrusions called pseudopodia. To deduce how cells walk, we have analyzed the formation of pseudopodia by
Dictyosteliumcells. We have observed that the formation of pseudopodia is highly ordered with two types of pseudopodia: First, de novo formation of pseudopodia at random positions on the cell body, and therefore in random directions. Second, pseudopod splitting near the tip of the current pseudopod in alternating right/left directions, leading to a persistent zig-zag trajectory. Here we analyzed the probability frequency distributions of the angles between pseudopodia and used this information to design a stochastic model for cell movement. Monte Carlo simulations show that the critical elements are the ratio of persistent splitting pseudopodia relative to random de novo pseudopodia, the Left/Right alternation, the angle between pseudopodia and the variance of this angle. Experiments confirm predictions of the model, showing reduced persistence in mutants that are defective in pseudopod splitting and in mutants with an irregular cell surface.
Citation:Van Haastert PJM (2010) A Model for a Correlated Random Walk Based on the Ordered Extension of Pseudopodia. PLoS Comput Biol 6(8): e1000874. doi:10.1371/journal.pcbi.1000874
Editor:Edward C. Cox, Princeton University, United States of America
ReceivedApril 14, 2010;AcceptedJune 30, 2010;PublishedAugust 12, 2010
Copyright:ß2010 Peter J. M. Van Haastert. This is an open-access article distributed under the terms of the Creative Commons Attribution License, which permits unrestricted use, distribution, and reproduction in any medium, provided the original author and source are credited.
Funding:The author received no specific funding for this work.
Competing Interests:The author has declared that no competing interests exist. * E-mail: [email protected]
Introduction
Eukaryotic cells move by extending pseudopodia, which are actin-filled protrusions of the cell surface [1]. Pseudopod formation byDictyosteliumcells, like many other moving cells, shows a typical pseudopod cycle: upon their initiation, pseudopodia grow at a constant rate during their first ,15 s and then stop. The next pseudopod is typically formed a few seconds later, but sometimes commences while the present pseudopod is still growing, giving rise to a cell with two pseudopodia. The fate of the pseudopod after its initial growth phase determines its role in cell movement: the pseudopod is either retracted, or is maintained by flow of the cytoplasm into the pseudopod thereby moving the cell body. The frequency, position and directions of the maintained pseudopodia form the basis of cell movement, because they determine the speed and trajectory of the cell. An important aspect of cell motility is the ability of cells to respond to directional cues with oriented movement. Gradients of chemicals give rise to chemotaxis [2]. Other directional cues that can induce oriented movement are temperature gradients (thermotaxis) or electric fields (electrotaxis) [3,4]. These signals somehow modulate basal pseudopod extension such that, on average, cells move in the direction of the positional cues. In this respect, studies on cell movement are critical for understanding directional movement.
Cells in the absence of external cues do not move in random directions but exhibit a so-called correlated random walk [5–9]. This tendency to move in the same direction is called persistence, and the duration of the correlation is the persistence time. Cells with strong persistence make fewer turns, move for prolonged periods of time in the same direction, and thereby effectively penetrate into the surrounding space. Other search strategies for
efficient exploration are local diffusive search and Levi walks [8,10]. Can we understand the cell trajectory by analyzing how cells extend pseudopodia?
To obtain large data sets of extending pseudopodia we developed a computer algorithm that identifies the cell contour and its protrusions. The extending pseudopod is characterized by a vector that connects the x,y,t coordinates of the pseudopod at the beginning and end of the growth phase, respectively [11]. A picture of ordered cell movement has emerged from the analysis of ,6000 pseudopodia that are extended by wild type and mutant cells in buffer [12]. Dictyostelium cells, as many other eukaryotic cells, may extend two types of pseudopodia: de novo at regions devoid of recent pseudopod activity, or by splitting of an existing pseudopod [12,13]. Pseudopod splitting occurs very frequently alternating to the right and left at a relatively small angle of,55 degrees. Therefore, pseudopod splitting may lead to a persistent zig-zag trajectory [14]. In contrast, de novo pseudopodia are extended in all directions and do not exhibit a right/left bias, suggesting that de novo pseudopodia induce a random turn of the cells. We observed strong persistence for cells that extend many splitting pseudopodia. Conversely, mutants that extend mostly de novo pseudopodia have very short persistence time and exhibit a near Brownian random walk [12].
pseudopodia, alternating right/left bias, angle between pseudopo-dia and variance of this angle due to irregularity of cell shape. We measured the parameter values of these components for several Dictyostelium mutants with defects in signaling pathways or cytoskeleton functions. Subsequently, we used these observed parameters in Monte Carlo simulations of the model and compared the predicted trajectories with the observed trajectories of the mutants. The results demonstrate two critical components in these correlated random walks: the ratio of pseudopod splitting relative to de novo pseudopodia, and the shape of the cell.
Methods
Dictyosteliumstrains and cell recordings
The strains used are wild type AX3,pi3k-null strain GMP1 with a deletion ofpi3k1andpi3k2genes [15],pla2-null with a deletion of theplaA gene [16],sgc/gca-null cells (abbreviated as gc-null cells) with a deletion ofgcaandsgcgenes [17],sgc/pla2-null cells with a deletion ofsgcandpla2Agenes [18], andddia2-null cells lacking the forH gene encoding the Dictyostelium homologue of formin [19]. Cells were grown in HG5 medium (contains per liter: 14.3 g oxoid peptone, 7.15 g bacto yeast extract, 1.36 g Na2HPO4?12H2O, 0.49 g KH2PO4, 10.0 g glucose), harvested in PB (10 mM KH2PO4/Na2HPO4, pH 6.5), and allowed to develop in 1 ml PB in a well of a 6-wells plate (Nunc). Movies were recorded at a rate of 1 frame per second for at least 15 minutes with an inverted light microscope (Olympus Type CK40 with 206objective) and images were captured with a JVC CCD camera. Cell trajectories were recorded as the movement of the centroid of the cell as described [20].
Pseudopod analysis
Images were analyzed with the fully automatic pseudopod-tracking algorithm Quimp3, which is described in detail [11]. Briefly, the program uses an active contour analysis to represent the outline of the cell using ,150 nodes [21]. Extending pseudopodia that satisfied the user-defined minimum number of adjacent convex nodes and the minimum area change were
identified. The direction of each extending pseudopod was identified by the x,y and time coordinates of the central convex node of the convex area at the start and end of growth, respectively. The tangent to the surface at the node where the pseudopod started was calculated using the position of the adjacent nodes. The automated algorithm annotates each pseudopod as de novo versus splitting using the criterion that the convex area of the new pseudopod exhibits overlap with the convex area of the current pseudopod or is within a user-defined distance. The output files containing the x,y-coordinates of the start and end position of the pseudopod, the tangent of the surface and the annotation of the pseudopod were imported in Excel to calculate pseudopod size, interval, direction to gradient, direction to tangent, etc for de novo and splitting pseudopodia (see Fig. 1), as well as fractionsof pseudopod splitting and alternating Right/Left biasa(RL+LR)/total splitting; Table 1).
The cell shape parameterYwas determined as follows: Using the outline of the cell with ,150 nodes, two ellipsoids were constructed, the largest ellipse inside the cell outline and the smallest ellipse outside the cell outline. Then an intermediate ellipse was constructed by interpolation of the inner and outer ellipse. This intermediate ellipse makes several intersections with the cell outline, thereby forming areas of the cell that are outside the intermediate ellipse (with total surface areaO), and areas of the intermediate ellipse that do not belong to the cell (with total
Figure 1. Pseudopod analysis. Movies at a rate of 1 frame per second were recorded forDictyosteliumcells moving on a solid support in buffer. The program Quimp3 represents the cell outline using a polygon of ,150 nodes, and then identifies extending convex
protrusions as pseudopodia, described by the x,y,t coordinates of the start and end of their growing phase. The program also calculates the tangent to the surface at the position where the pseudopod started. These data were used to calculate for each pseudopod the sizel, the anglearelative to a specific point in space, the anglebrelative to the tangent, and the angleQrelative to the previous pseudopod. doi:10.1371/journal.pcbi.1000874.g001
Author Summary
surface areaI; see Fig. S4). The intermediate ellipse was positioned in such a way thatO~I (this also implies that the surface area of the cell (T) is identical to the surface area of the intermediate ellipse). The cell shape parameter is defined asY~(OzI)=T; it holds that 0ƒYƒ2. For a cell with a regular shape that approaches a smooth ellipsoid, the surface areasOandIare very small andYapproaches zero. In contrast,OandIare larger for a cell with a very irregular shape; the largest value observed among ,600 cells wasY= 0.92.
With the exception of 5h starved cells, each database contains information from 200–300 pseudopodia, obtained from 6–10 cells, using two independent movies. For 5h starved cells, we collected a larger database containing 835 pseudopodia from 28 cells using 4 independent movies, and typical databases for each mutant. The data are presented as the means and standard deviation (SD) or standard error of the means (SEM), where n represents the number of pseudopodia or number of cells analyzed, as indicated in Table 1.
Statistical analysis of pseudopod angles
The probability density functions of angles can not be analyzed as the common distribution on a line. Angular distributions belong to the family of circular distributions, which are constructed by wrapping the usual distribution on the real line around a circle. The data were analyzed with two circular distributions, the von Mises distribution (vMD), which matches reasonably well with the wrapped normal distribution, and the wrapped Cauchy distribu-tion (WCD), which has fatter tails [22]. The vMD is given by
fvMD(Q,k)~
ekcos (Q)
2pI0(k)
, kw0, ð1Þ
whereI0(k) is the modified Bessel function of the first kind of order zero
I0(k)~ X
!
n~0
(k2=4)n
(n!)2 : ð2Þ
The WCD is given by
fWCD(Q,r)~
1{r2
2p(1zr2{2rcos (Q)), 0vrv1: ð3Þ
Monte Carlo simulations
Pseudopod extension is an ordered stochastic event [12]. The position of the tip of the formed pseudopodia depends on pseudopod sizelp, splitting fractions, Left/Right alternating ratio a, angle between split pseudopodiaQand variance of this anglesQ.
A Monte Carlo simulation starts with a random anglea(1)of the first pseudopod. For the next and all subsequent pseudopodia the simulation uses four uniformly distributed random numbers Ri,n (i = 1, .., 4) to calculate a(n), the angle of the nth pseudopod: R1,n[½0,1with the decision to split ifR
1,n,s;R2,n[½0,1with the decision for alternating splitting ifR2,n,a; R3,n[½0,1for direc-tion of split after de novo with decision right if R3,n ,0.5; and R4,n[½{180,180 for the direction of the de novo pseudopod. These probabilities result in a projected angle of extension in degrees. Finally, the actual pseudopod direction is drawn from a wrapped von Mises distribution with this projected angle as mean and sQ2 as variance (k= 1/sQ2; variance converted to radians).
The obtaineda(n)and the pseudopod sizelpare used to calculate the x,y coordinates of the tip of the pseudopod, followed by a next round of four random numbers to calculate a(n+1). In the simulations reported here we did not include stochastic variation in pseudopod length and pseudopod frequency, since we observed that they had only minor effects on the trajectories over several cell lengths.
Please note that in the simulations the direction of the simulated de novo pseudopodia is random; consequently, a small fraction of de novo pseudopodia are in the same direction of the previous pseudopod, which would be recognized in experiments as splitting pseudopodia. Conversely, a small fraction of the simulated splitting pseudopodia have angles Table 1.Observed and deduced parameters of wild type and mutant cells.
Property Symbol Units WT 1h WT 3h WT 5h WT 7h gc-null pla2-null sgc/pla2-nullddia2-null
Observed pseudopod(n cells/pseudopodia) 7/215 8/256 28/835 7/294 7/312 8/208 8/219 8/164
Pseudopod size lp mm 5.060.2 5.360.2 5.260.2 4.760.2 4.660.4 7.760.5 5.360.7 5.660.4
Splitting angle Q degrees 62 58 55 55 54 50 54 54
SD splitting angle sQ degrees 26.1 29.7 27.8 27.5 26.9 28.5 27.5 46.5
Alternating a - 0.7460.02 0.7460.06 0.7760.04 0.8260.06 0.6760.05 0.6860.05 0.7560.08 0.7560.03
Fraction splitting s - 0.5560.07 0.6060.05 0.8660.06 0.8960.05 0.7160.06 0.6760.10 0.4160.07 0.8260.09
Observed dispersion(20 cells)
Correlation factor cobs - 0.4660.11 0.5260.07 0.7460.09 0.8160.10 0.5860.11 0.5560.11 0.3560.08 0.5360.07
Turn angle h degrees 63 59 42 36 55 57 70 58
Calculated dispersion
Monte Carlo correlation factor cMC - 0.40 0.46 0.65 0.70 0.53 0.51 0.35 0.46
Equation (9) correlation factor cstep - 0.40 0.42 0.64 0.69 0.50 0.48 0.31 0.43
The observed pseudopod data were derived from wild type (WT) cells starved for the indicated times, or from mutants starved for 5h. Indicated are the number of cells and pseudopodia analyzed. The data forlpare the means and SEM for pseudopodia; the data forQandsQare the means and SD for pseudopodia; the data foraands
are the means and SEM for cells. The data for the observedcobswere obtained by least square curve fitting to Eq. 4 of the dispersion of 20 cells during 15 minutes; the error indicates the 95% confidence level of the fit;h= cos21c. The data for the MC simulatedc
MCwere obtained by simulating 100,000 trajectories using the observed pseudopod parameters, and the corresponding value ofcwas computed as described for the experimentally observedc. Finally,cstepwas calculated with Eq. 9, only using pseudopod parameters.
much larger than 55 degrees and would be recognized in experiments as de novo pseudopodia. From the geometry of the cell, we estimate that the number of simulated de novo in the current pseudopod and the number of splitting pseudopodia outside the current pseudopod are approximately the same, suggesting that the simulations represent the observed ratio of splitting and de novo pseudopodia.
Results
Pseudopod extensions
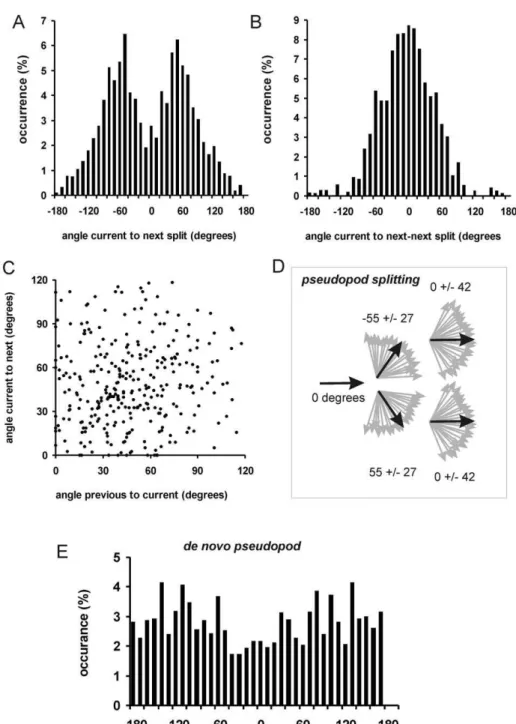
The angles between pseudopodia were analyzed in detail and the results are presented in Fig. 2. For splitting pseudopodia, the angle between the current and next pseudopod (Q1,2) has a clear bimodal distribution (Fig. 2A). A probability density function (PDF) of angles belongs to the family of circular or wrapped distributions. The data reported in this study were all fitted well by a von Mises distribution (vMD), which is the circular analog of the normal distribution. The wrapped Cauchy distribution has fatter tails and provided a poorer fit of the data (data not shown). The bimodal vMD presented in Fig. 2A is symmetric, yielding two means (Q1,2=+/255) that have the same variancek= 1/sQ2;
sQ1,2= 28 degrees). Figure 2B shows the PDF of the angle between the current and next-next pseudopod (Q1,3), which is best described by a single vMD with a mean ofQ1,3= 2 degrees and sQ1,3= 42 degrees. Figure 2C reveals that there is no significant correlation between the magnitude of angles between first/second pseudopod and the magnitude of the angles between second/ third pseudopod (thus e.g. splitting at a larger angle is not followed by a split at a smaller angle). The extension of splitting pseudopodia is summarized in Fig. 2D, and is based on the previous observation that a pseudopod split to the right is frequently followed by a split to the left and visa versa [12]. Thus the next pseudopod is extended at an angle of,55 degrees to the right or left relative to the current pseudopod, and the next-next pseudopod is extended in roughly the same direction as the current pseudopod.
The angle between a de novo pseudopod and the previous pseudopod shows a very broad distribution (Fig. 2E). Nearly all angles between 2180 and +180 are well represented with a somewhat lower abundance of angles around 0 degrees. This suggests that a de novo pseudopod can be extended in any direction, but with slightly lower probability of the direction of the current pseudopod.
Trajectories of wild type and mutant cells
To investigate the consequence of the observed ordered extension of pseudopodia for cell movement on a coarse time scale for many pseudopodia we recorded the movement of Dictyostelium cells during 15 minutes; in this period about 30 pseudopodia are extended. Previously we have presented the cell trajectories for several strains and developmental stages [12] (see also Fig. S1). The mean square displacement as a function time, SD2(t)T, exhibits a slow approach to a linear function (Fig. 3A),
which is typical for a transition of a correlated random walk at short times to a Brownian random walk after longer times [6,23]. Previously, the often used equation for a correlated random walk were fit to the data points to estimate persistence time and speed of the cells [12]. The aim of the present study is to analyze the mechanism of cell movement from the perspective of the extending pseudopodia, which have a specific length and direction. A correlated random walk in two dimensions can also be described with steps and turns [24,25]. With the replacement of the number of steps (n) in Eq. 7 in reference [25] for n = Ft we
obtain
SD2(t)T~l2 Ft1zc
1{c{
2c1{c
Ft
(1{c)2
, ð4Þ
wherelis the step size inmm, F is the step frequency, andcis the correlation factor of dispersion (0,c,1), defined as the arithmetic mean of the cosine of the turn anglehbetween steps
c~Scos (h)T: ð5Þ
With three variables (F, l, c) the estimates of the parameters become uncertain. Fortunately, the step size can be deduced accurately from experimental data. As will be shown below in Eq. 10, the step size is given byl=lpcos(Q/2), where measurements forlpandQare presented in Table 1. Using this value forl, the dispersion data were fitted to obtain the observed correlation factor of dispersion (cobs) with the corresponding turn angle (h). In cells starved for 1 or 3 hours the correlation factor is only,0.5 with turn angle of,60 degrees. At 5 and 7 hours of starvation, cells move with much stronger persistence (correlation factor of 0.74 and 0.81 and a small turn angle of 42 and 36 degrees). Deletion of PLA2 or guanylyl cyclases prevents this increase of correlation factor, persistence is very low and cells disperse poorly.
How is pseudopod extension related to the observed correlation factor of dispersion cobs? As previously stated (see Fig. 2),Dictyosteliumcells may extend eitherde novopseudopodia in nearly random directions, or splitting pseudopodia in a direction similar to the previous direction. Therefore, cells that extend exclusively de novo pseudopodia are expected to exhibit a random walk withcobs= 0 (turn angleh= 90 degrees), whereas cells extending exclusively splitting pseudopodia will exhibit strong persistence with large c and small turn angle h. As a consequence, cobs is expected to depend on the ratio s of splitting/de novo pseudopodia. Fig. 3B demonstrates that within experimental error this relationship is approximately linear; this holds true for the mutants as well as for wild type cells at different stages of development. The linear regression of all data yieldscobs= 0.921s20.044. Thus, when all pseudopodia are de novo (s= 0) the correlation factor is small (cobs=20.044) giving a turn anglehdn= 93 degrees, close to the expected value of 90 degrees for random turns. In contrast, when all pseudopodia are the result of splitting (s= 1) the correlation factor is large (cobs= 0.88) yielding a small turn angle (hs= 29 degrees). The implication of small turn angles for splitting pseudopodia will be discussed later.
Model for persistent movement
The alternating right/left extension of splitting pseudopodia can be used to simplify a description of the movement ofDictyostelium cells over longer distances. In this approach, the simplification may be valid for movement on a longer time scale only, as we study here, but may not be appropriate over shorter time scales of a few pseudopodia. Because pseudopodia are frequently extended alternating right/left, we consider movement by pairs of two pseudopodia.
cpair~s2½a2ScoshRLTza(1{a)ScoshLRTza(1{a)ScoshRRTz
(1{a)2ScoshLLTzs(1{s)½ScoshdsTzScoshsdTz
(1{s)2ScoshddT:
ð6Þ
De novo pseudopodia are extended in a random direction, i.e. ScoshdsT,ScoshsdTandScoshddTequal zero. The turn angles of
the four splitting pairs are 0,Qand 2Q, as indicated in Fig. 4A, and the variance is approximately 2sQ2(see Fig. 2B). Consequently Eq.
6 reduces to:
cpair~s2½a2Scos (0,k)Tz2a(1{a)Scos (Q,k)T
z(1{a)2Scos (2Q,k)T, ð 7Þ
Figure 2. Pseudopod angles. A. Pseudopod extension was analyzed for the angleQ1,2between current and next splitting pseudopod, yielding a
bimodal von Mises distribution with meanQ=+/255 degrees and SD = 28 degrees with 736 pseudopodia.B. The angleQ1,3between current and
next-next pseudopod exhibit a single distribution with meanQ= 2 degrees and SD = 42 degrees with 736 pseudopodia. PanelCshows that the angle between current and next pseudopod does not depend on the angle between current and previous pseudopod.D. Schematic of the alternating extension of Right/Left pseudopod splitting.E. The angle between current pseudopod and the next de novo pseudopod, demonstrating a nearly uniform distribution with 206 pseudopodia. Data in this figure were obtained from 3, 5 and 7h staved cells (see also Table 1).
whereScos (Q,k)Tdenotes the expected value of the cosines of the angles on a circle with weights given by the vMD with meanQand variance given by k= 1/(2sQ2). Since all splitting pseudopodia
show the same variance this can be further reduced to
cpair~s2Scos (0,k)T½a2cos (0)z2a(1{a) cos (Q)
z(1{a)2cos (2Q): ð 8Þ
In this equation Scos (0,k)T is obtained by calculating the probabilities of all turn angles on a circle with the vMD using Eqs. 1 and 2 and then taking the weighted average of the cosines of these angles. Although this procedure is straightforward, Eq. 8 can be further simplified, because forsQsmaller than,50 degrees a good approximation isScos (0,k)T&½cos (2sQ=pffiffiffip)2(see Fig. S2). Finally, on a longer time scale and averaged over many steps, the correlation factor of pairs is related to the correlation factor of its underlying two steps bycpair~c2
step. With these replacements we obtain the analytical expression for the correlation factor
cstep&scos (2sQ=pffiffiffip)
ffiffiffiffiffiffiffiffiffiffiffiffiffiffiffiffiffiffiffiffiffiffiffiffiffiffiffiffiffiffiffiffiffiffiffiffiffiffiffiffiffiffiffiffiffiffiffiffiffiffiffiffiffiffiffiffiffiffiffiffiffiffiffiffiffiffiffiffiffiffiffiffiffiffiffiffi
a2z2a(1{a) cos (Q)z(1{a)2cos (2Q) q
:ð9Þ
Thus, the correlation factorc is the product of three terms: the splitting ratios, a noise term with the variancesQ, and a term with
right/left biasaand angleQ.
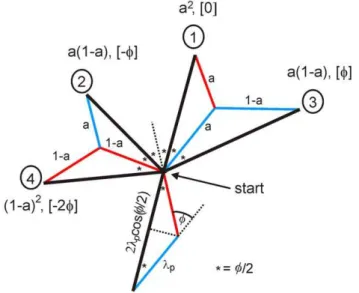
Finally, by considering movement in pairs of steps, Fig. 4 reveals that the step size of the displacement is given by
l~lpcos (Q=2): ð10Þ
Monte Carlo simulations of cell movement
We used Monte Carlo simulations to investigate howlandc depend on the pseudopod parameters sizelp, splitting fractions, alternating ratio a, angle between split pseudopodia Q and Figure 3. Dispersion.The trajectories of wild type and mutant cells
(see Fig. S1) were recorded as described in the method section.A. The mean square displacement was determined for,20 cells (symbols). The
data were fitted according Eq. 4 (lines) yielding the correlation factor of dispersioncobsas indicated in Table 1. B. The correlation factor of
dispersion is plotted as a function of the fraction s of splitting pseudopodia, which was determined from the same movies. Symbols are closed circle for wild type (5 h starved in panel A; 1, 3, 5 and 7h starved in panel B); closed triangle forsgc/gca-null cells, diamond for
pla2-null cells; square forsgc/pla2-null cells. doi:10.1371/journal.pcbi.1000874.g003
Figure 4. Bipedal amoeboid movement.The diagram shows the probabilities, angles and sizes of pairs of pseudopod extensions.
Dictyostelium cells frequently extend alternating right/left splitting pseudopodia. Pseudopodia to the left are in red, to the right in blue, and the movement after two pseudopodia is in black. Indicated are the four possible movements with two splitting pseudopodia after the cell has made a right and left pseudopod. The probability for alternating right/left or left/right is (a), while the probability for consecutive right/ right or left/left is (1-a), yielding the probabilities of the four pseudopod pairs. The angle between pseudopodia isQ.
variance of this angle sQ2. These simulations are also useful to
inspect whether step sizeland correlation factorcare correctly described by Eqs. 8–10. The direction in which a pseudopod is extended appears to be an ordered stochastic event [12] that depends on multiple decisions according to the following scheme: The next pseudopod is a splitting or de novo according to the ratio s. A splitting pseudopod is extended with angleQto the right or left relative to the previous splitting according to the alternating right/ left bias a. A de novo pseudopod is extended in a random direction. The splitting pseudopod that appears after a de novo pseudopod has an equal probability to be extended to the left or right. Finally, the direction of the emerging pseudopod has a variancesQ2. The Monte Carlo simulation starts with a random
anglea(1)of the first pseudopod and then uses the probabilities for splitting fraction s, alternating ratio a, angle between split pseudopodia Q and variance of this angle sQ2 to stochastically
simulate the angle of the next pseudopod (see methods and Table 1 for pseudopod parameters of wild type and mutant cells). The simulated trajectories are qualitatively similar to the experimen-tally observed trajectories (see Fig. S1B): Fed wild type cells or mutants with abundant de novo pseudopodia make many turns and have small displacement, whilst the trajectories of starved wild type cells with abundant pseudopod splitting are more persistent with large displacements.
To investigate how the correlation factor c depends on pseudopod parameters, the displacementSD2(n)Twas calculated
from 100,000 trajectories obtained by MC simulation using a unit pseudopod size and different values ofs,a,QandsQ. The obtained
displacementSD2(n)Twas then fitted to Eq. 4 to obtain estimates
for the step sizeland Monte Carlo correlation factor,cMC. The symbols in Fig. 5 show the results of the MC simulation, whereas the curves are the result of Eqs. 8–10.
We first investigated the angleQbetween splitting pseudopodia and the alternating right/left biasa. When all splitting pseudopo-dia are alternating (a= 1), the cells make a nearly perfect zig-zag trajectory, and therefore the angleQ has very little effect on the persistence factor c (Fig. 5A). When splitting pseudopodia are extended in a random fashion to the right or left (a= 0.5), the persistence factorcMCdecreases sharply asQbecomes larger than ,30 degrees. At an intermediate right/left bias (a= 0.75) the persistence factorcMCremains relatively high as long as the angle between pseudopodia is below 60 degrees. The results of the MC simulation appear to be described very well by the simplified model (Eqs. 8–10). Furthermore, at the observed angle ofQ= 55 degrees and alternating factor ofa= 0.77, the deduced persistence factorcMCis 0.88 (see asterisk in Fig. 5A).
The fraction of splitting pseudopodia has a major impact on the persistence factorc. In the MC simulations, the value ofcdeclines approximately linearly with the value of s(Fig. 5B), as was also observed experimentally (Fig. 3B), and obtained in Eqs. 8 and 9. Finally, we investigated the contribution of the variancesQ2of the
splitting angle to the persistence factor c. This reveals that the persistence decreases strongly with increasing variance (Fig. 5C), with cMC following an approximately linear relationship with cos(sQ). The MC simulations are well described by Eq. 8, but
deviate from Eq. 9 atsQ.30 degrees, as expected (see Fig. S2).
We also used these Monte Carlo simulations to obtain an estimate of the step sizel. It appears thatldoes not to depend on s and a, but depends on Q according to l~lpcos (Q=2) (Inset Fig 5A), as was obtained in Eq. 10.
In summary, the obtained correlation factor from the MC simulation (cMC) are nearly identical to the correlation factor calculated with Eq. 9 (cstep). This suggests that the movement of Dictyosteliumcells is qualitatively and quantitatively described very
well by the model of persistent steps and random turns with the observed pseudopod parameterslp,s,a,QandsQ.
Movement of the centroid of the cell
How does the movement of pseudopodia relate to the movement of the centroid of the cell? The data presented in Table 1 reveal that the observed correlation factor cobs of the Figure 5. Predicted correlation factor of persistence and step size.The trajectories of 100,000 cells were obtained by Monte Carlo simulation; the displacement was analyzed with Eq. 4 to obtain the correlationcMCand step sizel(in units of pseudopod size and thus
dimensionless). Simulations were performed with the parameter values as indicated on the x-axis, while the other parameters had the following standard valueslp= 1;s= 1;a= 1;Q= 55 degrees;sQ= 28 degrees. The
data points denote the outcome of the Monte Carlo simulations, the lines are generated using Eq. 9, while the dotted line in panel C is generated using Eq. 8. The asterisks represent the predicted value for 5h starvedDictyosteliumcells. A. The effect of angleQand right/left bias
centroid for different cell types correspond well with the deduced correlation factors of the pseudopods (cMCandcstep), but is always larger by,15% (Table 1). Apparently, the observed turn angle of the cell’s centroid is smaller than the turn angle of the extending pseudopod. Inspection of movies of 5h starved AX3 cells confirm this notion: the average angle between splitting pseudopodia is 55628 degrees (Fig. 2A), while the centroid moves during period at an angle of only 31623 degrees (mean and SD). Equation 9 reveals that the correlation factor cstep increases by 15% when Q= 55628 degrees for the pseudopod is replaced byQ= 31623 degrees for the cells centroid.
Probably two phenomena are responsible for the difference between pseudopod and centroid: extension of multiple pseudo-podia and geometry of cells. When cells extend multiple pseudopodia it is likely that at any given instant of time, the front of the cell moves with a fixed fraction of the vector sum of velocities possessed by the pseudopodia active at that instant in time. The temporal overlap of two pseudopodia was deduced from the measured probability distributions of pseudopod extensions (Fig 2F in [26]), which reveal that ,25% of the pseudopodia overlap with another pseudopod during on average,40% of their extension time. This suggest that the tip of the cell moves at an angle that is ,6 degrees smaller than 55 degrees. Secondly, geometry predicts that the rear of the cell makes smaller changes of direction than the tip of the cell, comparable to the differences in curvature made by the front and rear wheels of a car. Figure S3 indicates that for a stereotypic pseudopod at 55 degrees the directional change of the centroid is,40 degrees (see Fig. S3). Together, multiple pseudopodia and cell geometry can explain observed difference between pseudopod and centroid changes of direction, leading to the small 15% difference between deduced pseudopod correlation factor (cMCandcstep) and observed centroid correlation factor (cobs).
Directional displacement
ThedirectionaldisplacementSDD~(0,n)Tis the displacement after n steps in the direction of the first step. An expression for the directional displacement is especially relevant when the organism is exposed to positional cues leading to a drift in one direction, such as during chemotaxis. The directional displacement of a cell after extending one pseudopod at an anglehislcosh, and for a population of cells SDD~(0,1)T~lScoshT. By Eqs. 3 and 10, the displacement at the first step may be written as vDD~(0,1)w~ clpcos (Q=2), and at the ithstepS~DD(i{1,i)T~cilpcos (Q=2), see Eq. 6 of reference [25]. The cumulative displacement after n steps is
S~DD(0,n)T~Xn
i~0c
il
pcos (Q=2), ð11aÞ
which atn?!is given by
S~DD(0,!)T~lpcos (Q=2)
1{c , 0vcv1: ð11bÞ
In essence, this equation describes the displacement of a cell population in which all cells extend the first pseudopod in the same direction. Subsequent pseudopodia are extended with a bias, which reduces geometrically with each step; the correlation factor cindicates how many pseudopodia have correlated direction and therefore how far the population will disperse in the direction of the first pseudopod. Figure 6 presents the directional displacement as observed experimentally in wild type cells. The displacement in the direction of the first pseudopod slowly decreases at each
subsequent pseudopod, approaching random movement after,10 pseudopodia. On average a cell moves,15mm in the direction of the first pseudopod, which is the equivalent of about 3 pseudopodia (given a pseudopod size of,5mm). This figure also
presents the directional displacement as modeled by Eq. 11a with observed data forlp, Qand c, which is in very close agreement with experimental data, again suggesting that the movement of a cell is satisfactory described by the model with five pseudopod parameters.
Cell shape, the variance in the direction of pseudopod extension, and dispersal
The variation in pseudopod direction sQ2plays an important
role in Eqs. 8–11 describing cell dispersal. Previously [12] we have shown that the next pseudopod emerges at a specific distanced from the tip of the current pseudopod, and is then extended perpendicular to the cell surface (i.e. perpendicular to the tangent to the surface curvature at the position where the pseudopod emerges). The pseudopod direction is expected to have high confidence for cells with a smooth ellipsoid shape, because the local bending is very predictable. However, this confidence is much smaller for cells with a very irregular shape. We investigated the role of cell shape using three experiments. First we demonstrate that the variancesQ2indeed depends on the variance
of the tangent and the normal to the tangent. Second, we show that wild type or mutant cells with irregular shape exhibit increased variancesQ2. Finally we show that, due to the increased
variance, the mutant exhibits poor dispersal.
Quimp3 was used to construct the tangent to the surface curvature at the position where the pseudopod emerges. We first determined for wild-type cells the angleatof this tangent relative to the previous pseudopod (at= 34.5624.9 degrees), and the angle b of the new pseudopod relative to this tangent (b= 89.1613.3 degrees). As mentioned above, the observed angle of the new pseudopod relative to the previous pseudopod isQ= 55.2627.8 degrees. We expect that the angle of the tangent relative to the previous pseudopod is independent from the angle of the pseudopod relative to the tangent; therefore we expect
^
s s2
Q~s2tzs2b~24:92z13:32~28:22. Indeed, the observed stan-dard deviation of 27.8 degrees is close to this expected value of Figure 6. Directional displacement. Pseudopod formation and trajectories were recorded for 5h starvedDictyosteliumcells; 8 cells were followed during 15 min. The directional displacement is the distance moved after n pseudopodia in the direction of the first pseudopod. Data points are the means of,120 measurements, the line is the
28.2 degrees. Importantly, the largest contribution to sQ2 is
derived from the variance of the tangentst2, which is related to the local shape of the cell.
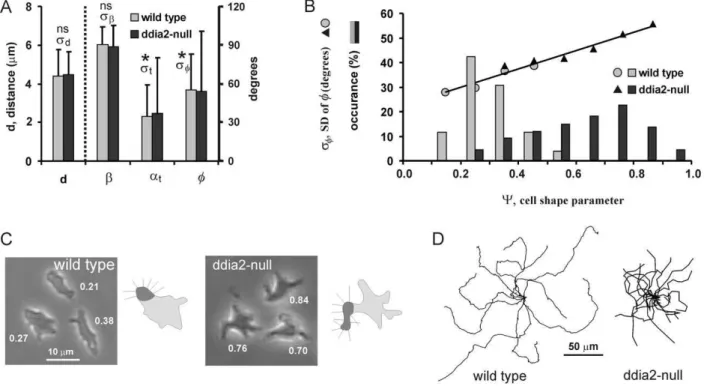
In the collection of Dictyosteliummutants, we selected a strain with an irregular shape. Mutantddia2-null with a deletion of the forH gene encoding the formin dDia2 has a star-like shape (Fig. 7C). In this mutant, new pseudopodia are extended at about the same frequency and distance from the present pseudopodia as in wild type cells, pseudopodia also grow perpendicular to the surface, and are extended roughly in the same direction ofQ= 55 degrees as wild type cells (Fig. 7A). However pseudopodia exhibit much more variation in direction (sQ= 47 degrees compared to
sQ= 28 degrees for wild type cells). Finally, we determined a shape
parameter Y that indicates how much the cell outline deviates from an ellipse (see method section and Fig. S4). Figure 7B reveals that cells with increased irregular shape, either being wild-type or mutant, exhibit strongly increased variancesQ2. Importantly, the
distancedand angleQof the pseudopodia does not change with cell shape (Fig. 7A).
Using the observed values fors,a,Q, andsQforddia2-null cells
we expect from Eq. 9 to obtain cstep= 0.43, significantly lower compared tocstep= 0.69. for wild type cells. Fig. 7D shows that the dispersion of ddia2-null cells is strongly reduced. The observed mean square dispersion was fitted to Eq. 4 yielding a correlation factor ofcobs= 0.53 (Table 1), close to the value that was predicted from the extension of pseudopodia from an irregular surface.
In summary, these and previous results [12] suggest that a splitting pseudopod is induced at some distancedfrom the tip of the current pseudopod, and then grows perpendicular to the surface. In a cell with a regular shape, the tangent and therefore pseudopod direction can be approximated using the distanced; alternating R/L extensions lead to a relative straight zig-zag trajectory, providing strong persistence of movement. In a cell with a very irregular shape, the local curvature of the membrane at distance d is unpredictable. Consequently, alternating R/L splitting occur with large variation of directions, leading to frequent turns and poor persistence.
Discussion
The movement of many organisms in the absence of external cues is not purely random, but shows properties of a correlated random walk. The direction of future movement is correlated with the direction of prior movement. For organisms moving in two dimensions, such as most land-living organisms, this implies that movement to the right is balanced on a short term by movement to the left to assure a long-term persistence of the direction. In bipedal locomotion, the alternating steps with the left and right foot will yield a persistent trajectory. Amoeboid cells in the absence of external cues show ordered extension of pseudopodia: a new pseudopod emerges preferentially just after the previous pseudo-pod has stopped growth [12]. Importantly, the position at the cell
Figure 7. Movement of a mutant with irregular shape.Pseudopod formation and trajectories were recorded for 5h starved wild type and mutantddia2-null cells. For the next pseudopod we measured the angleQand distancedrelative to the current pseudopod, the angleatof the
tangent relative to the current pseudopod and the anglebof the pseudopod relative to the tangent.A. The data show the means and SD measured for 312 and 289 pseudopodia from wild type andddia2-null cells, respectively. The means are not significantly different between wild type andddia2 -null cells, but the SDsQandstare significantly larger forddia2-null compared to wild type (Chi-square, P,0.0001); the SDsdandsbare not
significantly different.B. The shape parameterYwas determined at the moment of pseudopod extension. Bars show the frequency distributions for 312 wild type and 289ddia2-null cells. Data points showsQ, the SD ofQ. Linear regression analysis of all data point yieldssQ. = 37.6Y+22.8; R2= 0.965. C. Pictures showing three representative cells; numbers indicate the measured values ofY. Mutantddia2-null has an irregular star-like shape, while wild-type cells are smoother and more spherical. Each diagram shows a cell with a pseudopod (dark grey area); the small lines indicate the direction of pseudopodia that emerge by pseudopod splitting perpendicular to the surface. Due to the irregular shape, pseudopodia extending byddia2-null cells exhibit more angular variation.D. Displacement of wild type andddia2-null cells during 15 minutes.
surface where this new pseudopod emerges is highly biased. When the current pseudopod has been extended to the left (relative to the previous pseudopod), the next pseudopod emerges preferentially nearby the tip at the right side of the current pseudopod. Since pseudopodia are extended perpendicular to the cell surface, this next pseudopod is extended at a small angle relative to the current pseudopod [12]. Therefore, this (imperfect) alternating right/left pseudopod splitting resembles bipedal locomotion. Cells may also extend a de novo pseudopod somewhere at the cell body, which is extended in a random direction. In starvedDictyosteliumcells, the probability of extending a de novo pseudopod is,10-fold lower than of pseudopod splitting (probability calculated per mm circumference of the cell [12]).
The model for pseudopod-based cell dispersion depends on five parameters, the pseudopod size (l), the fraction of split pseudopodia (s), the alternating left/right bias (a), the angle between pseudopodia (Q) and the variance of this angle (sQ2). With
these parameters the experimental data on mean square displacement and directional displacement are well-explained using Eqs. 9 and 11, respectively. Pseudopodia are the fundamental instruments for amoeboid movement. The notion that the trajectories are described well by the five pseudopod parameters probably implies that we have identified the basic concept of the amoeboid correlated random walk: persistent alternating pseudopod splitting and formation of de novo pseudopodia in random directions.
The cells may modify one or more of these five pseudopod parameters in order to modulate the trajectories (see Table 1). Nearly all mutants, as well as wild type cells at different stages of starvation and development, have approximately the same average pseudopod sizelp. In addition, the alternating right/left bias (a) fluctuates between 0.67 and 0.82, and the angle between splitting pseudopodia (Q) between 50 and 62 degrees. [pla2-null cells are the only exception [12]; emerging pseudopodia in pla2-null cells exhibit longer growth periods (,27 s) than wild type cells (,13 s), and are thus longer]. This suggests that all strains use the same mechanism for pseudopod splitting. In contrast to these constant propertiesof split pseudopodia, the fraction of split pseudopodia (s) changes dramatically upon starvation, and appears to be regulated by cGMP and PLA2 signaling. Well-fed cells extend pseudopodia that are predominantly de novo in random directions, leading to a nearly Brownian random walk [20]. Upon starvation, the appearance of cGMP and PLA2 signaling enhances splitting and suppresses de novo pseudopod extensions, which leads to more persistent movement. The important role of the fraction of splitting pseudopodia for cell movement is also depicted by the linear dependence of the correlation factorcon the fractionsof splitting pseudopodia (Fig. 3B and Eq. 9).
The variance of the angle of pseudopod extension (sQ2) plays an
important role in movement. In wild type cells, as well as in many mutant strains,sQis about 28 degrees. The primary source of the
variance of pseudopod angles lies in the variation of cell shape, by which the normal to the cell surface at a specific position on this surface will have significant variation. Since the direction of pseudopodia is given by this normal, it is predicted that a cell with irregular shape should have more variation in pseudopod direction, and consequently shows poor dispersion. The experi-ments with mutantddia2-null cells strongly support this interpre-tation. Wild-type cells have a relatively regular spherical shape by which two nearby pseudopodia are extended in nearly the same direction (smallsQ). In contrast, mutantddia2-null cells have an
irregular star-like shape; therefore, two nearby pseudopodia are often extended in very different directions (largesQ). The variance
sQ2can be regarded as the noise of the system. It indicates how fast
a cell that extends only alternating splitting pseudopodia (a= 1 and s= 1) will lose correlation of directionality. WithsQ= 28 degrees
for wild type cells it follows from Eq. 10 that after ten pseudopodia the correlation of direction is still,0.5. In contrast, forddia2-null cells we obtained sQ= 46.5 degrees, which implies that already
after four pseudopodia the correlation of direction has declined to ,0.5. Supported by Monte Carlo simulations using the param-eters of the mutant, we conclude that poor dispersion ofddia2-null cells is due to the increased variance of pseudopod angles, which is caused by its irregular shape.
The correlation factorcis the product of three terms (see Fig. 5 and Eq. 9), namely: splitting fraction (s), alternating pseudopod angles (aandQ), and the SD of the pseudopod angle (sQ). Strong
persistence of cell movement is attained when all three terms are large and about equal in magnitude. Starved wild type cells follow this strategy: each term is ,0.9, resulting in the observed correlation factor of 0.74. Mutants in which one of these terms is compromised, such as reduced splitting insgc/pla2-null cells or enhanced noise ofddia2-null cells, have poor dispersion.
In summary, the correlated random walk of amoeboid cells is well described by the balanced bipedal movement, mediated by the alternating right/left extension of splitting pseudopodia. Cells deviate from movement in a straight line due to noise and because cells occasionally hop or make random turns. The turns in particular are used by the cells to modulate the persistence time, thereby shifting between nearly Brownian motion during growth and strong persistent movement during starvation.
Supporting Information
Figure S1 Trajectories. Movies were recorded during 15 min-utes and the trajectories of the centroid of ten cells were determined. A. Wild type Dictyostelium cells at different times after removing of food. The frequency and size of pseudopod extension is not very different, but starved cells extend predom-inantly splitting pseudopodia (see (16)).B. Trajectories of 5 hour starved mutant cells with deletions of genes encoding guanylyl cyclases (sGC and GCA) and PLA2.C. Monte Carlo simulations of the trajectories calculated with the pseudopod parameters that were obtained experimentally for the mutants as indicated in Table 1.
Found at: doi:10.1371.journal.pcbi.1000874.s001 (0.07 MB PDF)
Figure S2 Analysis of the noise equation Scos (0,k)T& ½cos ( sffiffiffiffiffiffiffiffiQ
p=2
p )
2
. Pseudopodia are extended with a variancesQ2.
In this equation, the notation Scos (0,k)T is the average of the cosines of the angles on a circle with weights given by the von Mises Probability Distribution (vMD) with mean of 0 degrees and variance given byk= 1/sQ2. The figure reveals that Scos (0,k)T
deviates less than 2% from the simple expression½cos ( sQ ffiffiffiffiffiffiffiffi
p=2
p )
2
for values ofsQ,40 degrees.
Found at: doi:10.1371.journal.pcbi.1000874.s002 (0.03 MB PDF)
Schematic after a few Right/Left pseudopod extensions. The centroid makes smaller turns than the pseudopod,,40 degrees. Found at: doi:10.1371.journal.pcbi.1000874.s003 (0.07 MB PDF)
Figure S4 Determination of the shape parameter Y. The cell outline is used to draw two ellipses, the largest possible ellipse inside the cell and the smallest possible ellipse outside the cell. Then an intermediate ellipse is constructed by interpolation of the inner and outer ellipse; the figure shows the intermediate ellipse. This ellipse intersects the outline, thereby forming the blue areasO of the cell that are outside the intermediate ellipse, and yellow areasIof the intermediate ellipsoid that do not belong to the cell. The intermediate ellipse was interpolated in such a way thatO=I.
The parameter of cell shape is defined asY= (O+I)/T, whereTis the surface area of the cell (grey+ blue). The minimal value is Y= 0 when the cell is an ellipse, and the maximal value isY= 2 for a cell with extreme long extensions; the maximal value observed among,600Dictyosteliumcells isY= 0.92. The neuron cell is shown for comparison.
Found at: doi:10.1371.journal.pcbi.1000874.s004 (0.13 MB PDF)
Author Contributions
Conceived and designed the experiments: PJMVH. Performed the experiments: PJMVH. Analyzed the data: PJMVH. Contributed re-agents/materials/analysis tools: PJMVH. Wrote the paper: PJMVH.
References
1. Pollard TD (2003) The cytoskeleton, cellular motility and the reductionist agenda. Nature 422: 741–745.
2. Swaney KF, Huang CH, Devreotes PN (2010) Eukaryotic Chemotaxis: A Network of Signaling Pathways Controls Motility, Directional Sensing, and Polarity. Annu Rev Biophys. 2 p.
3. Bahat A, Eisenbach M (2006) Sperm thermotaxis. Mol Cell Endocrinol 252: 115–119.
4. Zhao M (2009) Electrical fields in wound healing-An overriding signal that directs cell migration. Semin Cell Dev Biol 20: 674–682.
5. Patlak CS (1953) Random walk with persistence and external bias. Bull Math Biophys 15: 311–338.
6. Potel MJ, Mackay SA (1979) Preaggregative cell motion in Dictyostelium. J Cell Sci 36: 281–309.
7. Gail MH, Boone CW (1970) The locomotion of mouse fibroblasts in tissue culture. Biophys J 10: 980–993.
8. Codling EA, Plank MJ, Benhamou S (2008) Random walk models in biology. J R Soc Interface 15: 15.
9. Hall RL (1977) Amoeboid movement as a correlated walk. J Math Biol 4: 327–335.
10. Lomholt MA, Tal K, Metzler R, Joseph K (2008) Le´vy strategies in intermittent search processes are advantageous. Proc Natl Acad Sci USA 105: 11055–11059. 11. Bosgraaf L, van Haastert PJM (2009) Quimp3, an Automated
Pseudopod-tracking Algorithm. Cell Adh Migr 4.
12. Bosgraaf L, van Haastert PJM (2009) The Ordered Extension of Pseudopodia by Amoeboid Cell in the Absence of external Cues. PLoS ONE 4: e5253. doi:10.1371/journal.pone.0005253.
13. Andrew N, Insall RH (2007) Chemotaxis in shallow gradients is mediated independently of PtdIns 3-kinase by biased choices between random protrusions. Nat Cell Biol 9: 193–200.
14. Li L, Norrelykke SF, Cox EC (2008) Persistent cell motion in the absence of external signals: a search strategy for eukaryotic cells. PLoS ONE 3: e2093. doi:10.1371/journal.pone.0002093.
15. Chung CY, Funamoto S, Firtel RA (2001) Signaling pathways controlling cell polarity and chemotaxis. TIBS 26: 557–566.
16. Chen L, Iijima M, Tang M, Landree MA, Huang YE, et al. (2007) PLA(2) and PI3K/PTEN Pathways Act in Parallel to Mediate Chemotaxis. Dev Cell 12: 603–614.
17. Veltman DM, Van Haastert PJM (2006) Guanylyl cyclase protein and cGMP product independently control front and back of chemotaxing Dictyostelium cells. Mol Biol Cell 17: 3921–3929.
18. Veltman DM, Keizer-Gunnink I, Van Haastert PJM (2008) Four key signaling pathways mediating chemotaxis in Dictyostelium discoideum. J Cell Biol 180: 747–753.
19. Schirenbeck A, Bretschneider T, Arasada R, Schleicher M, Faix J (2005) The Diaphanous-related formin dDia2 is required for the formation and mainte-nance of filopodia. Nat Cell Biol 7: 619–625.
20. Van Haastert PJ, Bosgraaf L (2009) Food searching strategy of amoeboid cells by starvation induced run length extension. PLoS One 4: e6814. doi:10.1371/ journal.pone.0006814.
21. Bosgraaf L, Van Haastert PJM, Bretschneider T (2009) Analysis of cell movement by simultaneous quantification of local membrane displacement and fluorescent intensities using Quimp2. Cell Motil Cytoskel 66: 156–165. 22. Bartumeus F, Catalan J, Viswanathan GM, Raposo EP, da Luz MG (2008) The
influence of turning angles on the success of non-oriented animal searches. J Theor Biol 252: 43–55.
23. Fu¨rth R (1920) Die Brownsche Bewegung bei Beru¨cksichtigung einer Persistenz der Bewegungsrichtung. Mit Anwendungen auf die Bewegung lebender Infusorien. Z Physik 2: 244–256.
24. Tchen CM (1952) Random flight with multiplre partial correlations. J Chem Phys 20: 214–217.
25. Wu H-I, Li B-L, Springer TA, Neill WH (2000) Modelling animal movement as a persistent random walk in two dimensions: expected magnitude of nett displacement. Ecol Model 132: 115–124.