www.solid-earth.net/6/185/2015/ doi:10.5194/se-6-185-2015
© Author(s) 2015. CC Attribution 3.0 License.
Fault evolution in the Potiguar rift termination,
equatorial margin of Brazil
D. L. de Castro and F. H. R. Bezerra
Programa de Pós-Graduação em Geodinâmica e Geofísica, Universidade Federal do Rio Grande do Norte, Natal, Brazil Correspondence to:D. L. de Castro, ([email protected])
Received: 10 September 2014 – Published in Solid Earth Discuss.: 2 October 2014 Revised: 31 December 2014 – Accepted: 11 January 2015 – Published: 12 February 2015
Abstract.The transform shearing between South American and African plates in the Cretaceous generated a series of sedimentary basins on both plate margins. In this study, we use gravity, aeromagnetic, and resistivity surveys to identify architecture of fault systems and to analyze the evolution of the eastern equatorial margin of Brazil. Our study area is the southern onshore termination of the Potiguar rift, which is an aborted NE-trending rift arm developed during the breakup of Pangea. The basin is located along the NNE margin of South America that faces the main transform zone that sepa-rates the North and the South Atlantic. The Potiguar rift is a Neocomian structure located at the intersection of the equa-torial and western South Atlantic and is composed of a series of NE-trending horsts and grabens. This study reveals new grabens in the Potiguar rift and indicates that stretching in the southern rift termination created a WNW-trending, 10 km wide, and ∼40 km long right-lateral strike-slip fault zone.
This zone encompasses at least eight depocenters, which are bounded by a left-stepping, en echelon system of NW–SE- to NS-striking normal faults. These depocenters form grabens up to 1200 m deep with a rhomb-shaped geometry, which are filled with rift sedimentary units and capped by postrift sedimentary sequences. The evolution of the rift termination is consistent with the right-lateral shearing of the equatorial margin in the Cretaceous and occurs not only at the rift ter-mination but also as isolated structures away from the main rift. This study indicates that the strike-slip shearing between two plates propagated to the interior of one of these plates, where faults with similar orientation, kinematics, geometry, and timing of the major transform are observed. These faults also influence rift geometry.
1 Introduction
One-third of the present-day passive margins of the world were formed as transform margins. These margins are char-acterized by abrupt ocean–continent transition, steep conti-nental slopes, and high bathymetric gradients inherited from the nearly vertical transform plate boundary (Basile et al., 2013). Classic models of rifting and lithospheric thinning (McKenzie, 1978) cannot explain the evolution of these transform margins, which are characterized by oblique rift-ing and often postrift tectonic inversions (e.g., Vagnes et al., 1998).
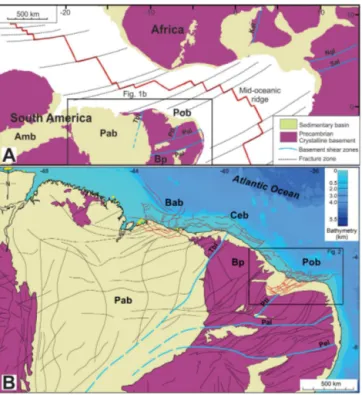
This type of transform margin was responsible for the generation of the South Atlantic, which was the result of a diachronic breakup between the African and South Amer-ican plates. While the eastern margin of South America was subjected to orthogonal rifting, the equatorial margin was subjected to a transform motion between these plates (Matos, 2000). The equatorial margin of South America and West African is characterized by Mesozoic-Cenozoic basins formed along more than 2000 km along the South At-lantic (Matos, 2000). Rifting in the equatorial AtAt-lantic mar-gin occurred during the early Barremian to Aptian, and the first oceanic crust probably accreted during the late Aptian (Basile et al., 2005). This margin and the associated South Atlantic in the South American plate also encompass the Chain, Romanche, and Saint Paul transform faults, which are several hundreds of kilometers long (Fig. 1a).
Figure 1. (a)Schematic reconstruction of northeastern Brazil and western Africa at chron C34 (84 Ma) showing the main prerift pierc-ing point and sedimentary basins (Amb – Amazon; Pab – Parnaíba; Pob – Potiguar) in both margins (adapted from Moulin, 2010). Bp – Borborema Province. Precambrian lineaments: Tbl – Transbrasil-iano; Ptl – Portalegre; Pal – Patos; Pel – Pernambuco; Kal – Kandi; Ngl – Ngaoundere; Sal – Sanaga.(b)Detailed view of the equatorial margin showing the tectonic setting of the Potiguar Basin. The red faults along the margin were formed during the breakup of Pangea; the black traces in the Parnaíba Basin area represent major Precam-brian basement terrain boundaries, basement foliations, and shear zones. Basins: Bab – Barreirinhas; Ceb – Ceará; Pob – Potiguar; Pab – Parnaíba.
margin (Bertani et al., 1990). In addition, this basin has links with the Benue Basin in Nigeria in the counterpart African plate (De Castro et al., 2012). Conventional rifting processes cannot explain this basin and others along the margin.
It follows that, despite the general knowledge of the trans-form margin evolution, several scientific gaps remain, which have important implications for the predrift misfit of the plates (Conceição et al., 1988; Unternehr et al., 1988; De Castro et al., 2012). First, most of the Precambrian fabric is NE-oriented at the margin (e.g., De Castro et al., 2012, 2014), but the equatorial margin trends mainly EW. Second, several rifts exhibit fault systems that are not explained by an orthogonal stretching perpendicular to the rift trend (Bonini et al., 1997). Third, the role of the transform plate motion in the interior of the plate is still uncertain and lacks precise documentation.
We focus on recently published regional magnetic and gravity maps of the Potiguar Basin (De Castro et al., 2012), which show areas at the SW rift boundary, whose
geophys-ical signatures suggest the presence of unidentified buried grabens. The geophysical and geological knowledge of this rift’s internal geometry and boundaries were established by Bertani et al. (1990), Matos (1992), and Borges (1993), and few changes have been added to the rift architecture proposed more than 20 years ago. Here, we examine how faults evolve at rift terminations and whether their geometry is inherited from basement fabric. We used a multidisciplinary geophys-ical survey, which included acquisition, processing, and in-version of magnetic, gravity, and geoelectrical data. In the present study, we investigated the architecture of these struc-tures observed in the study by De Castro et al. (2012) at the southern onshore termination of the Potiguar rift (Fig. 2).
This work may provide new insights that can contribute to a better understanding of the process of continental rifts and transform margin evolution. This study indicates that sev-eral faults that form graben boundaries in the Potiguar rift, oblique to the main transform margin, have the same orienta-tion, kinematics, and geometry as the main transform. It also indicates that deformation related to this margin propagates and influences rift development inside the plate. This may have similarities in other basins of the equatorial margin and in other transform margins elsewhere.
2 Tectonic setting
The deformation during the breakup of South America– Africa shifted from extension in the eastern margin to right-lateral shearing in the equatorial margin, where several NE-trending intracratonic basins were formed (Matos, 1992, 2000). The onset of rifting in the equatorial Atlantic occurred at∼140 Ma in the Neocomian. The early stages of rifting
have a dominantly half-graben geometry, controlled by NE-striking bounding faults, which reactivated the NE-trending Precambrian fabric (Matos, 1992; Souto Filho et al., 2000). A series of NW-trending depocenters were also formed in the equatorial margin during this period (Matos, 2000). Two dominant directions of stretching occurred: NW–SE and EW (Matos, 1992). Rifting was aborted in the early to the late Barremian (125 Ma), which is coeval with the oldest sed-iments of the African margin in the Benue Basin (Matos, 1992; Nóbrega et al., 2005). After that period, the equato-rial and Southern Atlantic oceans united in the late Albian (105 Ma) (Koutsoukos, 1992) and a subsequent thermal sub-sidence occurred, allowing the deposition of a transitional unit that was capped by siliciclastic and carbonate postrift sedimentary units (Bertani et al., 1990).
The onshore Potiguar rift comprises an area ∼150 km
long and∼50 km wide, with an internal geometry of half
Figure 2. Simplified geologic map of the Potiguar Basin in NE Brazil (adapted from Angelim et al., 2006). The rift structures in the maps of Figs. 2 and 4 are inferred from interpretation of seismic sec-tions and well logs, conducted by Matos (1992) and Borges (1993). The grabens located at the SW rift termination are derived from the present geophysical survey.
Branca hinge zone, and in the south by the Apodi fault. The main axis of the onshore Potiguar rift is NE–SW (Fig. 2) (Bertani et al., 1990). The NE–SW-oriented flat to lystric nor-mal faults control the rift internal geometry, whereas NW– SE-trending faults acted as accommodation zones and trans-fer faults in response to the extensional deformation (Matos, 1992).
The main depocenters reach maximum depths of 6000 m, and their basin infill was deposited in a typical continental environment (Araripe and Feijó, 1994). Furthermore, a few grabens occur away from the main depocenters. The best ex-amples are the Jacaúna and Messejana grabens at the western part of the Potiguar Basin (Fig. 2). They are transtensional structures bounded by E–W-trending transfer faults and NW-trending normal faults (Matos, 1992).
In the Potiguar Basin, the rift sequence of Neocomian age is covered by a transitional Aptian marine unit, and later by the Aptian–Campanian fluvial and marine transgressive se-quence, followed by the regional progradation of Paleogene clastic and carbonate deposits. The limit between syn-rift and postrift units is well marked by an angular unconformity that separates thesyn-rift units from the postrift units (Souto Filho et al., 2000; Pessoa Neto et al., 2007). In the SW bor-der of the Potiguar rift, the siliciclastic (lower) and carbon-ate (upper) sequences overlap the rift zone, represented here by the Apodi and Algodões grabens (Fig. 3). Faulting also affected the postrift units from the Late Cretaceous to the Quaternary (Bezerra and Vita-Finzi, 2000; Kirkpatrick et al., 2013). These faults reactivate the Precambrian shear zones or basin-bounding faults as well as cut across preexisting struc-tures (Bezerra et al., 2011).
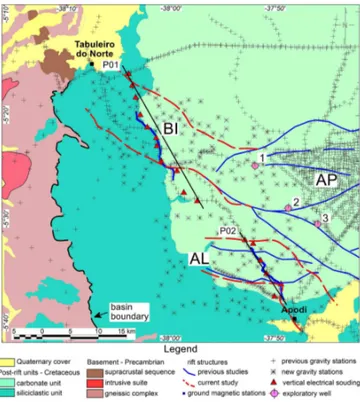
Figure 3.Geologic map of the SW border of the Potiguar rift with the location of the geophysical data sets. (Grabens: BI – Bica; AP – Apodi; and AL – Algodões. Profiles: P01 and P02 (black lines). Exploratory wells: 1, 2, and 3).
3 Geophysical data set 3.1 Magnetics
The aeromagnetic survey in the Potiguar Basin Project was flown between 1986 and 1987 by the Brazilian Petroleum Company (Petrobras) at nominal flight height of 500 m along flight lines oriented 340–160◦and spaced 2.0 km apart (MME/CPRM, 1995). We leveled and interpolated the aero-magnetic data into a 500 m grid, using the bidirectional method for the purposes of digital analysis. We further ap-plied filtering and source detection techniques to the mag-netic data such as regional–residual separation, reduction to magnetic pole, 3-D analytic signal, and Euler deconvolution. In addition, we carried out a magnetic ground survey along two profiles (P01 and P02, Fig. 3) to obtain an enhanced magnetic response of the buried structures. We measured 593 stations, spaced each 40 m, using an ENVI PRO MAG (pro-ton precession) magnetometer in the base stations and a rover with a Geometrics G-858 (cesium vapor) magnetometer.
The reduced-to-pole residual magnetic map is marked by a rugged relief, with positive and negative anomalies of short to medium wavelengths and amplitudes that reach values of between−125 and 215 nT (Fig. 4a). The dominant magnetic
Figure 4. (a)Residual component of the magnetic field reduced to the pole and(b)major magnetic lineaments and Euler solutions;(c) residual gravity anomaly map and(d)major gravity lineaments and Euler solutions. (Grabens (grey zones): BI – Bica; AP – Apodi; and AL – Algodões. Profiles: P01 and P02 (black lines). Exploratory wells: 1, 2, and 3). Solid and dashed white and red traces: rift struc-tures from previous and current studies, respectively.
The magnetic lineaments cut across the Precambrian fabric (metamorphic foliations and shear zones) (Fig. 5). Inside the rift structures (BI, AP, and AL in Fig. 4a), the magnetic sur-face is smooth and the anomalies are almost negative, denot-ing the low magnetic content of the Cretaceous sedimentary infill. A slight NW–SE-oriented lineament coincides with the Apodi fault.
Figure 4a exhibits the magnetic lineaments extracted from the phase of the 3-D analytical signal and the solutions of magnetic sources location and depth analysis using the 3-D Euler deconvolution method (Reid et al., 1990). The optimal parameters to apply the Euler deconvolution for the study area were a structural index of 0 to calculate solutions for source body with contact geometry, search window size of 5.0 km, and maximum tolerance of 15 % for depth uncer-tainty of the calculated solution. The NE–SW main mag-netic trend is followed by the Euler solutions, whose sources are concentrated at depths lower than 1.0 km (Fig. 4b). It is worth mentioning that only a few solutions are coincident with the rift faults. This suggests that the lateral contacts be-tween basin structures and the basement units provide incip-ient contrasts of the magnetic susceptibility.
3.2 Gravity
This study integrated 1743 gravity data points (Fig. 3), which included 234 new gravity stations and 1509 data points
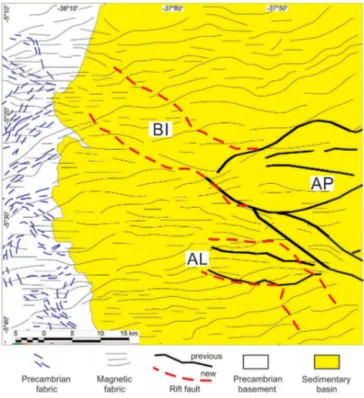
Figure 5.Comparison between Precambrian structural fabric de-rived from remote sensing and NE–SW- to E–W-trending magnetic lineaments. Grabens: BI – Bica; AP – Apodi; and AL – Algodões.
provided by the Brazilian Petroleum Agency (ANP). This data set was interpolated with a grid cell size of 500 m using minimum curvature technique (Briggs, 1974). Af-terwards, we removed the regional component from the gravity field by applying a Gaussian regional–residual fil-ter with a 0.8 cycles m−1 standard deviation. Figure 4c ex-hibits the resulting residual gravity map, where the NW– SE-trending strips of negative anomalies mark a series of grabens. The most northwesterly gravity minimum, here named Bica graben (BI in Fig. 4), represents an extension of the Apodi graben (AP in Fig. 4). Alternatively, a less dense, intrabasement gravity source could be the causative bodies for this anomaly. However, the gravity response of the Apodi graben, with NW–SE elongated minima surrounded by pos-itive anomalies, is accurately reproduced in the Bica region. It is unlikely that basement units generated such an anomaly, especially inserted in a structural framework with a main NE–SW direction (Fig. 4b). Furthermore, magnetic data also corroborate the presence of a thickened basin infill in this area, since the magnetic anomalies and Euler solutions show no intrabasement source.
based on reflection seismic lines. Other short-wavelength gravity minima occur in the NW and NE parts of the study area (Fig. 4c). Nevertheless, the presence of a graben is not expected in those cases. Despite the lack of appropriate sta-tion coverage in those areas, different gravity trends and par-tially outcropped granitic and supracrustal units lead us to such an interpretation.
Figure 4d exhibits the gravity lineaments extracted from the residual anomaly map and the solutions of gravity source detection using the 3-D Euler deconvolution method. The Euler deconvolution parameters applied to gravity data are the same as those applied to the magnetic data. Differently from the magnetic case, the gravity lineaments preferentially trend in the NW–SE direction, following the main rift faults. In turn, the Euler solutions reveal narrow (less than 1500 m depth) gravity sources oriented in the NW–SE direction in the rift zone (shaded area in Fig. 4d). The faulted borders of the grabens are delimited by the Euler solutions. On the other hand, Euler solutions are oriented N–S and E–W in the SW and northern parts of the study area, respectively. Some of these solutions are related to the intrabasement gravity sources and structures, but most of them are biased by the scarce and irregular distribution of gravity stations, concen-trated along roads (Fig. 3).
3.3 Geoelectrical sounding
Seventeen geoelectrical surveys were carried out along two profiles crossing the rift structures (P01 and P02 in Figs. 3 and 4). The vertical electrical soundings (VESs) were mea-sured to define different geoelectrical layers and the inter-nal geometry of the grabens. The soundings were spaced 2.0 to 3.0 km, and all measurements were taken using a Schlumberger electrode array with current electrode half spacing (AB/2) ranging between 1.5 and 1200 m. The re-sistivity equipment comprises a DC–DC converter 12/1000, with maximum power of 500 W, and a digital potential re-ceiving unit, which were able to provide the apparent resis-tivity with high accuracy.
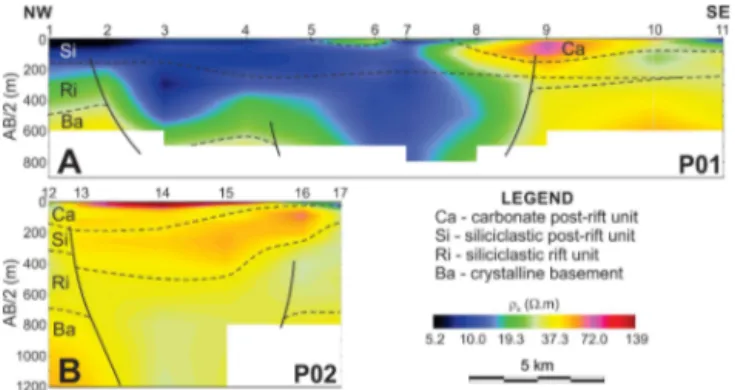
We constructed two geoelectrical pseudosections using the resistivity measurements and the half spacing between the current electrodes (Fig. 6). The study indicates four geoelec-trical units in both sections. The deepest unit represents the crystalline basement with a resistivity up to 50m. Directly overlying the bedrock occurs a low-resistivity layer (< 35
m), which is interpreted as the siliciclastic rift unit. In pro-file 01, the lateral increase of resistivity between VESs 8 and 9 indicates the faulted border of the Bica graben and, con-sequently, the SE limit of this geoelectrical layer (Fig. 6a). The geoelectrical layers show a generalized increase in re-sistivity from this area as far as the SE end of profile 01 and in all of profile 02. This pattern could be explained as a de-crease in the moisture content caused by the presence of a low-permeability carbonate layer on the top of the sedimen-tary infill. Along profile 02, the rift sequence reaches its
high-Figure 6.Interpreted apparent resistivity cross sections of profiles P01 (top) and P02 (bottom). VES locations: 1 to 17.
est thickness in the Algodões depocenter between VESs 13 and 16 (Fig. 6b).
The intermediary geoelectrical layer (Si in Fig. 6) is char-acterized by very low resistivities (< 18m), where the sili-ciclastic unit of the postrift sequence outcrops (Figs. 3 and 6). In the SE part of profile 01 (VESs 8 to 11), this layer resis-tivity reaches 55m, where it is overlapped by a more resis-tive layer (> 140m), the carbonate unit. Its thickness varies from 150 to 230 m along profile 01, whereas this layer is 350 m thicker over the main depocenter in profile 02 (Fig. 6), suggesting local reactivation of rifting faults during fluvial and marine transgression in the postrift phase. The upper-most carbonate unit also exhibits a thickening in the Algo-dões rift zone along profile 02.
4 Gravity–geoelectric joint inversion
We applied an algorithm developed by Santos et al. (2006) in two transects, crossing the Bica (P01) and Algodões (P02) grabens (Figs. 3 and 4) to identify the resistivity interfaces and subsurface electrical resistivity distribution within the rifting areas. This algorithm is based on the simulated anneal-ing technique to jointly invert gravity and resistivity (VES) data for mapping the internal architecture of the basin and its layered infill. Using seismic and well log data to con-strain this joint-inversion procedure, De Castro et al. (2011) obtained good results for the rift internal architecture apply-ing the Santos algorithm in a regional transect across the Po-tiguar Basin.
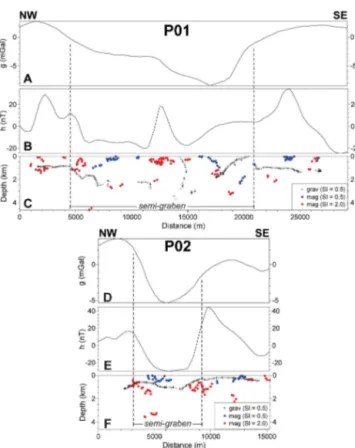
Figure 7.Gravity(a, d)and magnetic(b, e)anomalies and Euler solutions(c, f)of profiles P01 (top) and P02 (bottom).
expected behavior of the faulted borders of the grabens in depth. The structural index of 0.5 applied to magnetic data is more suitable to indicate basement heterogeneities.
In transect P01, the alignment pattern of gravity Euler so-lutions marks both the NW and SE edges of the Bica graben (crosses in Fig. 7c). This set of gravity Euler solutions sug-gests a semi-graben in agreement with the geoelectrical sec-tion (Fig. 6). Unlike the gravity data, clouds of magnetic Eu-ler solutions indicate shallow causative sources within the basin (circles in Fig. 7c), although few solutions are coin-cident with gravity Euler solutions at the boundaries of the graben. A similar result was obtained in the Algodões graben (P02 in Fig. 7f). However, the gravity Euler solutions are flat-ter than expected for the fault that limits the NW rift edge, which suggests that the border faults of the Algodões rift ex-hibit a low dip angle. Additionally, magnetic Euler solutions mark intrabasement sources at the graben shoulders (red cir-cles in Fig. 7f).
In order to apply the joint inversion, we adopted a four-layer model for transect P01, representing the basement, rift and postrift units, and a thin soil layer. In profile 02, the up-permost postrift sequence could be divided into two layers, since the siliciclastic and carbonate units are well defined along all VESs (Fig. 6b). Each layer was discretized in 31 (profile 01) or 17 (profile 02) cells with widths of 1.0 km. At both ends of the profile, the cells are extended 10 km to avoid
edge effects in the calculated gravity anomalies. The density values of the layers in kilograms per cubic meter (kg m−3) were, from base to top, 2750 for the bedrock (basement), 2500 (rift sequence), 2300 (siliciclastic unit), 2450 (carbon-ate unit), and 2000 (superficial dry soil). In profile 01, a density of 2350 kg m−3 was assumed for the postrift unit, encompassing the siliciclastic and carbonate units. We per-formed 25 density measurements on selected samples that represented sedimentary and basement rocks. Densities ob-tained by De Castro (2011) in the well logs located at the eastern border of the Potiguar rift were also considered in the models. The density measurements increase with depth and represent sediment compaction.
Initially, a 1-D inversion method was applied in each VES to obtain estimates of the resistivity of the 2-D model layers, as well to establish search limits of resistivity and depth for each model cell. Estimates of the resistivity and thickness values were calculated from the original data by using the IPI2Win software developed by Bobachev (2003). The in-version method uses a variant of the Newton algorithm of the least number of layers or the regularized fitting minimizing algorithm using Tikhonov’s approach (Tikhonov and Ars-enin, 1977) to solve problems. Iterations using this code were carried out automatically and interactively (semi-automated) until the calculated model satisfied a minimum difference be-tween measured and calculated data.
Figures 8 and 9 present the internal geometry and density– resistivity distribution of the final models obtained by the joint inversion for each profile. In general, both gravity and geoelectric data have good degrees of fit in comparison with the calculated gravity anomaly and DC curves, respectively. The grabens identified in the geoelectrical sections (Fig. 6) and by gravity Euler solutions (Fig. 7) were reconstituted by gravity–geoelectric modeling. In profile 01, the SE border of the Bica half graben, revealed by the calculated model, is controlled by a normal fault with 40◦dip to the NW and vertical offset of almost 1200 m (Fig. 8). A basement high bounds the 8 km wide main depocenter to the NW. Outside the rift, the basin infill sharply decreases to less than 200 m thick. The postrift unit exhibits a slight thickening northwest-ward (Ca/Si in Fig. 8). Likewise, the Algodões graben shows half-graben geometry, reaching a maximum depth of 1150 m (Fig. 9). However, the postrift siliciclastic unit is thickened on the central portion of the rift (Si in Fig. 9), unlike the flat-tened postrift deposition in the Bica graben, which suggests a tectonic reactivation in the Algodões graben during the de-position of the postrift unit.
5 3-D gravity modeling
Figure 8. Observed (dots) and calculated (solid line) gravity anomaly across profile 01(a)and the final model response obtained from joint inversion method (b). Comparison of three VES data (dots) and model responses of the gravity–geoelectric joint inver-sion(c–e). rms: VES misfit (per cent).
to account for the increase in density with depth within the basin (Rao and Babu, 1991). The new approach used here takes into account the possibility that basement rocks that underlie sedimentary basins have variable density. This ap-proach separates basin and basement gravity during the mod-eling process, which provides the shape of the low-density basin, without the gravity effects of the heterogeneous base-ment (Jachens and Moring, 1990; Blakely, 1996).
The calculated thickness of basin-filling deposits depends on the density–depth function used in the modeling (Blakely et al., 1999). In the study area, the coefficients of the den-sity function within the basin were fitted by the least-squares method and were extracted from the joint-inverted final density models. Nevertheless, the linear coefficient of the quadratic function represents the density contrast in surface and guides the modeling process. The chosen superficial con-trast was−270 kg m−3, which provides good agreement with
joint-inverted models (Figs. 8 to 10 and Table 1). However, the calculated depths of this 3-D model do not match with the basin infill thickness at exploratory wells in the Apodi graben (location in Figs. 3, 4, and 10). Using a lower-density con-trast (−200 kg m−3), the resulting gravity model provided
depths for the basement top that are consistent with the depth found in the exploratory well 3 (Table 1). The high misfit for well 1 points out that the density contrast increases westward to the Apodi graben boundary, getting closer to the density
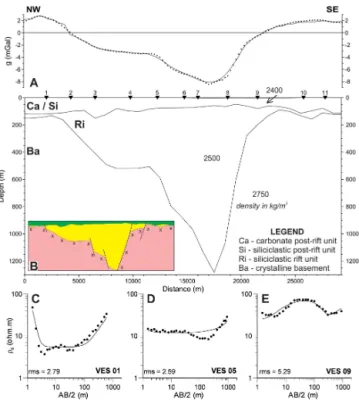
Figure 9. Observed (dots) and calculated (solid line) gravity anomaly across profile 02(a)and the final model response obtained from joint inversion method(b). Comparison of three VES data (dots) and model responses of the gravity–geoelectric joint inver-sion(c–e). rms: VES misfit (per cent).
data set for the Bica graben. In summary, gravity modeling reveals that the densities are higher where the basin infill is thicker, probably due to more intense sediment compaction in these areas. Since the major interest of this research is fo-cused on the Bica and Algodões grabens, Figure 10 shows the 3-D gravity model obtained using the density contrast of −270 kg m−3, which was more consistent with the
re-sults of the joint inversion. Assuming a basement density of 2750 kg m−3, the modeling yielded average densities of these sedimentary units of about 2480 kg m−3.
6 Architecture and kinematics of the Potiguar rift termination
The present study indicates that the southern termination of the main rift is more complex than the previous investiga-tions have indicated. The analysis of the magnetic linea-ments and the basement foliation and shear zones indicate that the basement fabric did not exert control in fault ge-ometry at the rift termination, as already observed in the NE-trending lystric faults by De Castro et al. (2012) along the main rift. The new rift termination is characterized by a WNW-trending, 10 km wide, and∼40 km long fault zone.
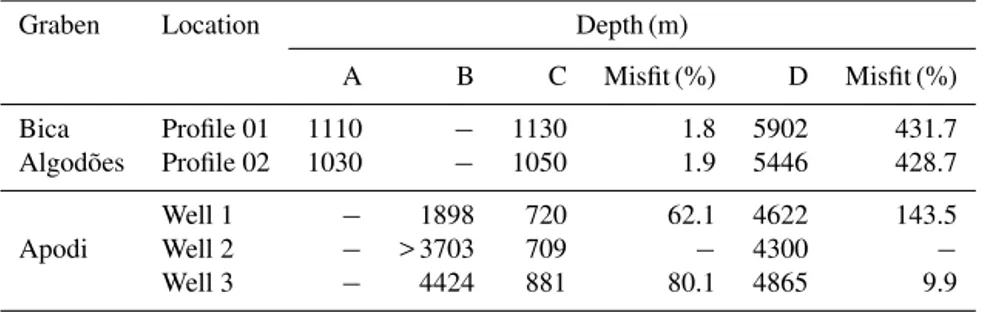
Table 1. Comparison between the depths to basement obtained from joint-inverted approach (A) and in exploratory wells (B) and those depths obtained by the 3-D gravity modeling using density contrast of−270 kg m−3(C) and−200 kg m−3(D) and the respective misfits.
Graben Location Depth (m)
A B C Misfit (%) D Misfit (%)
Bica Profile 01 1110 − 1130 1.8 5902 431.7
Algodões Profile 02 1030 − 1050 1.9 5446 428.7
Apodi
Well 1 − 1898 720 62.1 4622 143.5
Well 2 − > 3703 709 − 4300 −
Well 3 − 4424 881 80.1 4865 9.9
Figure 10.Basement contour map of the SW border of the Potiguar rift derived from 3-D-gravity modeling with major fault segments (thin white traces). Thick white traces: rift limits from previous studies. Grabens: BI – Bica; AP – Apodi; and AL – Algodões.
interpreted the depocenters to exhibit an en echelon geome-try and fault segments 35 km long.
The depocenters form two main grabens, the Algo-dões and the Bica grabens. The former was described by Matos (1992), whereas the latter is a new structure presented for the first time in the present study. Both grabens are sepa-rated from the main rift by horsts, and their main axes are at a high angle to the NE-trending Potiguar rift. Both grabens are composed ofsyn-rift and postrift sedimentary units. Thesyn -rift units are bounded by -rift faults, whereas the post-rift units cap the whole basin. In addition, both grabens do not exhibit present-day topographic expression, and most of the faults that cut across the rift units die out in the postrift layers.
The 3-D gravity model reveals a NW-trending rift geome-try for the Bica graben (BI in Fig. 10), beyond the previously mapped limits of the Potiguar rift. This graben is ∼30 km
long and∼15 km wide, and it is limited by segmented
NW-trending oblique-slip faults. NS-oriented, en echelon faults split the graben into four depocenters, whose greatest thick-ness reaches 1130 m. One of these rift borders is the Apodi fault (2 in Fig. 2), previously described in the study of Bertani et al. (1990) as a normal fault. The Mulungu fault was also identified by Bertani et al. (1990) and Matos (1992) (1 in Fig. 2). This rift geometry is roughly similar to the internal architecture of the Apodi graben (AP in Fig. 10). The Al-godões graben comprises an E–W-trending structure 25 km long and 8 km wide, which bends in the NW–SE direction in its eastern part (AL in Fig. 10). Unlike in others grabens, the Apodi fault system exerts structural control on the northern rift border of the Algodões graben (Fig. 10). Furthermore, an incipient basement high separates the Algodões graben into two depocenters. The occurrence of this structure is well recorded in the magnetic, gravity, and geoelectrical data (Figs. 4 and 6). The local basin infill is up to 1050 m deep.
The deformation was partitioned between the WNW-striking rift strike-slip faults and the internal N–S- to NW– SE-striking, en echelon normal faults. The lack of surface expression of the faults in the study area indicates that they were mainly active during rifting. The study also indicates that the WNW-trending faults that border the Bica and Al-godões grabens and their relationship with the NS-trending faults are consistent with an oblique-slip dextral component of displacement of the former. The NW–SE- to NS-trending en echelon faults occur in both grabens and are consistent with this oblique-slip dextral component movement of the WNW-striking faults. The maximum vertical throws of the NW-trending border faults are∼1100 m, and they decrease
7 Discussion
7.1 The evolution of the Potiguar rift in the context of the transform margin
The reactivation of the Precambrian tectonic fabrics origi-nated the main NE-trending basin-bounding fault (De Cas-tro et al., 2012). In this context, the preexisting structures in the upper lithosphere exert the main control of fault reactiva-tion during continental rifting (De Castro et al., 2012). How-ever, this study indicates that the southern rift termination cut across the existing Precambrian fabric. The en echelon de-pocenters in the southern rift termination are consistent with thesyn-transtensional phase of the equatorial margin (Matos, 2000), which also cut across the preexisting basement fabric along the margin.
The Potiguar rift experienced two phases of extension: the first was a NW-trending extension in the Neocomian and the second was an E–W-trending rift extension in the Bar-remian (Matos, 1992). During the first rift stage, the Apodi fault marked the rift termination as a normal fault (Matos, 1992). The stretching observed at the Potiguar rift in the present study is consistent with the second phase of rift ex-tension, where the Apodi fault moved as a right-lateral shear zone. It suggests that this rift termination developed after the main rift trend was aborted (Matos, 1992). This rift termi-nation also coincides with the development of the Jacaúna and Messejana grabens (Fig. 2), which were formed by EW-trending extension (Matos, 1992), and with the onset of rift-ing in the equatorial margin (Matos, 2000).
Crustal extension in the first rift phase was distributed across the NE-trending rift faults of the Potiguar rift. After-wards, during the evolution of the Potiguar rift termination, fault movement was partitioned between the master faults and the internal graben faults. This pattern of rift termination is different from the one observed at the other small basins to the south of the Potiguar rift, where the rift border and in-trarift faults are roughly orthogonal to the rift stretching (De Castro et al., 2007, 2008).
The dextral shear of the border faults of the small grabens adjacent to and to the west of the Potiguar main rift roughly coincides with the major transform movement of Africa and South America along the equatorial margin (Fig. 1). The transtension of the equatorial margin is consistent with the NW-trending depocenters and right-lateral shear of the southern termination of the Potiguar rift.
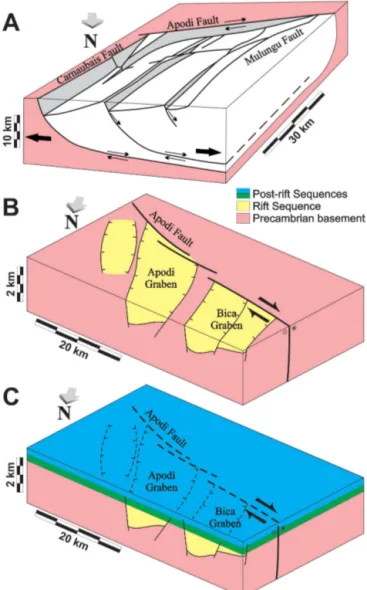
It follows that the main Potiguar graben trends NE–SW and developed along preexisting basement structures (De Castro et al., 2012). However, the right-lateral shearing of the Apodi fault was dissipated by transtensional opening and formation of en echelon grabens at the Potiguar rift southern termination (Fig. 11a, b). The slip of the Apodi fault is syn-thetic to the right-lateral shear of the equatorial margin. The right-lateral movement of the Apodi fault continued during deposition of the postrift units (Fig. 11c).
Figure 11.Illustration of(a)the main framework of the Potiguar Basin proposed by Matos (1992) (modified from Rodrigues et al., 2014);(b)the geometry and kinematics of the Apodi faults and the N–S-trending graben during the rift phase and(c)the postrift phase.
Our study also indicates that some rift faults affect up-per layers of the postrift phase, such as the Late Cretaceous Açu and Jandaíra formations. However, the precision of the methods we used in the present study does not allow a more precise description and analysis of the upper continuation of these faults. Therefore, additional deformation in the postrift phase with tectonic inversion and oceanward tilting, as al-ready observed along the equatorial margin of South Amer-ica (Basile et al., 2013), must be addressed by further studies.
7.2 Implications for other transform margins
which allowed the deposition of sediments during the Ceno-zoic in East Antarctica (Cianfarra et al., 2009). Likewise, the E–W-trending faults at the southern termination of the Po-tiguar rift also produced depressions, which resulted in the generation of grabens. In both cases, these structures form fault-controlled, elongated troughs.
In SE Australia, the N–S-trending Tasman fracture zone induced volcanism inside the Australian plate. The volcanic site occupies an area at least 200–450 km away from the main trace of the transform fracture zone. The faults inside the plate have also the same geometry, trend, kinematics, and timing of the main Tasman fracture zone. The magmatism is the most recent volcanic activity in the Australian continent, spanning from the Pliocene to the Holocene. The propaga-tion of the transform fracture zone also cut across preexisting basement structures such as folds and foliations when they present unfavorable orientations for reactivation under the present stress field (Lesti et al., 2008). This pattern clearly in-dicates the propagation of the deformation of the main trans-form boundary inside the intraplate setting, where the defor-mation progressively fades away. This example could indi-cate that faulting related to the equatorial margin of South America could occur even farther south of the Potiguar rift termination and that this kind of influence could be expected along the entire equatorial margin of Brazil.
Likewise Storti et al. (2007) concluded that plate bound-aries related to fracture zones in the Ross Sea region of Antarctica have been slowly deforming during the Ceno-zoic, and they proposed the potential intraplate influence of oceanic transform fracture zone shear inside the plate. This type of transfer of transform shear from the plate boundary to the plate interior is possible if the oceanic spreading ve-locity is larger than the veve-locity of the plate (Salvini et al., 1997). These studies, however, have argued for a collinear continuation of transform boundaries inside the plate. Our study indicates that this kind of influence could also occur in zones parallel to and at least 200 km away from the transform boundary. This could also be the case of the entire equato-rial margin of South America, but further investigations are needed.
8 Conclusions
Previous studies indicate that the Potiguar rift lies at the in-tersection of the equatorial margin and the eastern margin of South America and is overburden by the postrift sedi-mentary units. It encompasses a series of NE-trending horsts and grabens. This study extends the investigation of previ-ous works by focusing on the fault evolution at the rift ter-mination using gravity, magnetic, and resistivity data. This study indicates that stretching of the southern end of the Po-tiguar rift was accommodated by both a∼40 km long
strike-slip and a system of minor left-stepping, en echelon normal faults. We documented two small rhomb-shaped grabens at
the rift termination. They are NW–SE- to NS-trending full grabens developed during rifting. The grabens were devel-oped along NW-trending oblique-slip faults. Depocenters in the grabens were split by en echelon NS-trending normal faults. Faults of these grabens die out in the postrift sedi-mentary units. The rifting coincided with the development of the equatorial margin, which was subjected to right-lateral transform movement during this period. The southern part of the Potiguar rift termination is consistent with the transfer of transform shear from the plate boundary to the plate interior, influencing rift development inside the plate. This kind of deformation may have occurred along the entire equatorial margin of South America and may occur elsewhere along other transform plate boundaries.
Acknowledgements. We thank two anonymous reviewers and the topical editor, Federico Rossetti, for their positive criticism, which greatly improved our manuscript. This project was funded by the Brazilian Research Council (CNPq), grant 470891/2010-6 awarded to D. L. de Castro. We also thank the Brazilian Agency of Petroleum and Gas (Agência Nacional do Petróleo, Gás Natural e Biocombustíveis – ANP) for providing well logs and seismic lines. Both authors hold grants from CNPq (PQ grant).
Edited by: F. Rossetti
References
Angelim, L. A. A., Medeiros, V. C., and Nesi, J. R.: Programa Ge-ologia do Brasil – PGB, Projeto Mapa Geológico e de Recursos Minerais do Estado do Rio Grande do Norte, Mapa Geológico do Estado do Rio Grande do Norte, Escala 1 : 500 000, Recife: CPRM/FAPERN, 2006.
Araripe, P. T. and Feijó, F. J.: Bacia Potiguar. Boletim de Geociên-cias da Petrobras, 8, 127–141, 1994.
Basile, C., Mascle, J., and Guiraud, R.: Phanerozoic geological evo-lution of the Equatorial Atlantic, J. Af. Earth Sci., 43, 275–282, 2005.
Basile, C., Maillard, A., Patriat, M., Gaullier, V., Loncke, L., Roest, W., Mercier de Lépinay, M., and Pattier, F.: Structure and evo-lution of the Demerara Plateau, offshore French Guiana: Rift-ing, tectonic inversion and post-rift tilting at transform–divergent margins intersection, Tectonophysics, 591, 16–29, 2013. Bertani, R. T., Costa, I. G., and Matos, R. M. D.: Evolução
tectono-sedimentar, estiloestrutural e habitat do petróleo na Bacia Po-tiguar., In: Origem e evolução de Bacias Sedimentares, Petro-bras, Rio de Janeiro, edited by: Gabaglia, G. P. R., Milani, E. J., 291–310, 1990.
Bezerra, F. H. R. and Vita-Finzi, C.: How active is a passive mar-gin? Paleoseismicity in northeastern Brazil, Geology, 28, 591– 594, 2000.
Blakely, R. J.: Potential Theory in Gravity and Magnetic Applica-tions, 2nd Edn., Cambridge University Press, London, p. 441, 1996.
Blakely, R. J., Jachens, R. C., Calzia, J. P., and Langenheim, V. E.: Cenozoic basins of the Death Valley extended terrane as reflected in regional-scale gravity anomalies, Geol. S. Am. S., 333, p. 16, 1999.
Bobachev, A.: IPI2Win-1D automatic and manual interpretation software for VES data, available at: http://geophys.geol.msu.ru/ ipi2win.htm (last access: 19 August 2007), 2003.
Bonini, M., Souriot, T., Boccaletti, M., and Brun, J. P.: Successive orthogonal and oblique extension episodes in a rift zone: Labora-tory experiments with application to the Ethiopian Rift, Tecton-ics, 16, 347–362, 1997.
Borges, W. R. E.: Caracterização Estrutural daPorção SW do Rifte Potiguar. MSc thesis, Universidade Federal de Ouro Preto, Ouro Preto, Brazil, p. 146, 1993.
Briggs, I. C.: Machine contouring using minimum curvature, Geo-physics, 39, 39–48, 1974.
Cianfarra, P., Forieri, A., Salvini, F. Tabacco, I. E., and Zirizotti, A.: Geological setting of the Concordia Trench-Lake system in East Antarctica, Geophys. J. Int., 177, 1305–1314, 2009.
Conceição, J. C. J., Zalán, P. V., and Wolff, S.: Mecanismo, Evolução e Cronologia do Rift Sul-Atlântico, Boletim de Geo-ciências da PETROBRAS, 2, 255–265, 1988.
De Castro, D. L.: Gravity and magnetic joint modeling of the Po-tiguar rift basin (NE Brazil): basement control during Neocomian extension and deformation, J. S. Am. Earth Sci., 31, 186–198, 2011.
De Castro, D. L., Oliveira, D. C., and Castelo Branco, R. M. G.: On the Tectonics of the Neocomian Rio do Peixe rift basin, NE Brazil: Lessons from gravity, magnetics and radiometric data, J. S. Am. Earth Sci., 24, 186–202, 2007.
De Castro, D. L., Bezerra, F. H. R., and Castelo Branco, R. M. G.: Geophysical evidence of crustal-heterogeneity control of fault growth in the Neocomian Iguatu basin, NE Brazil, J. S. Am. Earth Sci., 26, 271–285, 2008.
De Castro, D. L., Pedrosa, N. C., and Santos, F. A. M.: Gravity-geoelectric joint inversion over the Potiguar rift basin, NE Brazil, J. Appl. Geophys., 75, 431–443, 2011.
De Castro, D. L., Bezerra, F. H. R., Sousa, M. O. L., and Fuck, R. A.: Influence of Neoproterozoic tectonic fabric on the origin of the Potiguar Basin, northeastern Brazil and its links with West Africa based on Gravity and Magnetic Data, J. Geodyn., 54, 29– 42, 2012.
De Castro, D. L., Fuck, R. A., Phillips, J. D., Vidotti, R. M., Bez-erra, F. H. R., and Dantas, E. L.: Crustal structure beneath the Paleozoic Parnaíba Basin revealed by airborne gravity and mag-netic data, Brazil, Tectonophysics, 614, 128–145, 2014. Jachens, R. C., and Moring, B. C.: Maps of thickness of
Ceno-zoic deposits and the isostatic residual gravity over basement for Nevada, US Geological Survey Open-File Report 90-404, scale 1 : 1 000 000, 1990.
Kirkpatrick, J. D., Bezerra, F. H. R., Shipton, Z. K., Do Nascimento, A. F., Pytharouli, S. I., Lunn, R. J., and Soden, A. M.: Scale-dependent influence of pre-existing basement shear zones on rift faulting: a case study from NE Brazil, J. Geol. Soc. London, 170, 237–247, 2013.
Koutsoukos, E. A. M.: Late Aptian to Maastrichtian foraminiferal biogeography and palaeoceanography of the Sergipe basin, Brazil, Palaeogeogr. Palaeocl., 92, 295–324, 1992.
Lesti, C., Giordano, G., Salvini, F., and Cas, R.: Volcano tectonic setting of the intraplate, Pliocene-Holocene, Newer Volcanic Province (southeast Australia): Role of crustal fracture zones, J. Geophys. Res., 113, B07407, doi:10.1029/2007JB005110, 2008. Matos, R. M. D.: The northeast Brazilian rift system, Tectonics, 11,
766–791, 1992.
Matos, R. M. D.: Tectonic Evolution of the Equatorial South At-lantic, Geophysical Monography AGU, 115, 331–354, 2000. McKenzie, D. P.: Some remarks on the development of sedimentary
basins, Earth. Planet. Sc. Lett., 40, 25–32, 1978.
MME/CPRM: Catálogo General de Produtos e Serviços, Geolo-gia, Levantamentos Aerogeofísicos – Database AERO. Rio de Janeiro, p. 359, 1995.
Moulin, M., Aslanian, D., and Unternehr, P.: A new starting point for the South and Equatorial Atlantic Ocean, Earth-Sci. Rev., 98, 1–37, 2010.
Nóbrega, M. A., Sa, J. M., Bezerra, F. H. R., Hadler Neto, J. C., Iunes, P. J., Oliveira, S. G., Saenz, C. A. T., and Lima Filho, F. P.: The use of apatite fission track thermochronology to constrain fault movements and sedimentary basin evolution in northeastern Brazil, Radiat. Meas., 39, 627–633, 2005.
Pessoa Neto, O. C., Soares, U. M., Silva, J. G. F., Roesner, E. H., Florência, C. P., and Souza, C. A. V.: Bacia Potiguar, Boletim de Geociências da Petrobras, 15, 357–369, 2007.
Ponte, F. C., Fonseca, J. R., and Morales, R. E.: Petroleum geology of the eastern Brazilian Continental Margin, AAPG Bull., 61, 1470–1482, 1977.
Rao, D. B., and Babu, N. R.: A Fortran-77 computer program for three-dimensional analysis of gravity anomalies with variable density contrast, Comput. Geosci., 17, 655–667, 1991.
Reid, A. B., Allsop, J. M., Granser, H., Millet, A. J., and Somerton, I. W.: Magnetic interpretation in three dimensions using Euler deconvolution, Geophysics, 55, 80–91, 1990.
Rodrigues, R. S., De Castro, D. L., and Reis Jr., J. A.: Characteriza-tion of the Potiguar Rift Structure based on Euler DeconvoluCharacteriza-tion, Brazil. J. Geophys., 32, 109–121, 2014.
Salvini, F., Brancolini, G. Busetti, M. Storti, F. Mazzarini, F., and Coren, F.: Cenozoic geodynamics of the Ross Sea region, Antarc-tica: Crustal extension, intraplate strike-slip faulting and tectonic inheritance, J. Geophys. Res., 102, 669–696, 1997.
Santos, F. A. M., Sultan, S. A., Represas, P., and El Sorady, A. L.: Joint inversion of gravity and geoelectrical data for groundwater and structural investigation: application to the northwestern part of Sinai, Egypt. Geophys. J. Int., 165, 705–718, 2006.
Souto Filho, J. D., Correa, A. C. F., Santos Neto, E. V., and Trindade, L. A. F.: Alagamar-Açu petroleum system, onshore Potiguar Basin, Brazil: A numerical approach for secondary mi-gration. In: Petroleum systems of South Atlantic margins, AAPG Memoir., edited by: Mello, M. R. and Katz, B. J., 73, 151–158, 2000.
Storti, F., Salvini, F., Rossetti, F., and Phipps Morgan, J.: Intraplate termination of transform faulting within the Antarctic continen, Earth Planet. Sc. Lett., 260, 115–126, 2007.
Unternehr, P., Curie, D., Olivet, J. L., Goslin, J., and Beuzart, P.: South Atlantic fits and intraplate boundaries in Africa and South America, Tectonophysics, 155, 169–179, doi:10.1016/0040-1951(88)90264-8, 1988.