Submitted5 July 2016
Accepted 8 November 2016
Published22 December 2016
Corresponding author
Mostafa Rezaei-Tavirani, [email protected]
Academic editor
Gabriela Constantin
Additional Information and Declarations can be found on page 16
DOI10.7717/peerj.2775 Copyright
2016 Safari-Alighiarloo et al.
Distributed under
Creative Commons CC-BY 4.0 OPEN ACCESS
Network-based analysis of differentially
expressed genes in cerebrospinal fluid
(CSF) and blood reveals new candidate
genes for multiple sclerosis
Nahid Safari-Alighiarloo1, Mostafa Rezaei-Tavirani1, Mohammad Taghizadeh2,
Seyyed Mohammad Tabatabaei3and Saeed Namaki4
1Proteomics Research Center, Department of Basic Science, Faculty of Paramedical Sciences, Shahid Beheshti
University of Medical Sciences, Tehran, Iran
2Bioinformatics Department, Institute of Biochemistry and Biophysics, Tehran University, Tehran, Iran 3Medical Informatics Department, Faculty of Paramedical Sciences, Shahid Beheshti University of
Medical Sciences, Tehran, Iran
4Immunology Department, Faculty of Medical Sciences, Shahid Beheshti University of Medical Sciences,
Tehran, Iran
ABSTRACT
Background. The involvement of multiple genes and missing heritability, which are dominant in complex diseases such as multiple sclerosis (MS), entail using network biology to better elucidate their molecular basis and genetic factors. We therefore aimed to integrate interactome (protein–protein interaction (PPI)) and transcriptomes data to construct and analyze PPI networks for MS disease.
Methods. Gene expression profiles in paired cerebrospinal fluid (CSF) and peripheral blood mononuclear cells (PBMCs) samples from MS patients, sampled in relapse or remission and controls, were analyzed. Differentially expressed genes which determined only in CSF (MSvs.control) and PBMCs (relapsevs.remission) separately integrated with PPI data to construct the Query-Query PPI (QQPPI) networks. The networks were further analyzed to investigate more central genes, functional modules and complexes involved in MS progression.
Results. The networks were analyzed and high centrality genes were identified. Explo-ration of functional modules and complexes showed that the majority of high centrality genes incorporated in biological pathways driving MS pathogenesis. Proteasome and spliceosome were also noticeable in enriched pathways in PBMCs (relapsevs.remission) which were identified by both modularity and clique analyses. Finally, STK4, RB1, CDKN1A, CDK1, RAC1, EZH2, SDCBP genes in CSF (MSvs.control) and CDC37, MAP3K3, MYC genes in PBMCs (relapse vs.remission) were identified as potential candidate genes for MS, which were the more central genes involved in biological pathways.
Discussion. This study showed that network-based analysis could explicate the complex interplay between biological processes underlying MS. Furthermore, an experimental validation of candidate genes can lead to identification of potential therapeutic targets.
SubjectsBioinformatics, Computational Biology, Immunology, Neurology
INTRODUCTION
Multiple sclerosis (MS) is a complex disease affecting the central nervous system (CNS) in which genetic, environmental and immunological factors are considered as its etiology (Ebers, 2008; Svejgaard, 2008). Although MS shows both autoimmune and neurodegenerative features, the pathophysiological processes which may occur both within and outside of the CNS remain obscure and don’t have an uniform distribution within the MS population (Brynedal et al., 2010). To study such complex diseases, which involved noticeably missing heritability (Goris & Liston, 2012;Manolio et al., 2009), it is more efficient to describe perturbed processes and dysregulated pathways rather to identify individual genes (Kim, Wuchty & Przytycka, 2011).
Transcriptome analysis of the target organ, i.e., the central nervous system, should reflect an unbiased survey of expression profiles for genes with altered transcript levels in disease states. Since it is difficult to achieve CNS samples, cerebrospinal fluid (CSF) cells have been used in many studies as a surrogate for the target organ in CNS disorders (Brynedal et al., 2010). Furthermore, peripheral blood mononuclear cells (PBMCs) are being considered as an easily accessible and informative source of biological material in MS transcriptome studies (Achiron et al., 2004;Bomprezzi et al., 2003;Singh et al., 2007). In this line, it has been reported that the study linking peripheral and CSF immune responses were essential to understand the immunopathogenesis of MS (Christensen et al., 2012).
Since the expression level change of a gene in a transcriptomic profile may be a result of an expression change of another gene and may not be the direct cause of the cellular phenotype, additional information is required to put them in context (Wachi, Yoneda & Wu, 2005). Network-based analyses of protein–protein interaction (PPI) or interactome delineate the known associations among proteins in the context of biochemistry, signal transduction and biomolecular networks (Rezaei-Tavirani et al., 2016;Zali & Rezaei-Tavirani, 2014;Wu et al., 2009). The integration analysis of large scale gene expression and PPI data will place the differentially expressed genes in the biological context (Bapat et al., 2010;Li et al., 2012;Safari-Alighiarloo et al., 2014;Safari-Alighiarloo et al., 2016). Protein networks reflect the functional grouping of interacting up/down regulated genes. The roles of the subsets of these genes, therefore, may be resolved using the combined data (Wachi, Yoneda & Wu, 2005).
Genes and Genomes (KEGG) and Reactome to identify the sets of biological processes and molecular pathways of genes.
This study integrated transcriptome-interactome data to construct PPI networks for MS using abnormally expressed genes in paired CSF and PBMCs samples. Topological analyses were performed to determine the significant network biomarkers. Underlying biological processes and pathways have been sought by modularity and clique analyses. Finally, potential disease markers were identified, which were high centrality genes significantly involved in functional modules or complexes.
METHODS
Transcriptome data collection and processing
Gene expression profiles in both CSF cells and PBMCs were obtained from the ArrayExpress Database under the accession number of EMTAB- 69 based on the Human Genome 133 plus 2.0 arrays (Brynedal et al., 2010). Accordingly, this study consisted of 26 multiple sclerosis patients, of whom 12 and 14 patients were sampled during relapse and remission, respectively. The MS patients were selected from a large cohort of newly diagnosed MS patients, and none of the patients had ever received immunomodulatory drugs. Control population included 18 subjects with other neurological diseases to assess MS specific transcriptome. The microarray raw data were converted to gene expression values using the RMA algorithm by the affy package within R software (Gautier et al., 2004). After preprocessing, each expression profile containing 54, 675 probe sets that ones with less discriminative power were removed according to the measurement of overall variance by the varFilter function using the genefilter package from the Bioconductor project within R software (Gentleman et al., 2011). After the preprocessing, a total of 27,336 probe sets from each sample were used for further analysis. To identify differential expression of the selected probes, the limma package in R software was used to perform the moderatedt-test (Smyth, 2005). Where a gene had more than one probe on the microarray, the average expression value of all the related probes was used to estimate expression level of the gene.
Interactome data
The human PPI network was gathered from four major IMEx (Orchard et al., 2007) public databases: IntAct (Kerrien et al., 2012), MINT (Ceol et al., 2010), DIP (Xenarios et al., 2002) and InnateDB (Lynn et al., 2008). Indeed, public PPI databases which only stored experimentally verified interactions used to eliminate possible spurious interactions and avoid misleading conclusions. Our recent study showed IMEx databases (especially IntAct and DIP databases) had a greater number of significant correlations for their proteins’ topological features than the all other paired comparisons between BIND, HPRD, MINT, IntAct and DIP databases (Safari-Alighiarloo, Taghizadeh & Rezaei-Tavirani, 2015).
QQPPI networks construction and topological analysis
interactions among them. The subnetworks of QQPPI were constructed and visualized by Cytoscape software (Shannon et al., 2003). Centrality parameters of QQPPI networks were analyzed using the Cytoscape and CentiBin softwares (Junker, Koschützki & Schreiber, 2006). The following parameters were calculated to determine biologically significant nodes (Zhang, 2009). Degree: the number of links to a given node. The Betweenness centrality of nodev is calculated as:
CB(v)=
X
s6=t6=v∈V
ρst(v)
ρst , (1)
where the number of all shortest paths between node sandt regarded asρst, and the number of shortest paths which passing through a nodev out ofρst regarded asρst(v).
Indeed, this formula represents the ratio of the number of shortest paths passing through nodevto the number of all shortest paths betweensandt. The current flow betweenness centrality of a nodevis the average of the current flow over all source–target pairs. Closeness centrality is defined as the reciprocal of the total distance from a nodev, to all other nodes. Therefore, high values of closeness should indicate that all other nodes are in proximity to nodev.
CC(v)=
1
P
u∈vdis(u,v)
. (2)
The centroid value is the most complex node centrality index and is computed by focusing the calculus on couples of nodes (v,w). The centroid value of an individual node ‘v’ is calculated by considering the number of nodes that have minimum shortest path which are closer to ‘v’ than ‘w’. A nodev with the highest centroid value is the node with the highest number of neighbors separated by the shortest path tov,
Ccen(v)=min(f(v,w)), (3) wheref(v,w)=yv(w)−yw(v) andyv(w) denotes the number of nodes that are closer to
v thanw. Eigen vector centrality assign the relative significance of all nodes in the network by weighting connections to highly important nodes more than connections to nodes of low importance.
λCIV=ACIV, (4)
whereCIV donates the Eigen vector andλdonates the Eigen value.
Hub and bottleneck nodes were extracted from the networks in two steps; (1) In the networks, nodes with degree greater than or equal to the sum of mean and twice the standard deviation (S.D.), i.e., mean+2*S.D. of the degree distribution, were considered as hubs (Ray, Ruan & Zhang, 2008).(2)We defined bottlenecks as the proteins that were in the top 5% in terms of betweenness centrality.
Identification and annotation of functional modules
with possible overlap (Nepusz, Yu & Paccanaro, 2012). The modules were identified to have a minimum density of >0.05 and a degree of >5. A cluster with ap-value of <0.05 was determined to be a module. The functional meaning for identified modules was further explored, and they considered as candidate functional modules if their genes were significantly enriched in the biological process of Gene Ontology (GO) annotation or KEGG pathway.
Identification of complexes containing clique
CFinder software was applied to extract biologically meaningful protein complexes from the PPI networks (Adamcsek et al., 2006). CFinder (http://www.cfinder.org/) was downloaded and implemented locally. Cliques with 3 nodes and 4 nodes (3-cliques, 4-cliques) were identified in the QQPPI networks by this software. The cliques were searched against CORUM database (Ruepp et al., 2010) to find significant protein complexes. Then, all the proteins associated with a specific complex were identified using the in house algorithm. Complexes containing 3 or more query proteins, as a cut-off, were listed in this study.
Functional enrichment analysis
An enrichment analysis was performed using Functional Annotation Chart in DAVID bioinformatics. To determine functional modules, only the enriched GO terms and pathways with p-values < 0.05 were considered significant. Furthermore, Cytoscape Enrichment Map plugin was used to visualize significant terms enriched in entire networks by following parameters:p-value cut-off=0.001,q-value cut-off=0.05, overlap coefficient cut-off=0.6 (Merico et al., 2010).
RESULTS
Expression analysis
We used the Limma package to analyze gene expression profile, E-MTAB-69, for comparison of four transcriptomes in MS (CSF: MSvs. controls and relapsevs. remission, PBMCs: MSvs. controls and relapsevs. remission). There were 3,062 genes with FDR < 0.05 whose expression was different in the CSF of MS patients as compared to the controls, but none in the respective PBMCs comparison. The number of up and down regulated genes was 1,080 and 1,982, respectively. On the contrary, when MS patients in relapse to those in remissions were compared, 1,163 differential expression genes with FDR≤0.1 were seen in PBMCs, but none in the CSF. The number of up and down regulated genes was 301 and 762, respectively. The full lists of annotated differentially expressed probe sets are shown inTable S1for the MSvs. control comparison in CSF cells, and inTable S2for the relapse versus remission in PBMCs cells.
Networks’ topological analysis
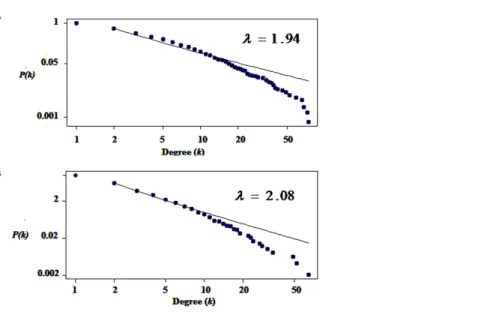
Figure 1 The degree distribution of nodes followed power law distribution.(A) Degree distribution of differentially expressed genes in CSF QQPPI network. (B) PBMCs QQPPI network. The graph represents a decreasing trend of degree distribution with an increase in the number of links showing scale-free topol-ogy.
Table 1 Hub-bottleneck identification.Cut-off determination for hubs & number of hubs and bottle-necks.
Mean (M) Standard Devi-ation (S.D)
Cut-off (M+2*S.D)
Number of hubs
Number of bottle-necks
CSF 4.86 7.3 19.4 56 72
PBMCs 3.89 6.06 16.01 20 25
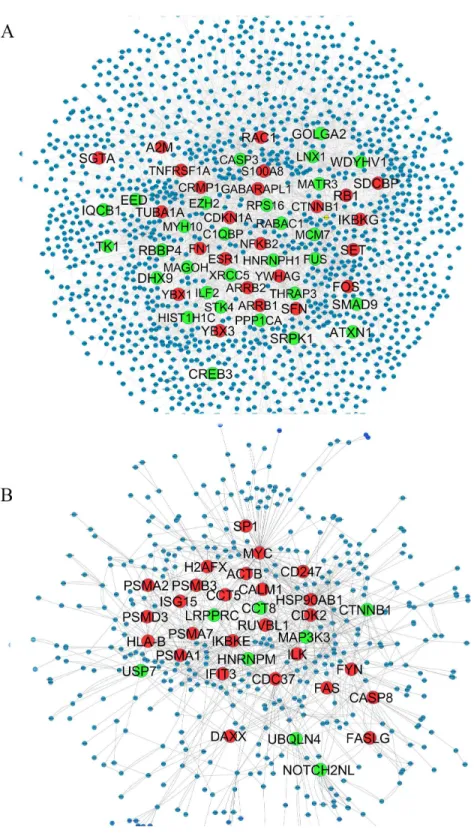
distribution is one of most important criteria (Maslov & Sneppen, 2002; Zhu, Gerstein & Snyder, 2007). The distribution of node degree approximately followed power law distributions, whereP(k) is a distribution of node degree,k is a degree andλis a degree exponent, withλ=1.94 and λ=2.08 for CSF and PBMCs networks, respectively, and Fig. 1indicates that the QQPPI networks were scale-free. The hubs and bottlenecks were extracted from the QQPPI networks by the criterion described in the method section (Table 1). Besides, we calculated four others centrality measurements involving closeness centrality, centroid value, Eigen vector centrality and current flow betweenness centrality and identified more central genes in the networks. The list of all nodes and their centrality measurements are prepared inTables S3andS4for CSF and PBMCs in which candidate markers have been highlighted. The graphical structure of CSF and PBMCs PPI networks containing 5% top central genes are represented inFig. 2.
Modularity analysis
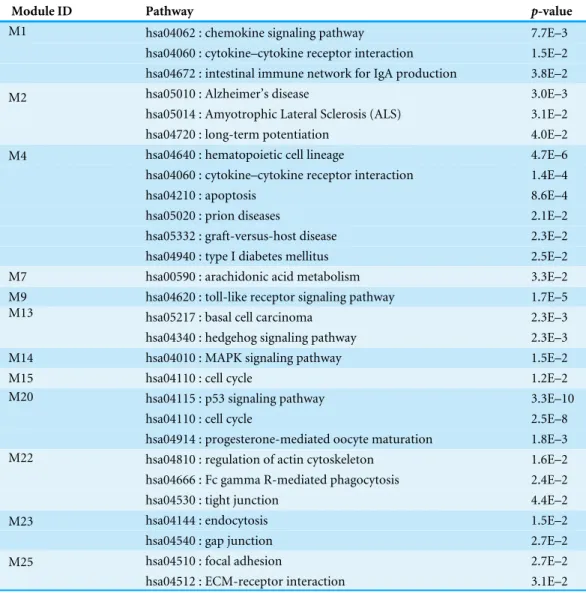
Table 2 Modularity analysis.The list of pathways enriched in modules for CSF (MSvs.controls).
Module ID Pathway p-value
hsa04062 : chemokine signaling pathway 7.7E–3 hsa04060 : cytokine–cytokine receptor interaction 1.5E–2 M1
hsa04672 : intestinal immune network for IgA production 3.8E–2 hsa05010 : Alzheimer’s disease 3.0E–3 hsa05014 : Amyotrophic Lateral Sclerosis (ALS) 3.1E–2 M2
hsa04720 : long-term potentiation 4.0E–2 hsa04640 : hematopoietic cell lineage 4.7E–6 hsa04060 : cytokine–cytokine receptor interaction 1.4E–4
hsa04210 : apoptosis 8.6E–4
hsa05020 : prion diseases 2.1E–2 hsa05332 : graft-versus-host disease 2.3E–2 M4
hsa04940 : type I diabetes mellitus 2.5E–2 M7 hsa00590 : arachidonic acid metabolism 3.3E–2 M9 hsa04620 : toll-like receptor signaling pathway 1.7E–5 hsa05217 : basal cell carcinoma 2.3E–3 M13
hsa04340 : hedgehog signaling pathway 2.3E–3 M14 hsa04010 : MAPK signaling pathway 1.5E–2
M15 hsa04110 : cell cycle 1.2E–2
hsa04115 : p53 signaling pathway 3.3E–10
hsa04110 : cell cycle 2.5E–8
M20
hsa04914 : progesterone-mediated oocyte maturation 1.8E–3 hsa04810 : regulation of actin cytoskeleton 1.6E–2 hsa04666 : Fc gamma R-mediated phagocytosis 2.4E–2 M22
hsa04530 : tight junction 4.4E–2
hsa04144 : endocytosis 1.5E–2
M23
hsa04540 : gap junction 2.7E–2
hsa04510 : focal adhesion 2.7E–2 M25
hsa04512 : ECM-receptor interaction 3.1E–2
CSF and PBMCs (p-value < 0.05), respectively. In the case of CSF, enriched modules were relevant to the comparison of MS versus controls in which modules correlated remarkably with many immune-related pathways such as, cytokine–cytokine receptor interaction, chemokine signaling pathway, Toll-like receptor signaling pathway, T cell receptor signaling pathway and Hematopoietic cell lineage. Further to them, some modules were enriched for apoptosis, p53 signaling pathway, MAPK signaling pathway, Hedgehog signaling pathway and Fc gamma R-mediated phagocytosis. The other major enriched pathways in modules included focal adhesion, cell cycle, endocytosis, gap junction, tight junction, ECM-receptor interaction, regulation of actin cytoskeleton (Table 2).
Table 3 Modularity analysis.The list of pathways enriched in modules for PBMCs (relapsevs. remis-sion).
Module ID Pathway p-value
hsa04612 : antigen processing and presentation 6.6E–8 hsa05340 : primary immunodeficiency 2.7E–2 hsa05332 : graft-versus-host disease 3.0E–2 M1
hsa02010 : ABC transporters 3.4E–2 hsa04115 : p53 signaling pathway 3.5E–3 M7
hsa04110 : cell cycle 1.2E–2
hsa04623 : cytosolic DNA-sensing pathway 2.5E–4 hsa04622 : RIG-I-like receptor signaling pathway 5.2E–4 M8
hsa04620 : toll-like receptor signaling pathway 1.5E–3 M9 hsa04120 : ubiquitin mediated proteolysis 2.3E–2
M10 hsa03050 : proteasome 1.3E–9
hsa03040 : spliceosome 1.0E–3
M11
hsa04350 :TGF-beta signaling pathway 4.1E–2
pathway. TGF-beta signaling pathway and p53 signaling pathway were the two noticeable signaling pathways in modules. The last enriched pathways were spliceosome, proteasome, ubiquitin mediated proteolysis and cell cycle (Table 3).
Identification of cliques and complexes
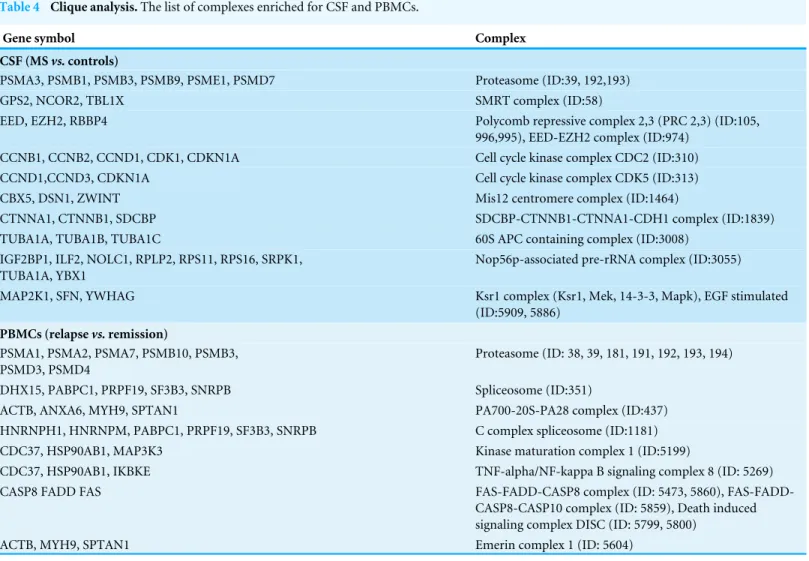
CFinder software was implemented to identify several 3-cliques and 4-cliques in the QQPPI networks. The corresponding complexes were retrieved from the CORUM database and shown in Table 4. In the case of CSF (MSvs.controls), these complexes mediated various biological functions such as protein processing (proteolytic), proteasomal degradation, stress response, protein binding, protease activator (ID: 32, 192 and 193), DNA conformation modification, transcription repression, protein modification by acetylation, deacetylation (ID:58), DNA conformation modification, transcription repression and posttranscriptional control (ID:105, 995,996 and 974), mitotic cell cycle and protein modification (ID:310 and 313), chromosome segregation/division (ID:1464), cell junction (ID:1839), actin cytoskeleton organization and biogenesis (ID:3008), ribosome biogenesis (ID:3055), protein modification and cellular signaling (MAPKKK cascade (ID:5909 and 5886).
For PBMCs (relapsevs.remission), the identified complexes involved in many biological processes like protein processing (proteolytic), proteasomal degradation, stress response, protein binding, protease activator (ID: 38, 39, 181, 191, 192, 193, 194), RNA processing and RNA binding (ID: 351 and ID: 1181), protein targeting, sorting and translocation, protein transport and homeostasis (ID:437), protein kinase (ID:5199), NIK-I-kappaB/NF-kappaB cascade and cytokine activity (ID: 5269), apoptosis (ID: 5473, 5860, 5859, 5799 and 5800).
Functional enrichment analysis of the networks
Table 4 Clique analysis.The list of complexes enriched for CSF and PBMCs.
Gene symbol Complex
CSF (MSvs.controls)
PSMA3, PSMB1, PSMB3, PSMB9, PSME1, PSMD7 Proteasome (ID:39, 192,193)
GPS2, NCOR2, TBL1X SMRT complex (ID:58)
EED, EZH2, RBBP4 Polycomb repressive complex 2,3 (PRC 2,3) (ID:105, 996,995), EED-EZH2 complex (ID:974)
CCNB1, CCNB2, CCND1, CDK1, CDKN1A Cell cycle kinase complex CDC2 (ID:310) CCND1,CCND3, CDKN1A Cell cycle kinase complex CDK5 (ID:313) CBX5, DSN1, ZWINT Mis12 centromere complex (ID:1464)
CTNNA1, CTNNB1, SDCBP SDCBP-CTNNB1-CTNNA1-CDH1 complex (ID:1839) TUBA1A, TUBA1B, TUBA1C 60S APC containing complex (ID:3008)
IGF2BP1, ILF2, NOLC1, RPLP2, RPS11, RPS16, SRPK1, TUBA1A, YBX1
Nop56p-associated pre-rRNA complex (ID:3055)
MAP2K1, SFN, YWHAG Ksr1 complex (Ksr1, Mek, 14-3-3, Mapk), EGF stimulated (ID:5909, 5886)
PBMCs (relapsevs.remission)
PSMA1, PSMA2, PSMA7, PSMB10, PSMB3, PSMD3, PSMD4
Proteasome (ID: 38, 39, 181, 191, 192, 193, 194)
DHX15, PABPC1, PRPF19, SF3B3, SNRPB Spliceosome (ID:351)
ACTB, ANXA6, MYH9, SPTAN1 PA700-20S-PA28 complex (ID:437) HNRNPH1, HNRNPM, PABPC1, PRPF19, SF3B3, SNRPB C complex spliceosome (ID:1181) CDC37, HSP90AB1, MAP3K3 Kinase maturation complex 1 (ID:5199)
CDC37, HSP90AB1, IKBKE TNF-alpha/NF-kappa B signaling complex 8 (ID: 5269) CASP8 FADD FAS CASP8 complex (ID: 5473, 5860),
FAS-FADD-CASP8-CASP10 complex (ID: 5859), Death induced signaling complex DISC (ID: 5799, 5800)
ACTB, MYH9, SPTAN1 Emerin complex 1 (ID: 5604)
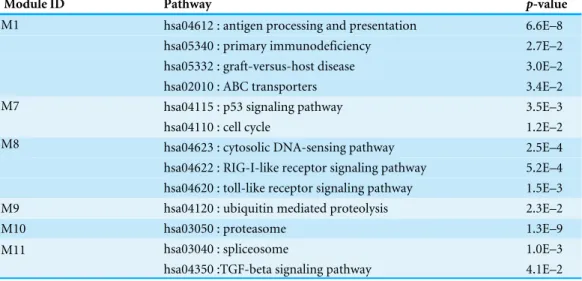
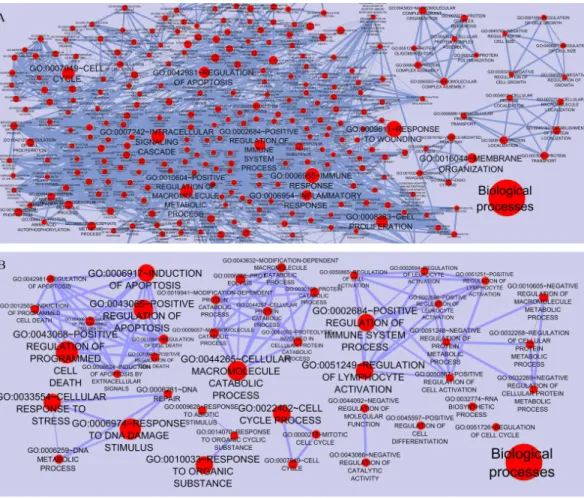
Figure 3 Functional categories of the networks were visualized using the Enrichment map plugin of the Cytoscape.Significant biological processes are represented by one node in (A) CSF QQPPI network. (B) PBMCs QQPPI network. Nodes’ sizes indicate the significance of the enrichment (p-value). Edges show gene overlap between nodes and thickness indicates the number of overlapping enriched genes.
Mining and identification disease markers in modules and complexes
Table 5 Central genes.The list of more central genes enriched in functional modules and complexes for CSF and PBMCs.
Module/complex ID Gene symbol
CSF(MSvs.controls)
M13 SMAD1
M14 STK4
M15 RB1
M20 CDKN1A, CDK1
M22 RAC1
M23 ARRB2, ARRB1
M25 FN1
ID:39, 192,193 PSMA3
ID:105, 974,996,995 EED, EZH2, RBBP4
ID:310,313 CDK1, CDKN1A
ID:1839 CTNNB1, SDCBP
ID:3008 TUBA1A
ID:3055 SRPK1, YBX1, ILF2, RPS16
ID:5909, 5886 SFN, YWHAG
PBMCs (relapsevs.remission)
M7 CDK2
M8 IKBKE
M10 PSMA1
M11 MYC
ID: 38, 39, 181, 191, 192, 193, 194 PSMA1, PSMA2, PSMA7, PSMB3, PSMD3
ID:1181 HNRNPM
ID:437,5604 ACTB
ID:5199, 5269 CDC37, HSP90AB1, MAP3K3, IKBKE ID: 5473, 5860, 5859, 5799, 5800 CASP8,FAS
which have functional importance because of their involvement in functional modules and complexes, they called as candidate disease markers in our study.
DISCUSSION
Although myriad genetic studies investigate the MS pathogenesis, our understanding have remained incomplete about the exact mechanism and its genetics (Baranzini et al., 2009;
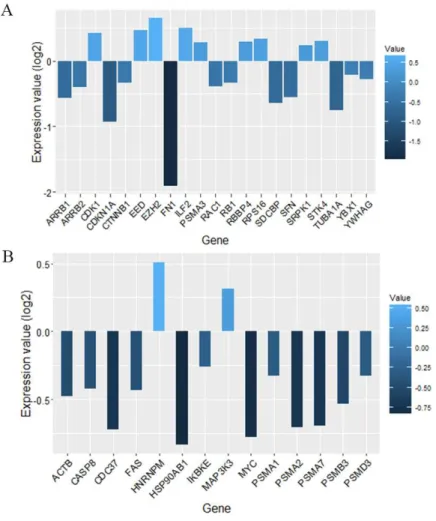
Figure 4 Nodes with high centrality measures which involved in significant biological pathways and their expression values.More central nodes in (A) CSF QQPPI network. (B) PBMCs QQPPI network.
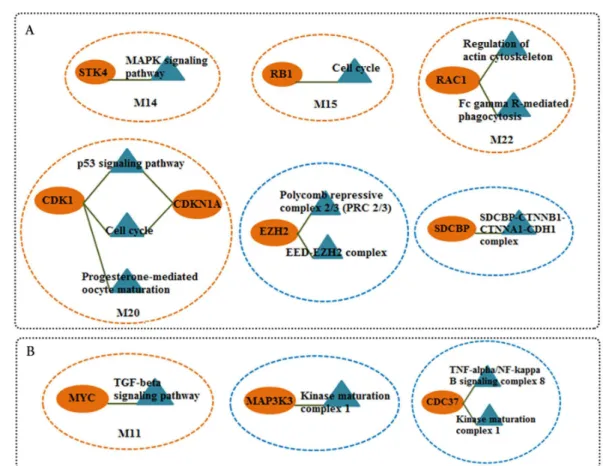
Figure 5 Candidate markers involved in functional modules and complexes.The functional enrich-ment of candidate markers in (A) CSF QQPPI network. (B) PBMCs QQPPI network. Modules and com-plexes illustrated by brown and blue dotted circles, respectively.
proteasome has crucial role in cell cycle progression and immune response (Basler et al., 2015). The immunoproteasome is a cytokine-induced variant of the 20S proteasome, which involved in the pathogenesis of autoimmune diseases and in the modulation of T helper cell differentiation (Basler, Kirk & Groettrup, 2013). Inhibition of the immunoproteasome subunit LMP7 (β5i) in animal models for autoimmune diseases including MS protected against these diseases (Basler et al., 2014). Spliceosome as basic machinery splicing, only enriched in relapse phase of MS in PBMCs. There is evidence to delineate the important role of alternative splicing in autoimmunity (Evsyukova et al., 2010).
results indicated that Mst1 regarded as a critical regulator of adaptive immune responses, Th1/Th2-dependent cytokine production and as a potential therapeutic target for immune disorders (Salojin et al., 2014). The second marker, RB transcriptional corepressor 1 (RB1) participated in cell cycle pathway (M7) and was downregulated. This gene is a negative regulator of the cell cycle, and acts as a transcriptional regulator (Indovina et al., 2013). It has been reported that Rb-mediated gene expression repression of E2F2 (transcription factor 2), by acting to tether Rb to specific E2F promoter sites, was crucial in T cells, and mutation of E2F2 in mice resulted in enhanced T lymphocyte proliferation leading to the development of autoimmunity (Murga et al., 2001). The third marker, cyclin-dependent kinase inhibitor 1A (CDKN1A) also named p21, was enriched in p53 signaling pathway, cell cycle (M20), and it was downregulated. The evidence exists for the p21 as a cell-cycle inhibitor that suppressed autoimmunity (Trakala et al., 2009). Indeed, recent studies disclosed that p21 as a specific regulator of the homeostasis of memory/activated T lymphocytes (Arias et al., 2007). The fourth marker, cyclin-dependent kinase 1 (CDK1) was enriched in p53 signaling pathway, cell cycle and progesterone-mediated oocyte maturation pathway (M20), and it was upregulated. The study of Yoshida et al. (2013)
such as SDCBP. They results indicated that miR-155_/_ mice showed lower levels of blood–brain barrier leakage in experimental autoimmune encephalomyelitis and an acute model of systemic inflammation (Lopez-Ramirez et al., 2014).
In case of PBMCs, the candidate markers corresponded to the comparison of relapse versus remission. The first candidate marker was cell division cycle 37 (CDC37). It was incorporated in complex TNF-alpha/NF-kappa B signaling complex 8 and downregulated. CDC37 and HSP90 is a member of IKK complex that disruption of the interaction between CDC37/HSP90 and IKK complexes impaired the activation of IKK and NF-κB in a TNF-dependent manner (Chen, Cao & Goeddel, 2002;Chen & Goeddel, 2002). NF-κB acts as a central mediator of immune and inflammatory responses, and it is involved in regulation of cell proliferation and apoptosis (Oeckinghaus & Ghosh, 2009). In this line, some studies disclosed that apoptosis was suppressed during acute relapse and this issue may lead to prolonged survival of autoreactive T cells (Achiron et al., 2007;Achiron et al., 2004). Downregulation of CDC37 could be remarkable issue during relapse stage with apoptosis suppression for further studies. The second marker, mitogen-activated protein kinase 3 (MAP3K3) involved in Kinase maturation complex 1, and it was upregulate. It is a member of MAPKs which implicated in all aspects of immune responses, from the initiation phase of innate immunity to activation of adaptive immunity (Dong, Davis & Flavell, 2002). The last marker, v-myc avian myelocytomatosis viral oncogene homolog (MYC) incorporated in TGF-beta signaling pathway (M11), and it was downregulated.
Achiron et al. (2004)study showed that all components of the TGF-beta signaling pathway were underexpressed during MS pathogenesis. Since this pathway is known to prohibit cell proliferation and increase susceptibility to apoptosis induced by TGF-beta, their underexpression may be relevant to autoreactive T-cell expansion in MS patients.
CONCLUSIONS
This study showed the necessity of network-based analysis to get more insights in MS pathogenesis at post-genomic era. In summary, QQPPI networks of abnormally expressed genes in paired CSF (MSvs.control) and PBMCs (relapsevs. remission) samples were constructed for MS, and centrality, modularity and clique analyses have been implemented. Our results indicated that genes with high centrality in the networks incorporated into the main biological processes in MS progression at CSF and PBMCs. Furthermore, we identified several candidate genes via the systems biology viewpoint which might facilitate the identification of potential targets for the treatment of MS.
ADDITIONAL INFORMATION AND DECLARATIONS
Funding
The authors received no funding for this work.
Competing Interests
Author Contributions
• Nahid Safari-Alighiarloo conceived and designed the experiments, performed the experiments, analyzed the data, wrote the paper, prepared figures and/or tables.
• Mostafa Rezaei-Tavirani and Mohammad Taghizadeh conceived and designed the experiments, contributed reagents/materials/analysis tools, reviewed drafts of the paper. • Seyyed Mohammad Tabatabaei performed the experiments.
• Saeed Namaki conceived and designed the experiments.
Data Availability
The following information was supplied regarding data availability: The raw data has been supplied as aSupplemental File.
Supplemental Information
Supplemental information for this article can be found online athttp://dx.doi.org/10.7717/ peerj.2775#supplemental-information.
REFERENCES
Achiron A, Feldman A, Mandel M, Gurevich M. 2007.Impaired expression of peripheral blood apoptotic-related gene transcripts in acute multiple sclerosis relapse.Annals of the New York Academy of Sciences1107:155–167DOI 10.1196/annals.1381.017. Achiron A, Gurevich M, Friedman N, Kaminski N, Mandel M. 2004.Blood
transcrip-tional signatures of multiple sclerosis: unique gene expression of disease activity.
Annals of Neurology55:410–417DOI 10.1002/ana.20008.
Adamcsek B, Palla G, Farkas IJ, Derényi I, Vicsek T. 2006.CFinder: locating cliques and overlapping modules in biological networks.Bioinformatics22:1021–1023 DOI 10.1093/bioinformatics/btl039.
Arias CF, Ballesteros-Tato A, García MI, Martín-Caballero J, Flores JM, Martínez-A C, Balomenos D. 2007.p21CIP1/WAF1 controls proliferation of activated/memory T cells and affects homeostasis and memory T cell responses.The Journal of Immunol-ogy178:2296–2306DOI 10.4049/jimmunol.178.4.2296.
Bapat SA, Krishnan A, Ghanate AD, Kusumbe AP, Kalra RS. 2010.Gene expres-sion: protein interaction systems network modeling identifies transformation-associated molecules and pathways in ovarian cancer.Cancer Research70:4809–4819 DOI 10.1158/0008-5472.CAN-10-0447.
Baranzini SE, Galwey NW, Wang J, Khankhanian P, Lindberg R, Pelletier D, Wu W, Uitdehaag BM, Kappos L, Polman CH. 2009.Pathway and network-based analysis of genome-wide association studies in multiple sclerosis.Human Molecular Genetics
18:2078–2090DOI 10.1093/hmg/ddp120.
Basler M, Kirk CJ, Groettrup M. 2013.The immunoproteasome in antigen processing and other immunological functions.Current Opinion in Immunology 25:74–80 DOI 10.1016/j.coi.2012.11.004.
Basler M, Mundt S, Bitzer A, Schmidt C, Groettrup M. 2015.The immunoproteasome: a novel drug target for autoimmune diseases.Clinical and Experimental Rheumatology
Basler M, Mundt S, Muchamuel T, Moll C, Jiang J, Groettrup M, Kirk CJ. 2014. Inhibition of the immunoproteasome ameliorates experimental autoimmune encephalomyelitis.EMBO Molecular Medicine6:226–238.
Beekman JM, Coffer PJ. 2008.The ins and outs of syntenin, a multifunctional intracellu-lar adaptor protein.Journal of Cell Science121:1349–1355DOI 10.1242/jcs.026401. Bomprezzi R, Ringnér M, Kim S, Bittner ML, Khan J, Chen Y, Elkahloun A, Yu A,
Bielekova B, Meltzer PS. 2003.Gene expression profile in multiple sclerosis patients and healthy controls: identifying pathways relevant to disease.Human Molecular Genetics12:2191–2199DOI 10.1093/hmg/ddg221.
Brynedal B, Khademi M, Wallström E, Hillert J, Olsson T, Duvefelt K. 2010.Gene expression profiling in multiple sclerosis: a disease of the central nervous system, but with relapses triggered in the periphery?Neurobiology of Disease37:613–621 DOI 10.1016/j.nbd.2009.11.014.
Ceol A, Aryamontri AC, Licata L, Peluso D, Briganti L, Perfetto L, Castagnoli L, Cesareni G. 2010.MINT, the molecular interaction database: 2009 update.Nucleic Acids Research38:D532–D539.
Chen G, Cao P, Goeddel DV. 2002.TNF-induced recruitment and activation of the IKK complex require Cdc37 and Hsp90.Molecular Cell9:401–410 DOI 10.1016/S1097-2765(02)00450-1.
Chen G, Goeddel DV. 2002.TNF-R1 signaling: a beautiful pathway.Science
296:1634–1635DOI 10.1126/science.1071924.
Christensen JR, Börnsen L, Hesse D, Krakauer M, Sørensen PS, Søndergaard HB, Selle-bjerg F. 2012.Cellular sources of dysregulated cytokines in relapsing-remitting mul-tiple sclerosis.Journal of Neuroinflammation9:1–12DOI 10.1186/1742-2094-9-215. D’Ambrosi N, Rossi S, Gerbino V, Cozzolino M. 2014.Rac1 at the crossroad of actin
dynamics and neuroinflammation in Amyotrophic Lateral Sclerosis.Frontiers in Cellular Neuroscience8:279.
Dong C, Davis RJ, Flavell RA. 2002.MAP kinases in the immune response.Annual Review of Immunology20:55–72DOI 10.1146/annurev.immunol.20.091301.131133. Ebers GC. 2008.Environmental factors and multiple sclerosis.The Lancet Neurology
7:268–277DOI 10.1016/S1474-4422(08)70042-5.
Evsyukova I, Somarelli JA, Gregory SG, Garcia-Blanco MA. 2010.Alternative splicing in multiple sclerosis and other autoimmune diseases.RNA Biology7:462–473 DOI 10.4161/rna.7.4.12301.
Gautier L, Cope L, Bolstad BM, Irizarry RA. 2004.affy—analysis of Affymetrix GeneChip data at the probe level.Bioinformatics20:307–315
DOI 10.1093/bioinformatics/btg405.
Gentleman R, Carey V, Huber W, Hahne F. 2011.Genefilter: methods for filtering genes from microarray experiments. R package version 1.Available athttp:// www. bioconductor.org/ packages/ 2.6/ bioc/ html/ genefilter.html.
Hindumathi V, Kranthi T, Rao S, Manimaran P. 2014.The prediction of candidate genes for cervix related cancer through gene ontology and graph theoretical approach.Molecular BioSystems10:1450–1460DOI 10.1039/c4mb00004h. Huang DW, Sherman BT, Lempicki RA. 2008.Systematic and integrative analysis of
large gene lists using DAVID bioinformatics resources.Nature Protocols4:44–57 DOI 10.1038/nprot.2008.211.
Huang K-C, Yang K-C, Lin H, Tsun-Hui TT, Lee W-K, Lee S-A, Kao C-Y. 2013.Analysis of schizophrenia and hepatocellular carcinoma genetic network with corresponding modularity and pathways: novel insights to the immune system.BMC Genomics
14:S10 DOI 10.1186/1471-2164-14-S5-S10.
Indovina P, Marcelli E, Casini N, Rizzo V, Giordano A. 2013.Emerging roles of RB family: new defense mechanisms against tumor progression.Journal of Cellular Physiology228:525–535DOI 10.1002/jcp.24170.
Junker BH, Koschützki D, Schreiber F. 2006.Exploration of biological network centralities with CentiBiN.BMC Bioinformatics7:1DOI 10.1186/1471-2105-7-1. Kebir H, Ifergan I, Alvarez JI, Bernard M, Poirier J, Arbour N, Duquette P, Prat A.
2009.Preferential recruitment of interferon-γ–expressing TH17 cells in multiple sclerosis.Annals of Neurology66:390–402DOI 10.1002/ana.21748.
Kerrien S, Aranda B, Breuza L, Bridge A, Broackes-Carter F, Chen C, Duesbury M, Dumousseau M, Feuermann M, Hinz U. 2012.The IntAct molecular interaction database in 2012.Nucleic Acids Research40:D841–D846.
Kim Y-A, Wuchty S, Przytycka TM. 2011.Identifying causal genes and dysregulated pathways in complex diseases.PLOS Computational Biology7:e1001095
DOI 10.1371/journal.pcbi.1001095.
Lee S-A, Tsao TT, Yang K-C, Lin H, Kuo Y-L, Hsu H, Lee W-K, Huang K-C, Kao C-Y. 2011.Construction and analysis of the protein–protein interaction networks for schizophrenia, bipolar disorder, and major depression.BMC Bioinformatics12:S20 DOI 10.1186/1471-2105-12-S13-S20.
Li J, Jiang D. 2015.The role of epigenomics in the neurodegeneration of ataxia-telangiectasia.Epigenomics7:137–141DOI 10.2217/epi.14.81.
Li M, Wu X, Wang J, Pan Y. 2012.Towards the identification of protein complexes and functional modules by integrating PPI network and gene expression data.BMC Bioinformatics13:109DOI 10.1186/1471-2105-13-109.
Lopez-Ramirez MA, Wu D, Pryce G, Simpson JE, Reijerkerk A, King-Robson J, Kay O, De Vries HE, Hirst MC, Sharrack B. 2014.MicroRNA-155 negatively affects blood– brain barrier function during neuroinflammation.The FASEB Journal 28:2551–2565 DOI 10.1096/fj.13-248880.
Lynn DJ, Winsor GL, Chan C, Richard N, Laird MR, Barsky A, Gardy JL, Roche FM, Chan TH, Shah N. 2008.InnateDB: facilitating systems-level analyses of the mammalian innate immune response.Molecular Systems Biology 4:218.
Maslov S, Sneppen K. 2002.Specificity and stability in topology of protein networks.
Science296:910–913DOI 10.1126/science.1065103.
Merico D, Isserlin R, Stueker O, Emili A, Bader GD. 2010.Enrichment map: a network-based method for gene-set enrichment visualization and interpretation.PLOS ONE
5:e13984DOI 10.1371/journal.pone.0013984.
Murga M, Fernández-Capetillo O, Field SJ, Moreno B, Luis R, Fujiwara Y, Balomenos D, Vicario A, Carrera AC, Orkin SH. 2001.Mutation of E2F2 in mice causes enhanced T lymphocyte proliferation, leading to the development of autoimmunity.
Immunity 15:959–970DOI 10.1016/S1074-7613(01)00254-0.
Nepusz T, Yu H, Paccanaro A. 2012.Detecting overlapping protein complexes in protein–protein interaction networks.Nature Methods9:471–472
DOI 10.1038/nmeth.1938.
Oeckinghaus A, Ghosh S. 2009.The NF-κB family of transcription factors and its regulation.Cold Spring Harbor Perspectives in Biology1:a000034
DOI 10.1101/cshperspect.a000034.
Orchard S, Kerrien S, Jones P, Ceol A, Chatr-aryamontri A, Salwinski L, Nerothin J, Hermjakob H. 2007.Submit your interaction data the IMEx way.Proteomics
7:28–34DOI 10.1002/pmic.200700286.
Ray M, Ruan J, Zhang W. 2008.Variations in the transcriptome of Alzheimer’s disease reveal molecular networks involved in cardiovascular diseases.Genome Biology
9(10):R148DOI 10.1186/gb-2008-9-10-r148.
Rezaei-Tavirani M, Zamanian-Azodi M, Rajabi S, Masoudi-Nejad A, Rostami-Nejad M, Rahmatirad S. 2016.Protein clustering and interactome analysis in Parkinson and Alzheimer’s diseases.Archives of Iranian Medicine19(2):101–109.
Ruepp A, Waegele B, Lechner M, Brauner B, Dunger-Kaltenbach I, Fobo G, Frishman G, Montrone C, Mewes H-W. 2010.CORUM: the comprehensive resource of mammalian protein complexes—2009.Nucleic Acids Research38:D497–D501 DOI 10.1093/nar/gkp914.
Safari-Alighiarloo N, Taghizadeh M, Rezaei-Tavirani M. 2015.Cytoscape retrieved protein–protein interaction (PPI) networks: seeking the correlation of human pro-teins’topological features between major public PPI databases due to their medical importance.International Journal of Analytical, Pharmaceutical and Biomedical Sciences4:137–146.
Safari-Alighiarloo N, Taghizadeh M, Rezaei-Tavirani M, Goliaei B, Peyvandi AA. 2014. protein–protein interaction networks (PPI) and complex diseases.Gastroenterology and Hepatology from Bed to Bench7:9–16.
Safari-Alighiarloo N, Taghizadeh M, Tabatabaei SM, Shahsavari S, Namaki S, Kho-dakarim S, Rezaei-Tavirani M. 2016.Identification of new key genes for type 1 diabetes through construction and analysis of the protein–protein interaction networks based on blood and pancreatic islet transcriptomes.Journal of Diabetes
Epub ahead of print Nov 21 2016.
cell function and protects against autoimmunity.PLOS ONE9:e98151 DOI 10.1371/journal.pone.0098151.
Shannon P, Markiel A, Ozier O, Baliga NS, Wang JT, Ramage D, Amin N, Schwikowski B, Ideker T. 2003.Cytoscape: a software environment for integrated models of biomolecular interaction networks.Genome Research13:2498–2504
DOI 10.1101/gr.1239303.
Sharma A, Gulbahce N, Pevzner SJ, Menche J, Ladenvall C, Folkersen L, Eriksson P, Orho-Melander M, Barabási A-L. 2013.Network-based analysis of genome wide association data provides novel candidate genes for lipid and lipoprotein traits.
Molecular & Cellular Proteomics12:3398–3408DOI 10.1074/mcp.M112.024851. Singh M, Scott T, LaFramboise W, Hu F, Post J, Ehrlich G. 2007.Gene expression
changes in peripheral blood mononuclear cells from multiple sclerosis patients undergoingβ-interferon therapy.Journal of the Neurological Sciences258:52–59 DOI 10.1016/j.jns.2007.02.034.
Smyth GK. 2005. Limma: linear models for microarray data. In:Bioinformatics and computational biology solutions using R and Bioconductor. Berlin Heidelberg: Springer, 397–420.
Svejgaard A. 2008.The immunogenetics of multiple sclerosis.Immunogenetics
60:275–286DOI 10.1007/s00251-008-0295-1.
Trakala M, Arias CF, García MI, Moreno-Ortiz MC, Tsilingiri K, Fernández PJ, Mellado M, Díaz-Meco MT, Moscat J, Serrano M. 2009.Regulation of macrophage activation and septic shock susceptibility via p21 (WAF1/CIP1).European Journal of Immunology39:810–819DOI 10.1002/eji.200838676.
Veroni C, Marnetto F, Granieri L, Bertolotto A, Ballerini C, Repice AM, Schirru L, Coghe G, Cocco E, Anastasiadou E. 2015.Immune and Epstein-Barr virus gene expression in cerebrospinal fluid and peripheral blood mononuclear cells from patients with relapsing-remitting multiple sclerosis.Journal of Neuroinflammation
12:132 DOI 10.1186/s12974-015-0353-1.
Wachi S, Yoneda K, Wu R. 2005.Interactome-transcriptome analysis reveals the high centrality of genes differentially expressed in lung cancer tissues.Bioinformatics
21:4205–4208DOI 10.1093/bioinformatics/bti688.
Wu J, Vallenius T, Ovaska K, Westermarck J, Mäkelä TP, Hautaniemi S. 2009. Inte-grated network analysis platform for protein–protein interactions.Nature Methods
6:75–77DOI 10.1038/nmeth.1282.
Xenarios I, Salwinski L, Duan XJ, Higney P, Kim S-M, Eisenberg D. 2002.DIP, the database of interacting proteins: a research tool for studying cellular networks of protein interactions.Nucleic Acids Research30:303–305DOI 10.1093/nar/30.1.303. Yoshida H, Kotani H, Kondo T, Tani I, Wei X, Tsuruta S, Kimura A, Asakawa M, Ito M,
Nagai S. 2013.CDK inhibitors suppress Th17 and promote iTreg differentiation, and ameliorate experimental autoimmune encephalomyelitis in mice.Biochemical and Biophysical Research Communications435:378–384DOI 10.1016/j.bbrc.2013.04.096. Yu H, Kim PM, Sprecher E, Trifonov V, Gerstein M. 2007.The importance of
Yu F-D, Yang S-Y, Li Y-Y, Hu W. 2013.Co-expression network with protein–protein interaction and transcription regulation in malaria parasite Plasmodium falciparum.
Gene518:7–16DOI 10.1016/j.gene.2012.11.092.
Zali H, Rezaei-Tavirani M. 2014.Meningioma protein–protein interaction network.
Archives of Iranian Medicine17:262–272.
Zhang A. 2009.Protein interaction networks: computational analysis. New York: Cam-bridge University Press.
Zhang F, Shi Y, Wang L, Sriram S. 2011.Role of HDAC3 on p53 expression and apoptosis in T cells of patients with multiple sclerosis.PLOS ONE6:e16795 DOI 10.1371/journal.pone.0016795.