Submitted23 January 2015 Accepted 22 December 2015 Published19 January 2016
Corresponding author Petter Thureborn, petter.thureborn@sh.se
Academic editor Irene Newton
Additional Information and Declarations can be found on page 19
DOI10.7717/peerj.1593
Copyright 2016 Thureborn et al.
Distributed under
Creative Commons CC-BY 4.0
OPEN ACCESS
Reconstructing ecosystem functions of
the active microbial community of the
Baltic Sea oxygen depleted sediments
Petter Thureborn1, Andrea Franzetti1,2, Daniel Lundin3,4and Sara Sjöling1
1School of Natural Sciences, Technology and Environmental Studies, Södertörn University, Huddinge,
Sweden
2Department of Earth and Environmental Sciences, University of Milano-Bicocca, Milano, Italy 3BILS, Bioinformatics Infrastructure for Life Sciences, Science for Life Laboratories, Solna, Sweden 4Centre for Ecology and Evolution in Microbial model Systems—EEMiS, Linnaeus University, Kalmar,
Sweden
ABSTRACT
Baltic Sea deep water and sediments hold one of the largest anthropogenically induced hypoxic areas in the world. High nutrient input and low water exchange result in eutrophication and oxygen depletion below the halocline. As a consequence at Landsort Deep, the deepest point of the Baltic Sea, anoxia in the sediments has been a persistent condition over the past decades. Given that microbial communities are drivers of es-sential ecosystem functions we investigated the microbial community metabolisms and functions of oxygen depleted Landsort Deep sediments by metatranscriptomics. Results show substantial expression of genes involved in protein metabolism demonstrating that the Landsort Deep sediment microbial community is active. Identified expressed gene suites of metabolic pathways with importance for carbon transformation including fermentation, dissimilatory sulphate reduction and methanogenesis were identified. The presence of transcripts for these metabolic processes suggests a potential for heterotrophic-autotrophic community synergism and indicates active mineralisation of the organic matter deposited at the sediment as a consequence of the eutrophication process. Furthermore, cyanobacteria, probably deposited from the water column, are transcriptionally active in the anoxic sediment at this depth. Results also reveal high abundance of transcripts encoding integron integrases. These results provide insight into the activity of the microbial community of the anoxic sediment at the deepest point of the Baltic Sea and its possible role in ecosystem functioning.
SubjectsEcology, Genomics, Marine Biology, Microbiology
Keywords Baltic Sea, Microbial functions, Eutrophication, Anoxic sediment, Oxygen depletion, Cyanobacteria, Integron integrase, Metatranscriptome, Methanogenesis, Methane oxidation
INTRODUCTION
the Baltic Proper, the central part of the Baltic Sea, a brackish water basin with limited water ventilation and high nutrient load from agricultural production, riverine input, and seasonal phytoplankton blooms (Conley et al., 2009). Microbial respiration of organic matter, e.g., from the phytoplankton blooms, effectively depletes dissolved oxygen below the halocline (Cederwall & Elmgren, 1990), resulting in hypoxic waters and anoxic sediments (Cederwall & Elmgren, 1990;Diaz & Rosenberg, 2008;HELCOM, 2009). Consequences of oxygen depletion are changes in the biogeochemical cycles of nutrients and ecosystem energy flows (Conley et al., 2009;Carstensen et al., 2014b), in which microbial populations have an essential function (Falkowski, Fenchel & Delong, 2008). Ultimately, severe oxygen deficiency will increase mortality of macro-benthic organisms, which leads to deterioration of benthic communities and fish habitat of the Baltic Sea ecosystem (Cederwall & Elmgren, 1990;Conley et al., 2009;Carstensen et al., 2014b). This results in what are called ‘dead zones’ (Diaz & Rosenberg, 2008) with both ecological and economic consequences (Elmgren, 2012; Ahtiainen et al., 2014).
The euxinic conditions are especially pronounced at the highly stratified Landsort Deep that stretches into the deepest point (466 m) of the Baltic Sea. At depth, anoxia and sulphide have been persistent features for the past decade (SMHI, 2014) and the lamination of Landsort Deep bottom sediment suggests essentially anoxic conditions at the sediment surface during the past ca. 450014C years (Lepland & Stevens, 1998). The sediment at this site is rich in organic material since flocks of cells, from phytoplankton blooms and other organic particles, sink through the water column (Leipe et al., 2011) and accumulate at the sediment surface, resulting in so called accumulation bottoms (Fredén, 1994). Particulate organic carbon values of the Baltic Proper deep are comparable only to regions of extreme productivity and oxygen depletion, such as the upwelling areas off Peru, SW Africa and the Arabian Sea (Leipe et al., 2011and references therein). Moreover, the Baltic Sea is affected by anthropogenic pollution, heavy metals and organic pollutants have accumulated in the anoxic sediment of the Landsort Deep (HELCOM, 2010).
near Barbados and from the Santa Barbara Basin showed differences in polyphosphate metabolism at oxic and anoxic conditions (Jones, Flood & Bailey, 2015). However,in situ
microbial community transcriptional activity of deep sea marine sediments in general is poorly described since there are only two published studies to date, i.e., metatranscriptomes from Peru Margin sub seafloor (Orsi et al., 2013) and Arctic Jan Mayen vent field (Urich et al., 2014). No metatranscriptomics studies have focused on anoxic brackish sediments. With the prospect of a progression of oxygen depletion both in the Baltic Proper (Meier et al., 2011;Kabel et al., 2012) and globally (Altieri & Gedan, 2015), a deeper understanding of microbial metabolic processes in anoxic sediments is increasingly important as these processes are key in essential ecosystem functions such as carbon, sulphur and nitrogen transformation.
In this study, we investigated what functional capacities of the microbial community in the Landsort Deep anoxic sediment were realised, i.e., actually expressed, using a metatranscriptomics approach. We analysed the expression of metabolic and regulatory pathways to elucidate the ecosystem functions that the sediment microbial community potentially contributes to. Given the eutrophication process with extension of anoxic zones in the Baltic Sea and the global importance of carbon cycling, we specifically considered sediment community transformation of organic carbon. The results reveal a sediment microbial community with active expression of genes for essential nutrient transformation processes and provide metatranscriptomic information on the deepest part of the Baltic Sea. The information is important for understanding microbial ecosystem functions of the expanding anoxic sediment areas of the Baltic Sea but also pertinent in the wider perspective of eutrophied marine environments and anoxic sediments.
MATERIALS AND METHODS
Sampling
Triplicate sediment cores for nucleic acid extraction and elemental analysis were retrieved at 466 m depth, using a Gemini sampler, on the 21st of April 2010 at Landsort Deep (lat 583591N, long 01814.26E) in the Baltic Sea, Sweden. Measurements and analyses of environmental parameters and nutrients were performed as previously described (Thureborn et al., 2013).
RNA and DNA extraction
Nucleic acids were extracted from the 0–10 cm top-layer of triplicate sediment cores. Total RNA extraction, using the FastRNA Pro Soil-Direct Kit (MP Biomedicals, Solon, OH, USA), was immediately initiated on board the ship. 500 mg sediment aliquots were immersed in RNApro Soil Lysis Solution and processed in the FastPrep instrument followed by transportation on dry ice to the lab and storage at−80◦C. The extraction procedure
Total DNA was extracted, as described previously (Thureborn et al., 2013), and subsequently pooled before sequencing.
cDNA synthesis
Prior to synthesis of cDNA, total RNA extracts from the triplicate sediment cores were pooled and subsequently split into two aliquots. One of the aliquots was enriched for mRNA using the MICROBEExpressBacterial mRNA Enrichment Kit (Life Technologies). The two fractions, i.e., the mRNA enriched and the total RNA, were amplified separately using the MessageAmp II Bacteria kit (Life Technologies) following the manufacturer’s instructions, except substituting the kit oligo (dT) with T7-BpmI-(dT)16VN (Frias-Lopez et al., 2008). The antisense RNA product was synthesised into cDNA using SuperScript II Reverse Transcriptase (Life Technologies) with random hexamer priming for first-strand synthesis and Superscript Double Stranded cDNA synthesis kit (Life Technologies) for second-strand synthesis following the manufacturer’s instructions. The synthesised cDNA was purified using the Qiaquick PCR Purification Kit (Qiagen, Hilden, Germany) and subsequently treated with 2–3 unitsBpmI (New England Biolabs, Ipswich, MA, USA) per µg cDNA for 2–3 h at 37 ◦
C to remove poly-A tails. TheBpmI treated cDNA was purified using Qiaquick PCR Purification Kit before being sent to sequencing.
Sequencing
The two cDNA fractions (i.e., total cDNA and mRNA-enriched cDNA) were sequenced as 100 bp paired-end reads on a third of a lane, respectively, on an Illumina HiSeq 2000 (Illumina Inc, San Diego, CA, USA) at the Science For Life Laboratory (SciLifeLab), Stockholm, Sweden. The DNA was sequenced as 100 bp paired-end reads on one lane on an Illumina HiSeq 2000 (Illumina Inc) at GATC Biotech AG, Konstanz, Germany. In total, the Illumina sequencing generated approximately 187 million cDNA and 106 million DNA paired-end sequence reads (2×100 bp), respectively (Table S1).
Sequence data were deposited at the European Nucleotide Archive (ENA) under the project PRJEB6616 with sample accession numbersERS485200(total cDNA),ERS485201 (mRNA-enriched cDNA) andERS485202(DNA).
Bioinformatic analyses
were merged, generating one cDNA dataset. The Landsort Deep cDNA and DNA paired-end sequence reads were assembled separately using the Velvet (with Oases in case of cDNA) and Meta-Ray assemblers (Zerbino & Birney, 2008; Boisvert et al., 2012;Schulz et al., 2012). For cDNA assembly, the following kmer lengths were used: 57, 61, 65, 69 with Velvet-Oases and 33, 41, 49, 57, 61, 65 with Meta-Ray. For DNA assembly the following kmer lengths were used: 51, 55 with Velvet and 31 with Meta-Ray. Genes were predicted from the obtained contigs using FragGeneScan with suggested options for contigs (Rho, Tang & Ye, 2010) generating 429,162 cDNA genes and 3,176,262 DNA genes, respectively (Table S1). The predicted gene sequences obtained with the different assemblers and kmer lengths were clustered at 99% similarity using UCLUST (Edgar, 2010). Representative sequences from each cluster were retrieved for further processing. The obtained sequences were aligned to the M5NR database (release 20120401) (Wilke et al., 2012) using BLASTX (Altschul et al., 1997). The BLASTX outputs, with a bit score
>50, were used to annotate ORFs in KEGG (Kanehisa et al., 2012) and SEED (Overbeek et al., 2005) categories, and the Last Common Ancestor (LCA) algorithm (Huson et al., 2007) was applied to taxonomically bin each sequence using in-house scripts (m5nr2annot and organisms2lca inhttps://github.com/erikrikarddaniel/environmentmicrobedb-tools). The LCA algorithm, as run by us, considers the taxonomy of all BLASTX hits with a bit score>50 and>0.9 times the bit score of the best hit. The taxonomy assigned to a sequence will be the most specific that is common to all BLASTX hits. The estimation of the relative abundance of each SEED/KEGG function or category was obtained by mapping the quality-trimmed sequence reads against the annotated ORFs using ERNE-MAP (Prezza et al., 2012). Ultimately, around 5 million cDNA and 12 million DNA sequence reads could be annotated to a SEED function (Table S1).
Phylogenetic analysis was performed to reveal if methyl coenzyme M reductase A (mcrA)
transcripts were affiliated to methanogenic or anaerobic methane oxidising (ANME) archaea. These transcripts were aligned to selectedmcrAgenes from methanogenic and ANME (Hallam et al., 2003; Lösekann et al., 2007) archaea using ClustalW (Thompson, Higgins & Gibson, 1994) as implemented in Geneious version (5.0.4) (Kearse et al., 2012) and subsequently analysed using the Neighbor-Net (Bryant & Moulton, 2004) algorithm with uncorrected p-distances implemented in SplitsTree4 (Huson & Bryant, 2006). The contig containing the single ORF that encoded beta-lactamase was aligned against the NCBI non-redundant (NR) database using BLASTX. To reveal any possible contamination the beta-lactamase ORF was further aligned to commercial cloning- and expression vectors used in our lab using ClustalW in Geneious. Transcripts encoding the D1 protein of the PSII P680 reaction centre (psbA) were taxonomically assigned using BLASTX against the NCBI NR database and MEGAN (Huson et al., 2011) with best hit as criteria. To reveal if there was a diatom signature in the rRNA, the sequence reads from the non-enriched cDNA fraction (i.e., total cDNA) were annotated using the MG-RAST pipeline and the integrated SSU and LSU rRNA databases (Meyer et al., 2008).
Deep, the forward (5′) reads from total RNA Landsort Deep and Peru Margin (5, 30, 70
and 159 m below the sea floor) paired-end Illumina datasets and the 454 reads from Arctic Jan Mayen vent field were aligned to the NCBI NR database using DIAMOND (Buchfink, Xie & Huson, 2015). DIAMOND output files were imported into MEGAN5 (Huson et al., 2011) where metatranscriptomic sequence reads were annotated to SEED functions (Overbeek et al., 2005) using the default settings. Comparison of the different datasets was performed using sub-sampled counts.
Data analysis
For identification and visualisation of regulatory and metabolic pathways in KEGG, iPATH2
(Yamada et al., 2011) was used. All KEGG identifiers (i.e., KO numbers) with≥1 hit in the metatranscriptomic dataset were applied. Prior to analysis of SEED annotated data, the sequences for functional roleRetron-type reverse transcriptasewere removed from the cDNA and DNA datasets because of suspicious misannotation of rRNA (Tripp et al., 2011). In the hierarchical SEED functional category system several functions (i.e., proteins) are affiliated to multiple SEED categories. Consequently when summarising the number of reads at the higher hierarchical levels (i.e., 1st and 2nd level of SEED) there is a risk that the same reads are counted more than once. To avoid this we removed duplicate proteins affiliated to the same parent SEED category when summarising number of reads at the 1st and 2nd level of the SEED hierarchy. The portion of functions (i.e., genes) expressed within functional categories (i.e., SEED categories) was calculated as the ratio of functions detected in the metatranscriptome/functions detected in the metagenome. Relative abundances of taxa and functions were calculated as percentage of the total number of reads annotated in the metatranscriptome(s) and metagenome, respectively.
RESULTS
Environmental parameters
At the time of sampling, the water overlying the sediment was depleted of dissolved oxygen and hydrogen sulphide (H2S) (16.3 µmol/L) was present (Table S2). Measurements of
sediment nutrients revealed high concentrations of ammonium (363.8µmol/L), phosphate (46.9µmol/L) and silica (268.2µmol/L), and low concentration of nitrate (4.1µmol/L) (Table S2). The sediment total carbon content (TOC) was approximately 10% and the concentration of dissolved organic carbon (DOC) was 79.0 mg/L (Table S2).
Active gene expression of metabolic and regulatory pathways of the sediment community
Annotation of the gene transcripts present in the Landsort Deep sediment metatranscrip-tome revealed that as much as 30% of the total functions annotated in the corresponding metagenome were expressed. The major part, 99%, of the functions identified in the metatranscriptome could correspondingly be confirmed in the metagenome.
Figure 1 Expression of metabolic genes by the Landsort Deep sediment community.Overview of all metabolic KEGG pathways expressed as transcripts (RNA) by the total microbiome in the Landsort Deep sediment. Mapping of transcript data to the KEGG map was performed using iPATH v2 (Yamada et al., 2011). Red indicates transcript (element) present in the Landsort Deep sediment metatranscriptome.
extensively expressed (Fig. S1) and transcripts encoding ribosomal proteins were the most abundant (Fig. 2). Our results revealed major differences in transcript abundance among functions at the 1st level of SEED classification (Fig. 3). Out of the total 28 functions (SEED categories), the dominating 50% includedProtein-, RNA- and DNA metabolism
andNucleosides and Nucleotides(Fig. 3). We found that a large portion of functions was expressed for both Protein metabolism(58%; 253 out of 438 genes expressed) andCell Division and Cell Cycle (53%; 34 of 64 genes expressed) (Table S3).
Chemotaxis, motility and adhesion
Results showed extensive expression of genes associated withMotility and Chemotaxis
(n=8,316; 46 of 89 genes expressed) (Fig. 3,Fig. S1andTable S3). Especially transcripts encoding flagellar proteins as flagellin protein FlaA (n=1,825) and flagellar biosynthesis
Figure 2 Top 10 expressed functions in the Landsort Deep sediment community.The 10 most abun-dant functions (SEED) in the sediment metatranscriptome that together added up to>50% of the total
Figure 3 Expression of functions, SEED categories, in the Landsort Deep sediment community. Func-tional diversity at the transcripFunc-tional level with relative abundances of SEED categories (level 1) in the sed-iment metatranscriptome and metagenome, respectively. The 20 most abundant SEED categories of a total of 28 SEED categories in the metatranscriptome are shown and sorted from top to bottom based on high to low abundance.
(n=57) and CheW (n=53) were less abundant (Table S4). Furthermore, transcripts associated with Adhesion(n=1,437), particularly the cell-wall-anchored protein SasA (Table S4), were also identified in the metatranscriptome.
Enzymatic hydrolysis of organic matter
This study reveals expression of genes encoding key enzymes for degradation of carbohydrates and polymers (i.e., within the SEED categoriesAminosugars, Polysaccharides
and Glycoside hydrolase; Table S5). Transcripts of enzymes in the latter two were overrepresented in Landsort Deep sediment (8,336 and 1,679 counts per million (CPM) for Polysaccharides andGlycoside hydrolase respectively) compared to other sediment metatranscriptomes (between 402 and 1412 CPM and 0 and 539 CPM respectively) (Fig. S2). We also identified transcripts for beta-hexosaminidase (EC 3.2.1.52) (n=49) and chitinase (EC 3.2.1.14) (n=35) necessary for chitin utilization (Table S5) and transcripts
three genes were expressed as transcripts, and forGlycogen metabolismsix of nine genes were expressed (Table S5). Most of these transcripts were matched to glycogen phosphorylase (EC 2.4.1.1) (n=152) (Table S5).
Dissimilatory sulphate reduction and denitrification
Transcripts encoding all the necessary enzymes for dissimilatory sulphate reduction were identified, i.e., sulphate adenylyltransferase (Sat) EC 2.7.7.4, adenylylsulphate reductase (AprAB) EC 1.8.99.2 and sulphite reductase (DsrAB) EC 1.8.99.5 (Fig. S3andTable S4). Moreover, genes encoding the complete sulphite-reduction associated complex DsrMKJOP were expressed (Table S4). We detected an incomplete denitrification pathway with transcripts encoding nitrate reductase (EC 1.7.99.4) and cytochrome cd1 nitrite reductase (EC 1.7.2.1) but with no transcripts encoding enzymes for nitric oxide reduction through nitrous oxide to nitrogen (Fig. S4).
Fermentation
All fermentative pathways in the SEED classification were expressed to varying extent (36–67% of genes expressed), with the major portion of genes expressed for butanol biosynthesis and acetyl-CoA fermentation to butyrate (Table S5). The most abundant transcript (n=1,322) associated with fermentative processes encoded the enzyme pyruvate formate lyase (EC 2.3.1.54) (Fig. 1) followed by transcripts encoding acetolactate synthase EC 2.2.1.6 (n=984) and butyryl-CoA dehydrogenase EC 1.3.99.2 (n=115), respectively
(Table S5).
Methanogenesis and anaerobic methane oxidation
There was a high abundance of transcripts of themcrAgene that encodes the alpha subunit of the methanogenic key enzyme, methyl coenzyme M reductase (Fig. 2) in Landsort Deep sediment, also in comparison to other sediment metatranscriptomes in which we did not detect any transcripts (Fig. S2).
Indeed, transcripts encoding subunits of all enzymes in complete methanogenic pathways from carbon dioxide, methanol and acetate were detected, even if not all subunits in all enzymes were detected (Fig. 1, Fig. S5 andTable S6). An incomplete pathway from trimethylamine to methane was also identified in the metatranscriptome (Table S6). Taxonomic analysis showed that transcripts specific for methane production from carbon dioxide were predominantly assigned to Methanosarcinales of the phylum Euryarchaeota, whereas transcripts for the other methanogenic pathways were assigned to different taxa including bacterial species (Table S6). Phylogenetic analysis ofmcrA
formate dehydrogenase (EC 1.2.1.2) but no enzymes for oxidation of methanol through formaldehyde to formate.
Resistance mechanisms and mobile genetic elements
Eight percent of the sediment metatranscriptome were beta-lactamase transcripts (Fig. 2). However, the beta-lactamase transcripts were traced to one single ORF flanked by regions 400 bp upstream and 100 bp downstream with no corresponding match to the diverse set of beta-lactamase genes found in the metagenome. Sequence analysis (BLAST) showed best match to a TEM-type beta-lactamase and beta-lactamases in different commercial expression and cloning vectors. From sequence alignments to the vectors used in our lab, we found no signs that the beta-lactamase transcripts were a result of contamination by any of our tools. Transcripts of cobalt-zinc-cadmium (n=35) and arsenic (n=9) resistance genes were detected (Table S4). Moreover, phage integrase transcripts were abundant (Fig. 2). A large portion of expressed genes associated withPhage integration and excision(46%; 6 of 13 genes expressed) andPhage packing machinery (58%; 7 of 12 genes expressed) (Table S5) was expressed. Transcripts of viral structural genes, such as major capsid proteins, were also present (Table S4). High abundances of integron integrase transcripts were identified (n=1,215) (Table S4) and integron integrase transcripts were
overrepresented in the Landsort Deep sediment metatranscriptome (463 CPM) when compared to metatranscriptomes of Peru Margin sub-seafloor (9.87, 19.6, 0 and 0 CPM in the 5 m, 30 m, 70 m and 159 m samples respectively) (Orsi et al., 2013) and Arctic Jan Mayen vent field (0 CPM) (Urich et al., 2014) sediments (Fig. S2).
Transcripts associated with photosynthesis
Surprisingly, our results showed a high abundance of transcripts annotated to the SEED category Photosynthesis (Fig. 3). The majority (>95%) of these transcripts, however, were annotated to a single gene, psbA encoding the D1 protein of the PSII P680 reaction centre (Fig. 1). In fact, psbA was the third most abundant transcript in the metatranscriptome (Fig. 2). Transcripts ofpsbA were unique for the Landsort Deep sediment metatranscriptome relative to the other sediment metatranscriptomes (Fig. S2) and could only be assigned at a very broad taxonomic level (‘‘cellular organism’’ and ‘‘root’’ in the NCBI taxonomy) by the LCA algorithm (Huson et al., 2007). However, the best BLASTX hits to Landsort DeeppsbAtranscripts were sequences from eukaryotic algae (Fig. S7), predominantly diatoms (i.e., Bacillariophyta) that were abundant in the sediment rRNA (2% of total SSU rRNA, 10% of total LSU rRNA).
Distribution of transcripts across taxa
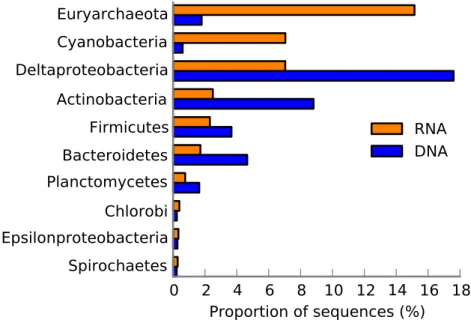
Figure 4 The 10 most abundant taxa in the Landsort Deep sediment community.Taxonomical distri-bution of functions (SEED categories) in the metatranscriptome and metagenome of Landsort Deep sed-iment. Only the 10 most abundant phyla or proteobacterial classes in the metatranscriptome are shown and sorted from top to bottom based on high to low abundance in the metatranscriptome.
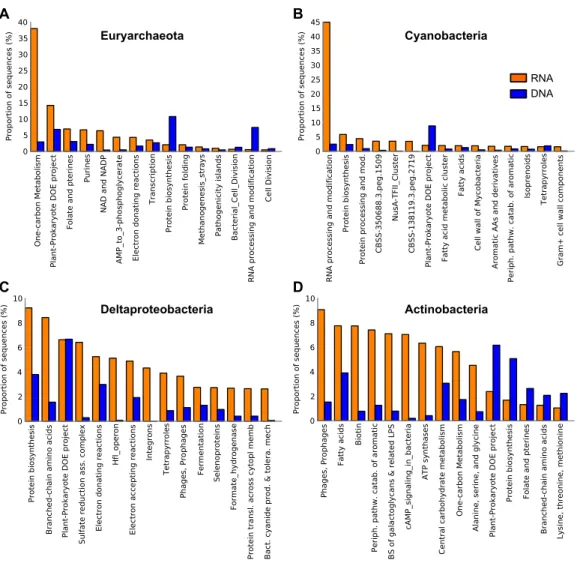
(38%) in the euryarchaeal transcriptome encoded methyl coenzyme M reductase alpha subunit (EC 2.8.4.1), followed by transcripts encoding amidophosphoribosyltransferase EC 2.4.2.14 (9%, seePlant-Prokaryote DOE project (miscellaneous SEED category),Folate and PterinsandPurines,Fig. 5A) and nicotinamide-nucleotide adenylyltransferase, NadM family EC 2.7.7.1 (9%, seePlant-Prokaryote DOE project andNAD and NADP,Fig. 5A) (Table S7).
Interestingly, Cyanobacteria was the second most abundant taxon in the Landsort Deep metatranscriptome, approximately 10-fold more abundant than in the metagenome (Fig. 4). More than 90% of the reads could only be assigned at phylum level but when assigned at lower ranks Nostocales (4%) and Chroococcales (2%) were most common. A major portion of the cyanobacterial transcripts was associated withRNA processing and modification(Fig. 5B). This was largely a reflection of the many transcripts (61% of cyanobacterial transcripts) encoding the cyanobacterial cold-shock DEAD-box protein A (Fig. 2,Table S7). Several transcripts were associated withProtein biosynthesisandProtein processing and modificationincluding the second most abundant transcript that encoded the ribosomal protein S12p Asp88 methylthiotransferase (7%). Transcripts encoding the translation initiation factor 2 (5%) were the third most abundant in the cyanobacterial transcript pool (Table S7) (see Protein biosynthesis,CBSS-350688.3.peg.1509, NusA-TFII cluster andCBSS-138119.3.peg.2719,Fig. 5B).
Figure 5 Expressed functions by the most abundant taxa in the Landsort Deep sediment metatran-scriptome.Distribution of transcripts of the four most dominant phyla and proteobacterial classes in the Landsort Deep sediment metatranscriptome; (A) Euryarchaeota (B) Cyanobacteria (C) Deltaproteobac-teria (D) ActinobacDeltaproteobac-teria. The 15 most abundant SEED categories (level 2) in the (meta)transcriptome for each taxa are shown and sorted from left to right based on high to low abundance. Corresponding metage-nomic (DNA) data is also presented. ThePlant-Prokaryote DOE projectis a miscellaneous SEED cate-gory comprising a diverse set of genes identified during investigation of plant-prokaryote interactions by a project at the Department of Energy (DOE), USA. CBSS-350688.3.peg.1509 and CBSS-138119.3.peg.2719 are clustering-based subsystems in which there is functional coupling and evidence that genes belong to-gether, but with unknown functions. BS of galactoglycans & related LPS, Biosynthesis of galactoglycans and related lipopolysaccharides; Periph. pathw. catab. of aromatic, Peripheral pathways for catabolism of aromatic compounds.
different functional categories, includingSulfate reduction associated complex (6%) and
Fermentation (3%) (Fig. 5C). In addition, eighty percent of the total transcripts for dissimilatory sulphate reduction were assigned to Deltaproteobacteria. The most prevalent deltaproteobacterial transcripts encoded hydroxymethylglutaryl-CoA lyase EC 4.1.3.4 (12 %, seeBranched-chain amino acids,Fig. 5C), HflK protein (7%, seePlant-Prokaryote DOE project andHlf operon,Fig. 5C) and glutamyl-tRNA synthetase (6%, seeProtein biosynthesis
Actinobacteria was also abundant (the 4th taxon) in the metatranscriptome, similarly to the metagenome, where it was second after Deltaproteobacteria (Fig. 4). Main functional categories of actinobacterial transcripts included Fatty Acids, One-carbon metabolism, Central carbohydrate metabolism andPeripheral pathways for catabolism of aromatic compounds (Fig. 5D). The three most abundant actinobacterial transcripts encoded integrase (16%, seePhages, Prophages,Fig. 5D), long chain fatty acid CoA ligase EC 6.2.1.3 (13%, see Fatty Acids, Biotin,Peripheral pathways for catabolism of aromatic compounds,Fig. 5D) and cAMP-binding protein (13%, seecAMP signalling in bacteriaand
Biosynthesis of galactoglycans and related lipopolysaccharides,Fig. 5D) (Table S7).
DISCUSSION
The Baltic Sea holds some of the largest oxygen depleted and sulphidic areas in the world (Diaz & Rosenberg, 2008). It is predominantly an effect of eutrophication with seasonal phytoplankton blooms and oxygen depleting heterotrophic respiration. Pelagic and coastal sediment microbial communities of the Baltic Sea have been comprehensively studied (e.g.,Edlund et al., 2008;Dupont et al., 2014). However, the community of the habitat persistently exposed to oxygen depletion, the deepest point of the Baltic Sea, has previously received little attention (Thureborn et al., 2013). While biogeochemical analysis may reveal whether a microbiome responds to environmental conditions and contributes to key ecosystem functions it does not provide genetic information suggesting how this is accomplished. This study shows what genes of metabolic and regulatory pathways are expressed by the Landsort Deep sediment community. Results reveal that the community is activein situexpressing a large portion of the genome content detected in the metagenome (Fig. 1). The presence of transcripts, i.e., relatively unstable environmental mRNA, demonstrates that the deep trench sediment metagenome comprises living cells and not solely preserved DNA of dead cells deposited from the water column (Corinaldesi et al., 2011). These results further strengthen our previous metagenomic results (Thureborn et al., 2013). Moreover, the comparison with other metatranscriptomes from sediments, although limited by the presence of few such studies and inherent differences in sampling and laboratory procedures (Jones et al., 2015), highlights the special characteristics of the Landsort Deep sediment and the importance of future comparative work.
The eutrophication process, climate and the Baltic Sea bathymetry all influence the environmental conditions at Landsort Deep. Euxinic conditions with high sediment deposition rates, anoxic sediment and H2S in the overlying waters (Lepland & Stevens,
1998;Leipe et al., 2011) were confirmed at the time of sampling by a high concentration of organic carbon in the sediment (79.0 mg/L DOC) and sulphidic bottom water (16.3µmol/L H2S) (Table S2). Landsort Deep metatranscriptomic results reflect these environmental
column deposited at the sediment surface (Fig. 3,Fig. S1andTable S3). Once attached, the microorganisms could convert the organic matter to less complex compounds. Indeed, expressions of several genes encoding key enzymes for degradation of carbohydrates and polymers (Table S5) suggest that the sediment community mineralises the organic matter. For example, transcripts for chitinase support that specifically chitin is hydrolysed into oligo- or dimers and that this polymer, present in debris derived from zooplankton and invertebrates (Gooday, 1990), is a metabolic resource for the Landsort Deep sediment community. The expressions of glycoside hydrolase genes and several other genes for enzymatic hydrolysis of carbon polymers imply that there are substrates available for further mineralisation in the sediment through anaerobic heterotrophy.
Dissimilatory sulphate reduction was an anaerobic heterotrophic pathway of which the complete gene suite was expressed (Fig. S3). Metabolism with sulphate as electron acceptor in heterotrophy was also supported by the highly sulphidic environment of Landsort Deep (Table S2). Organic matter, which has been mineralised into smaller organic carbon compounds—e.g., volatile fatty acids (VFA) such as acetate, lactate, formate and propionate—may serve as electron donors in sulphate reduction. These smaller organic compounds, at a concentration of 79.0 mg/L at Landsort Deep (Table S2), are primarily products from microbial fermentation of monomers and oligomers (Holmer & Storkholm, 2001;Finke & Jorgensen, 2008). Landsort Deep sulphate reducers hence depend on other community members, i.e., fermenters, to provide electron donors, in this study corroborated by a high proportion of expressed genes within fermentative pathways (Table S5). Since the sediment community expressed all fermentative pathways, sulphate reducers probably have access to the necessary carbon substrates. Although the presence of transcripts does not confirm enzymatic activity, these results are consistent with active heterotrophic mineralisation of dissolved organic matter through fermentation and dissimilatory sulphate reduction in the Landsort Deep sediment.
Methanogenesis was one of the major ecosystem processes identified in the
Archaea in the ANME group (Fig. S6) in cooperation with coexisting sulphate reducing Deltaproteobacteria (i.e., Desulfobacteraceae) (Fig. 4) (Hallam et al., 2004; Knittel & Boetius, 2009) and by bacterial anaerobic methane oxidation by Methylococcaceae using available nitrate as electron acceptor (Table S2) (Ettwig et al., 2010).In situoxidation of produced methane hence potentially restricts methane release to the hydrosphere. These results are supported by a recent study, which demonstrated bacterial aerobic methane oxidation in the redox zone of the Landsort Deep water column but also proposed that methane was oxidised anaerobically in the anoxic deep water (Jakobs et al., 2013).
Energy metabolism in the sediment community of Landsort Deep, as inferred from expressed transcripts, appears to a large extent comprise the processes fermentation, methanogenesis, sulphate reduction and methane oxidation (Fig. 6). Drawing on these results, the Landsort Deep sediment methanogens and sulphate reducers may use products of fermentation as electron donors acting as sinks for hydrogen and organic acids. This may increase the fermentation rate, since concentrations of metabolites stay low, and improve the supply of substrates for respiring bacteria (Fenchel & Finlay, 1995). Organic acids would otherwise build up in the immediate environment and potentially reduce the efficiency of fermentation (Fenchel & Finlay, 1995). Methanogenic archaea, fermenting bacteria and anaerobic respiring bacteria may well make up synergistic assemblages, an ‘‘interactome’’, to which anaerobic methane oxidisers affiliate to capitalise on the methane (Fig. 6). Importantly, these results show that the microbial community expresses an array of metabolic enzyme genes that are crucial for transformation of the organic matter deposited in the sediment of Landsort Deep.
A characteristic feature of the Landsort Deep and other anoxic sediment metagenomes was the high abundance of integrons (Thureborn et al., 2013). The high abundance of transcripts encoding integron integrases detected in this study demonstrates that the integron genes of the Landsort Deep sediment are indeed expressed (Table S4). Further-more, transcripts encoding integron integrases are overrepresented in the metatran-scriptome of Landsort Deep sediment in comparison with other sediments (Fig. S2). Integrons carry a large pool of adaptive genes with a potential to facilitate acquisition and recombination of foreign DNA into microbial genomes that may improve the recipient’s environmental fitness (Labbate, Case & Stokes, 2009), and integron recombination events have been found to be induced by environmental stress (Guerin et al., 2009). Notably, prevalence of integrons has been shown to increase with the degree of environmental pollution (Hardwick et al., 2008;Wright et al., 2008;Rosewarne et al., 2010) and the class 1 integron-integrase gene has been suggested as a proxy for anthropogenic pollution (Gillings et al., 2015). The comparatively high abundance of integron integrase transcripts in Landsort Deep sediment possibly reflects the high concentrations of pollutants at this site (HELCOM, 2010). Interestingly, Landsort Deep sediment (the same sample as in this study) has been shown to be a hot spot of IncP alpha plasmids, mobile genetic elements that may contribute to bacterial survival in polluted environments (Dealtry et al., 2014).
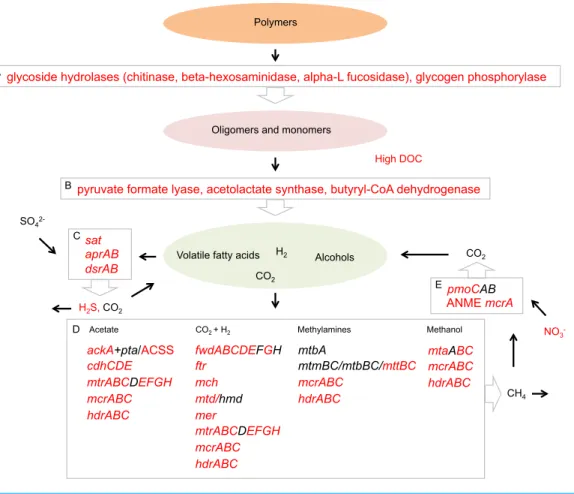
Figure 6 Proposed Landsort Deep sediment community interactome.A model inferred from tran-scripts showing putative interactions between metabolic processes involved in organic matter mineralisa-tion and carbon transformamineralisa-tion in the Landsort Deep sediment community. (1) Enzymatic hydrolysis rep-resented by the most abundant enzyme transcripts. (2) Fermentation reprep-resented by the most abundant enzyme transcripts. (3) Dissimilatory sulphate reduction—transcripts were identified for all genes neces-sary for this process (4) Methanogenesis—transcripts of all genes necesneces-sary for methanogenic pathways using the different substrates acetate, CO2+H2, methylamines and methanol, respectively. (5) Anaerobic
methane oxidation represented by bacterial particulate methane monooxygenase (pmoCAB) and ANME methyl coenzyme M reductase A (mcrA). Red colour indicates detected environmental parameters and identified gene transcripts in Landsort Deep sediment.
encoding the D1 protein of the PSII P680 reaction centre (psbA), particularly from diatoms (Fig. 2,Fig. S7). Expression ofpsbAin sunlit anoxic sediments was recently observed for oxygenic photosynthesis (Spain et al., 2015). However, high abundance ofpsbAtranscripts in a permanently dark environment as the Landsort Deep sediment may be a consequence of how the PsbA protein synthesis is regulated in eukaryotic micro-algae. According to a previous study, stable pool ofpsbAtranscripts accumulates during darkness as a result of constitutive transcription and strong regulation of protein biosynthesis at the level of translation initiation (Mulo, Sakurai & Aro, 2012). Moreover, constitutive expression of this gene has been shown in diatoms (Nymark et al., 2013). A possible scenario is thatpsbA
in April just prior to sampling and in which diatoms are the major constituents (Kaitala, Hällfors & Maunula, 2010).
Another unexpected finding was the high abundance of transcripts assigned to Cyanobacteria (Fig. 4). These results, however, are corroborated by the high abundance of Cyanobacteria in the rRNA (P Thureborn, 2015, unpublished data) and support our previous finding of Cyanobacteria in the Landsort Deep sediment metagenome (1.6% of protein coding genes) (Thureborn et al., 2013). Cyanobacteria are capable of fermentative metabolism under dark and anoxic conditions (Stal & Moezelaar, 1997). However, the lack of evidence for cyanobacterial fermentative metabolism in the metatranscriptome (Table S7) suggests other reasons that better may explain the presence of Cyanobacteria in the Landsort Deep sediment. Cells may originate from the upper water column (Funkey et al., 2014), experience environmental stress and maintain non-growth functions (Schimel, Balser & Wallenstein, 2007) in the cold, dark and anoxic sediment. This is consistent with high expression of the cold-shock DEAD-box protein A (Fig. 2,Table S7), which has been shown to be involved in ribosome biogenesis, RNA turnover and translation initiation and cyanobacterial adaptation to low temperature (Chamot et al., 1999;Redder et al., 2015). These are all important processes in adaptation to a changing environment and stress response. Studies have also shown that Synechocystis DEAD-box RNA helicase transcripts accumulate when the electron transport chain is reduced (Patterson-Fortin, Colvin & Owttrim, 2006), opening for the suggestion that abundance of these transcripts at deep sea sediments reflects RNA redox regulation. Our finding of cyanobacterial transcripts in the Landsort Deep anoxic sediment merits further studies on cyanobacterial physiology during dark anoxic conditions and the broader role of Cyanobacteria in the Baltic Sea carbon transformation.
In conclusion, analyses of environmental mRNA and DNA revealed that the diverse sediment microbiome of Landsort Deep expressed large portions of its functional capacity. The metatranscriptome and environmental data indicate a sediment community active in capitalising on organic matter through anoxic mineralisation and carbon transformation, possibly through synergistic interactions between fermenters, sulphate reducers, methanogens and methane oxidisers (Fig. 6). With the prospect of a progression of anoxic conditions in the Baltic Sea, our results contribute information for future efforts to foresee microbial ecosystem functions in a scenario in which euxinic conditions prevail. Furthermore our results advance the understanding, at transcriptional level, of microbial ecosystem functions in deep water anoxic sediments.
ACKNOWLEDGEMENTS
ADDITIONAL INFORMATION AND DECLARATIONS
Funding
The work was funded by the Foundation for Baltic and East European Studies 1169/42/2007:17 (www.ostersjostiftelsen.se) to SS, Britt-Marie Sjöberg and Anthony Poole, the EU Metaexplore project (KBBE-222625) and Stockholm Läns Landsting to SS. The University of Milano—Bicocca supported AF’s sabbatical leave. The funders had no role in study design, data collection and analysis, decision to publish, or preparation of the manuscript.
Grant Disclosures
The following grant information was disclosed by the authors: Foundation for Baltic and East European Studies: 1169/42/2007:17. EU Metaexplore project: KBBE-222625.
Stockholm Läns Landsting.
The University of Milano—Bicocca.
Competing Interests
The authors declare there are no competing interests.
Author Contributions
• Petter Thureborn conceived and designed the experiments, performed the experiments,
analyzed the data, wrote the paper, prepared figures and/or tables, reviewed drafts of the paper.
• Andrea Franzetti and Daniel Lundin analyzed the data, contributed reagents/materials/-analysis tools, reviewed drafts of the paper.
• Sara Sjöling conceived and designed the experiments, contributed
reagents/materials/-analysis tools, wrote the paper, reviewed drafts of the paper.
DNA Deposition
The following information was supplied regarding the deposition of DNA sequences: Sequence data were deposited at the European Nucleotide Archive (ENA) under the project PRJEB6616 with sample accession numbersERS485200(total cDNA),ERS485201 (mRNA enriched cDNA) andERS485202(DNA).
Data Availability
The following information was supplied regarding data availability:
GitHub, m5nr2annot and organisms2lca, https://github.com/erikrikarddaniel/ environmentmicrobedb-tools.
Supplemental Information
REFERENCES
Ahtiainen H, Artell J, Elmgren R, Hasselström L, Håkansson C. 2014.Baltic Sea
nu-trient reductions—What should we aim for?Journal of Environmental Management
145:9–23DOI 10.1016/j.jenvman.2014.05.016.
Altieri AH, Gedan KB. 2015.Climate change and dead zones.Global Change Biology
21:1395–1406DOI 10.1111/gcb.12754.
Altschul SF, Madden TL, Schaffer AA, Zhang JH, Zhang Z, Miller W, Lipman DJ.
1997.Gapped BLAST and PSI-BLAST: a new generation of protein database search
programs.Nucleic Acids Research25:3389–3402DOI 10.1093/nar/25.17.3389.
Berg C, Beckmann S, Jost G, Labrenz M, Jurgens K. 2013.Acetate-utilizing bacteria at
an oxic-anoxic interface in the Baltic Sea.FEMS Microbiology Ecology85:251–261 DOI 10.1111/1574-6941.12114.
Boisvert S, Raymond F, Godzaridis E, Laviolette F, Corbeil J. 2012.Ray Meta: scalable
de novo metagenome assembly and profiling.Genome Biology13:Article R122 DOI 10.1186/gb-2012-13-12-r122.
Bryant D, Moulton V. 2004.Neighbor-Net: an agglomerative method for the
con-struction of phylogenetic networks.Molecular Biology and Evolution21:255–265 DOI 10.1093/molbev/msh018.
Buchfink B, Xie C, Huson DH. 2015.Fast and sensitive protein alignment using
DIAMOND.Nature Methods12:59–60DOI 10.1038/nmeth.3176.
Carstensen J, Andersen JH, Gustafsson BG, Conley DJ. 2014a.Deoxygenation of the
Baltic Sea during the last century.Proceedings of the National Academy of Sciences of the United States of America111:5628–5633DOI 10.1073/pnas.1323156111.
Carstensen J, Conley DJ, Bonsdorff E, Gustafsson BG, Hietanen S, Janas U, Jilbert T,
Maximov A, Norkko A, Norkko J. 2014b.Hypoxia in the Baltic Sea: biogeochemical
cycles, benthic fauna, and management.Ambio43:26–36 DOI 10.1007/s13280-013-0474-7.
Cederwall H, Elmgren R. 1990.Biological effects of eutrophication in the Baltic Sea,
particularly the coastal zone.Ambio19:109–112.
Chamot D, Magee WC, Yu E, Owttrim GW. 1999.A cold shock-induced cyanobacterial
RNA helicase.Journal of Bacteriology181:1728–1732.
Conley DJ, Bjorck S, Bonsdorff E, Carstensen J, Destouni G, Gustafsson BG, Hietanen S, Kortekaas M, Kuosa H, Meier HEM, Muller-Karulis B, Nordberg K, Norkko A, Nurnberg G, Pitkanen H, Rabalais NN, Rosenberg R, Savchuk OP, Slomp
CP, Voss M, Wulff F, Zillen L. 2009.Hypoxia-related processes in the Baltic Sea.
Environmental Science & Technology43:3412–3420DOI 10.1021/es802762a.
Corinaldesi C, Barucca M, Luna GM, Dell’Anno A. 2011.Preservation, origin and
genetic imprint of extracellular DNA in permanently anoxic deep-sea sediments.
Molecular Ecology 20:642–654DOI 10.1111/j.1365-294X.2010.04958.x.
Springael D, Heuer H, Van Elsas JD, Thomas C, Smalla K. 2014. Cultivation-independent screening revealed hot spots of IncP-1, IncP-7 and IncP-9 plas-mid occurrence in different environmental habitats.PLoS ONE9:e89922 DOI 10.1371/journal.pone.0089922.
Diaz RJ, Rosenberg R. 2008.Spreading dead zones and consequences for marine
ecosystems.Science321:926–929DOI 10.1126/science.1156401.
Dupont CL, Larsson J, Yooseph S, Ininbergs K, Goll J, Asplund-Samuelsson J, McCrow
JP, Celepli N, Allen LZ, Ekman M. 2014.Functional tradeoffs underpin
salinity-driven divergence in microbial community composition.PLoS ONE9(2):e89549 DOI 10.1371/journal.pone.0089549.
Edgar RC. 2010.Search and clustering orders of magnitude faster than BLAST.
Bioinfor-matics26:2460–2461DOI 10.1093/bioinformatics/btq461.
Edlund A, Hardeman F, Jansson JK, Sjoling S. 2008.Active bacterial community
structure along vertical redox gradients in Baltic Sea sediment.Environmental Microbiology10:2051–2063DOI 10.1111/j.1462-2920.2008.01624.x.
Elmgren R. 2012.Eutrophication: political backing to save the Baltic Sea.Nature
487:432–432.
Ettwig KF, Butler MK, Le Paslier D, Pelletier E, Mangenot S, Kuypers MMM, Schreiber F, Dutilh BE, Zedelius J, De Beer D, Gloerich J, Wessels HJCT, Van Alen T,
Luesken F, Wu ML, Van de Pas-Schoonen KT, Op den Camp HJM, Janssen-Megens EM, Francoijs K-J, Stunnenberg H, Weissenbach J, Jetten MSM, Strous
M. 2010.Nitrite-driven anaerobic methane oxidation by oxygenic bacteria.Nature
464:543–548DOI 10.1038/nature08883.
Falkowski PG, Fenchel T, Delong EF. 2008.The microbial engines that drive Earth’s
biogeochemical cycles.Science320:1034–1039DOI 10.1126/science.1153213.
Fenchel T, Finlay BJ. 1995.Ecology and evolution in anoxic worlds. Oxford: Oxford
University Press.
Finke N, Jorgensen BB. 2008.Response of fermentation and sulfate reduction to
experimental temperature changes in temperate and Arctic marine sediments.ISME Journal 2:815–829DOI 10.1038/ismej.2008.20.
Fredén C. 1994.Geology, national atlas of Sweden. Stockholm: SNA Publishing.
Frias-Lopez J, Shi Y, Tyson GW, Coleman ML, Schuster SC, Chisholm SW, DeLong EF.
2008.Microbial community gene expression in ocean surface waters.Proceedings
of the National Academy of Sciences of the United States of America105:3805–3810 DOI 10.1073/pnas.0708897105.
Funkey CP, Conley DJ, Reuss NS, Humborg C, Jilbert T, Slomp CP. 2014.Hypoxia
sustains cyanobacteria blooms in the Baltic Sea.Environmental Science & Technology
48:2598–2602DOI 10.1021/es404395a.
Gillings MR, Gaze WH, Pruden A, Smalla K, Tiedje JM, Zhu Y-G. 2015.Using the class
1 integron-integrase gene as a proxy for anthropogenic pollution.ISME Journal
9:1269–1279DOI 10.1038/ismej.2014.226.
Gooday G. 1990. The ecology of chitin degradation. In: Marshall KC, ed.Advances in
Guerin E, Cambray G, Sanchez-Alberola N, Campoy S, Erill I, Da Re S,
Gonzalez-Zorn B, Barbe J, Ploy MC, Mazel D. 2009.The SOS response controls integron
recombination.Science324:1034–1034DOI 10.1126/science.1172914.
Hallam SJ, Girguis PR, Preston CM, Richardson PM, DeLong EF. 2003.
Identifica-tion of methyl coenzyme M reductase A (mcrA) genes associated with methane-oxidizing archaea.Applied and Environmental Microbiology 69:5483–5491 DOI 10.1128/AEM.69.9.5483-5491.2003.
Hallam SJ, Putnam N, Preston CM, Detter JC, Rokhsar D, Richardson PM, DeLong EF.
2004.Reverse methanogenesis: testing the hypothesis with environmental genomics.
Science305:1457–1462DOI 10.1126/science.1100025.
Hansson M, Andersson L. 2014.Oxygen survey in the Baltic Sea 2013—extent of
anoxia and hypoxia, 1960-2013.Swedish Meterological and Hydrological Institute (SMHI) Report Oceanography No 49. Available athttp:// www.smhi.se/ publikationer/ publikationer/ oxygen-survey-in-the-baltic-sea-2013-extent-of-anoxia-and-hypoxia-1960-2013-2011.82243(accessed 21 January 2015).
Hardwick SA, Stokes HW, Findlay S, Taylor M, Gillings MR. 2008.Quantification of
class 1 integron abundance in natural environments using real-time quantitative PCR.FEMS Microbiology Letters278:207–212DOI 10.1111/j.1574-6968.2007.00992.x.
HELCOM. 2009. Eutrophication in the Baltic Sea—an integrated thematic assessment
of the effects of nutrient enrichment and eutrophication in the Baltic Sea region. In:Baltic Sea environment proceedings, vol. 115B.Available athttp:// helcom.fi/ Lists/ Publications/ BSEP115B.pdf (accessed 21 January 2015).
HELCOM. 2010. Hazardous substances in the Baltic Sea—an integrated thematic
assessment of hazardous substances in the Baltic Sea. In:Baltic Sea environment proceedings, vol. 120B.Available athttp:// helcom.fi/ Lists/ Publications/ BSEP120B.pdf (accessed 21 January 2015).
Holmer M, Storkholm P. 2001.Sulphate reduction and sulphur cycling in lake
sedi-ments: a review.Freshwater Biology46:431–451DOI 10.1046/j.1365-2427.2001.00687.x.
Huson DH, Auch AF, Qi J, Schuster SC. 2007.MEGAN analysis of metagenomic data.
Genome Research17:377–386DOI 10.1101/gr.5969107.
Huson DH, Bryant D. 2006.Application of phylogenetic networks in evolutionary
studies.Molecular Biology and Evolution23:254–267DOI 10.1093/molbev/msj030.
Huson DH, Mitra S, Ruscheweyh H-J, Weber N, Schuster SC. 2011.Integrative analysis
of environmental sequences using MEGAN4.Genome Research21:1552–1560 DOI 10.1101/gr.120618.111.
Jakobs G, Rehder G, Jost G, Kießlich K, Labrenz M, Schmale O. 2013.Comparative
studies of pelagic microbial methane oxidation within the redox zones of the Gotland Deep and Landsort Deep (central Baltic Sea).Biogeosciences10:7863–7875 DOI 10.5194/bg-10-7863-2013.
Jones DS, Flood BE, Bailey JV. 2015.Metatranscriptomic insights into polyphosphate
metabolism in marine sediments.ISME Journal DOI 10.1038/ismej.2015.169.
Library preparation methodology can influence genomic and functional predictions in human microbiome research.Proceedings of the National Academy of Sciences of the United States of America112(45):14024–14029DOI 10.1073/pnas.1519288112.
Kabel K, Moros M, Porsche C, Neumann T, Adolphi F, Andersen TJ, Siegel H, Gerth M,
Leipe T, Jansen E. 2012.Impact of climate change on the Baltic Sea ecosystem over
the past 1,000 years.Nature Climate Change2:871–874DOI 10.1038/nclimate1595.
Kaitala S, Hällfors S, Maunula P. 2010.Phytoplankton biomass and species succession in
the Gulf of Finland, Northern Baltic Proper and Southern Baltic Sea in 2010. HEL-COM Baltic Sea Environment Fact Sheets.Available athttp:// helcom.fi/ Documents/ Balticseatrends/ Environmentfactsheets/ (accessed 21 January 2015).
Kanehisa M, Goto S, Sato Y, Furumichi M, Tanabe M. 2012.KEGG for integration
and interpretation of large-scale molecular data sets.Nucleic Acids Research
40:D109–D114DOI 10.1093/nar/gkr988.
Kearse M, Moir R, Wilson A, Stones-Havas S, Cheung M, Sturrock S, Buxton S, Cooper A, Markowitz S, Duran C, Thierer T, Ashton B, Meintjes P, Drummond
A. 2012.Geneious Basic: an integrated and extendable desktop software platform
for the organization and analysis of sequence data.Bioinformatics28:1647–1649 DOI 10.1093/bioinformatics/bts199.
Keyhani NO, Roseman S. 1999.Physiological aspects of chitin catabolism in marine
bacteria.Biochimica et Biophysica Acta (BBA)-General Subjects1473:108–122 DOI 10.1016/S0304-4165(99)00172-5.
Knittel K, Boetius A. 2009.Anaerobic oxidation of methane: progress with an Unknown
process.Annual Review of Microbiology 63:311–334 DOI 10.1146/annurev.micro.61.080706.093130.
Labbate M, Case RJ, Stokes HW. 2009.The integron/gene cassette system: an
ac-tive player in bacterial adaptation.Methods in Molecular Biology532:103–125 DOI 10.1007/978-1-60327-853-9_6.
Leipe T, Tauber F, Vallius H, Virtasalo J, Uścinowicz S, Kowalski N, Hille S, Lindgren
S, Myllyvirta T. 2011.Particulate organic carbon (POC) in surface sediments of the
Baltic Sea.Geo-Marine Letters31:175–188DOI 10.1007/s00367-010-0223-x.
Lepland A, Stevens RL. 1998.Manganese authigenesis in the Landsort Deep, Baltic Sea.
Marine Geology151:1–25DOI 10.1016/S0025-3227(98)00046-2.
Lösekann T, Knittel K, Nadalig T, Fuchs B, Niemann H, Boetius A, Amann R. 2007.
Diversity and abundance of aerobic and anaerobic methane oxidizers at the
Haakon Mosby Mud Volcano, Barents Sea.Applied and Environmental Microbiology
73:3348–3362DOI 10.1128/AEM.00016-07.
Meier HEM, Andersson HC, Eilola K, Gustafsson BG, Kuznetsov I, Müller-Karulis B,
Neumann T, Savchuk OP. 2011.Hypoxia in future climates: a model ensemble study
for the Baltic Sea.Geophysical Research Letters38:L24608.
Meyer F, Paarmann D, D’Souza M, Olson R, Glass EM, Kubal M, Paczian T, Rodriguez
A, Stevens R, Wilke A, Wilkening J, Edwards RA. 2008.The metagenomics RAST
Mulo P, Sakurai I, Aro E-M. 2012.Strategies for psbA gene expression in cyanobacteria, green algae and higher plants: from transcription to PSII repair.Biochimica et Bio-physica Acta (BBA)—Bioenergetics1817:247–257 DOI 10.1016/j.bbabio.2011.04.011.
Nymark M, Valle KC, Hancke K, Winge P, Andresen K, Johnsen G, Bones AM, Brembu
T. 2013.Molecular and photosynthetic responses to prolonged darkness and
sub-sequent acclimation to re-illumination in the diatom phaeodactylum tricornutum.
PLoS ONE8:e58722DOI 10.1371/journal.pone.0058722.
Orsi WD, Edgcomb VP, Christman GD, Biddle JF. 2013.Gene expression in the deep
biosphere.Nature499:205–208DOI 10.1038/nature12230.
Overbeek R, Begley T, Butler RM, Choudhuri JV, Chuang HY, Cohoon M, De Crecy-Lagard V, Diaz N, Disz T, Edwards R, Fonstein M, Frank ED, Gerdes S, Glass EM, Goesmann A, Hanson A, Iwata-Reuyl D, Jensen R, Jamshidi N, Krause L, Kubal M, Larsen N, Linke B, McHardy AC, Meyer F, Neuweger H, Olsen G, Olson R, Osterman A, Portnoy V, Pusch GD, Rodionov DA, Ruckert C, Steiner J, Stevens R,
Thiele I, Vassieva O, Ye Y, Zagnitko O, Vonstein V. 2005.The subsystems approach
to genome annotation and its use in the project to annotate 1000 genomes.Nucleic Acids Research33:5691–5702DOI 10.1093/nar/gki866.
Patterson-Fortin LM, Colvin KR, Owttrim GW. 2006.A LexA-related protein regulates
redox-sensitive expression of the cyanobacterial RNA helicase, crhR.Nucleic Acids Research34:3446–3454DOI 10.1093/nar/gkl426.
Ploug H, Grossart H-P. 2000.Bacterial growth and grazing on diatom aggregates:
respiratory carbon turnover as a function of aggregate size and sinking velocity.
Limnology and Oceanography45:1467–1475DOI 10.4319/lo.2000.45.7.1467.
Prezza N, Fabbro CD, Vezzi F, Paoli ED, Policriti A. 2012. ERNE-BS5: aligning
BS-treated sequences by multiple hits on a 5-letters alphabet. In:Proceedings of the ACM conference on bioinformatics, computational biology and biomedicine. Orlando: ACM, 12–19.
Quast C, Pruesse E, Yilmaz P, Gerken J, Schweer T, Yarza P, Peplies J, Glöckner FO.
2013.The SILVA ribosomal RNA gene database project: improved data processing
and web-based tools.Nucleic Acids Research41:D590–D596 DOI 10.1093/nar/gks1219.
Redder P, Hausmann S, Khemici V, Yasrebi H, Linder P. 2015.Bacterial versatility
requires DEAD-box RNA helicases.FEMS Microbiology Reviews39:392–412 DOI 10.1093/femsre/fuv011.
Rho M, Tang H, Ye Y. 2010.FragGeneScan: predicting genes in short and error-prone
reads.Nucleic Acids Research38:e191DOI 10.1093/nar/gkq747.
Rosewarne CP, Pettigrove V, Stokes HW, Parsons YM. 2010.Class 1 integrons in
benthic bacterial communities: abundance, association with Tn402-like transpo-sition modules and evidence for coselection with heavy-metal resistance.FEMS Microbiology Ecology72:35–46DOI 10.1111/j.1574-6941.2009.00823.x.
Sarthou G, Timmermans KR, Blain S, Tréguer P. 2005.Growth physiology and fate of
Schimel J, Balser TC, Wallenstein M. 2007.Microbial stress-response physiology and its implications for ecosystem function.Ecology88:1386–1394DOI 10.1890/06-0219.
Schmale O, Schneider von Deimling J, Gülzow W, Nausch G, Waniek JJ, Rehder G.
2010.Distribution of methane in the water column of the Baltic Sea.Geophysical
Research Letters37:L12604.
Schulz MH, Zerbino DR, Vingron M, Birney E. 2012.Oases: robust de novo RNA-seq
assembly across the dynamic range of expression levels.Bioinformatics28:1086–1092 DOI 10.1093/bioinformatics/bts094.
Sinkko H, Lukkari K, Sihvonen LM, Sivonen K, Leivuori M, Rantanen M, Paulin L,
Lyra C. 2013.Bacteria contribute to sediment nutrient release and reflect progressed
eutrophication-driven hypoxia in an organic-rich continental sea.PLoS ONE
8:e67061DOI 10.1371/journal.pone.0067061.
SMHI. 2014.Swedish National Marine Data Archive.Available athttp:// produkter.smhi.
se/ pshark/ datamap_nationell.php?language=e(accessed 21 January 2015).
Spain AM, Elshahed MS, Najar FZ, Krumholz LR. 2015.Metatranscriptomic analysis
of a high-sulfide aquatic spring reveals insights into sulfur cycling and unexpected aerobic metabolism.PeerJ3:e1259DOI 10.7717/peerj.1259.
Stal LJ, Moezelaar R. 1997.Fermentation in cyanobacteria.FEMS Microbiology Reviews
21:179–211DOI 10.1016/S0168-6445(97)00056-9.
Stramma L, Johnson GC, Sprintall J, Mohrholz V. 2008.Expanding oxygen-minimum
zones in the tropical oceans.Science320:655–658 DOI 10.1126/science.1153847.
Thompson JD, Higgins DG, Gibson TJ. 1994.CLUSTAL W: improving the sensitivity
of progressive multiple sequence alignment through sequence weighting, position-specific gap penalties and weight matrix choice.Nucleic Acids Research22:4673–4680 DOI 10.1093/nar/22.22.4673.
Thureborn P, Lundin D, Plathan J, Poole AM, Sjöberg B-M, Sjöling S. 2013.A
metage-nomics transect into the deepest point of the baltic sea reveals clear stratification of microbial functional capacities.PLoS ONE8:e74983DOI 10.1371/journal.pone.0074983.
Tripp HJ, Hewson I, Boyarsky S, Stuart JM, Zehr JP. 2011.Misannotations of rRNA
can now generate 90% false positive protein matches in metatranscriptomic studies.
Nucleic Acids Research39:8792–8802DOI 10.1093/nar/gkr576.
Urich T, Lanzén A, Stokke R, Pedersen RB, Bayer C, Thorseth IH, Schleper C, Steen
IH, Øvreas L. 2014.Microbial community structure and functioning in marine
sediments associated with diffuse hydrothermal venting assessed by integrated meta-omics.Environmental Microbiology16:2699–2710DOI 10.1111/1462-2920.12283.
Wilke A, Harrison T, Wilkening J, Field D, Glass EM, Kyrpides N, Mavrommatis K,
Meyer F. 2012.The M5nr: a novel non-redundant database containing protein
sequences and annotations from multiple sources and associated tools.BMC Bioinformatics13:141DOI 10.1186/1471-2105-13-141.
Wright MS, Baker-Austin C, Lindell AH, Stepanauskas R, Stokes HW, McArthur JV.
2008.Influence of industrial contamination on mobile genetic elements: class 1
integron abundance and gene cassette structure in aquatic bacterial communities.
Yamada T, Letunic I, Okuda S, Kanehisa M, Bork P. 2011.iPath2.0: interactive pathway explorer.Nucleic Acids Research39:W412–W415DOI 10.1093/nar/gkr313.
Zerbino DR, Birney E. 2008.Velvet: algorithms for de novo short read assembly using de
Bruijn graphs.Genome Research18:821–829DOI 10.1101/gr.074492.107.
Zillén L, Conley D. 2010.Hypoxia and cyanobacteria blooms-are they really natural