OSD
12, 2395–2421, 2015Effects of lateral processes on the
seasonal water stratification of the
Gulf of Finland
R. E. Vankevich et al.
Title Page
Abstract Introduction
Conclusions References
Tables Figures
◭ ◮
◭ ◮
Back Close
Full Screen / Esc
Printer-friendly Version Interactive Discussion
Discussion
P
a
per
|
Discussion
P
a
per
|
Discussion
P
a
per
|
Discussion
P
a
per
|
Ocean Sci. Discuss., 12, 2395–2421, 2015 www.ocean-sci-discuss.net/12/2395/2015/ doi:10.5194/osd-12-2395-2015
© Author(s) 2015. CC Attribution 3.0 License.
This discussion paper is/has been under review for the journal Ocean Science (OS). Please refer to the corresponding final paper in OS if available.
E
ff
ects of lateral processes on the
seasonal water stratification of the Gulf of
Finland: 3-D NEMO-based model study
R. E. Vankevich1,2, E. V. Sofina1,2, T. E. Eremina1, A. V. Ryabchenko2, M. S. Molchanov1, and A. V. Isaev1,2
1
Russian State Hydrometeorological University, Saint-Petersburg, Russia
2
The St.-Petersburg Branch of the P. P. Shirshov Institute of Oceanology of the Russian Academy of Sciences, Saint-Petersburg, Russia
Received: 27 August 2015 – Accepted: 9 September 2015 – Published: 12 October 2015 Correspondence to: R. E. Vankevich ([email protected])
OSD
12, 2395–2421, 2015Effects of lateral processes on the
seasonal water stratification of the
Gulf of Finland
R. E. Vankevich et al.
Title Page
Abstract Introduction
Conclusions References
Tables Figures
◭ ◮
◭ ◮
Back Close
Full Screen / Esc
Printer-friendly Version Interactive Discussion
Discussion
P
a
per
|
Discussion
P
a
per
|
Discussion
P
a
per
|
Discussion
P
a
per
|
Abstract
This paper tries to fill the gaps in knowledge of processes affecting the seasonal water stratification in the Gulf of Finland (GOF). We used state-of-the-art modeling frame-work NEMO aimed for oceanographic research, operational oceanography, seasonal forecasting and climate studies to build an eddy resolving model of the GOF. To eval-5
uate the model skill and performance two different solutions where obtained on 0.5 km eddy resolving and commonly used 2 km grids for one year simulation. We also explore the efficacy of nonhydrostatic effect (convection) parameterizations available in NEMO for coastal application. It is found that the solutions resolving sub-mesoscales have a more complex mixed layer structure in the regions of GOF directly affected by the 10
upwelling/downwelling and intrusions from the open Baltic Sea. Presented model esti-mations of the upper mixed layer depth are in a good agreement with in situ CTD data. A number of model sensitivity tests to the vertical mixing parameterization confirm the model robustness.
1 Introduction
15
The Gulf of Finland (GOF) is a 400 km long and 48–135 km wide sub-basin of the Baltic Sea with a mean depth of 37 m and complex bathymetry. The large fresh input from Neva River significantly affects the stratification and forms the strong salinity gradient from east to west and from north to south. Sea-surface salinity decreases from 5 to 6.5 ‰ in the western GOF to about 0–3 ‰ in the easternmost part of the Gulf where 20
the role of the Neva River is most pronounced (Alenius et al., 1998). In the western GOF, a quasi-permanent halocline is located at a depth of 60–80 m. Salinity in that area can reach values as high as 8–10 ‰ near the sea bed due to the advection of saltier water masses from the Baltic Proper.
The vertical stratification in the GOF as well as in the Baltic Sea is unusual (the ther-25
OSD
12, 2395–2421, 2015Effects of lateral processes on the
seasonal water stratification of the
Gulf of Finland
R. E. Vankevich et al.
Title Page
Abstract Introduction
Conclusions References
Tables Figures
◭ ◮
◭ ◮
Back Close
Full Screen / Esc
Printer-friendly Version Interactive Discussion
Discussion
P
a
per
|
Discussion
P
a
per
|
Discussion
P
a
per
|
Discussion
P
a
per
|
halocline, whereas the temperature is largely controlled by the seasonal variability of the surface heat fluxes (see e.g. Hankimo, 1964). During the summer season the water column in the deeper areas of the GOF consists of the three layers – the upper mixed layer (UML), the cold intermediate layer (CIL) and a saltier and slightly warmer near-bottom layer, separated by two pycnoclines – the thermocline at the depths of 10–20 m 5
and the permanent halocline at the depths of 60–70 m. A seasonal thermocline starts to develop in May. The surface mixed layer reaches a maximum depth of 15–20 m by midsummer and an erosion of the thermocline starts in late August due to wind mixing and thermal convection. The bottom salinity also shows significant spatiotemporal vari-ability due to irregular saline water intrusions from the Baltic Proper, as well as from 10
changes in river runoffand the precipitation-evaporation balance. There is no perma-nent halocline in the eastern GOF, where salinity increases approximately linearly with depth (Nekrasov and Lebedeva, 2002; Alenius et al., 2003).
The simulations of the vertical stratification using 3-D numerical models are not so reliable yet (Myrberg et al., 2010). This study shows that the best existing 3-D scientific 15
circulation models are able to simulate the major features of the hydro-physical fields of the GOF. For example, the hind-cast mean temperatures differ from observations by less than 1–2◦C and the mean error in salinity is less than 1 ‰. Most of the remaining difficulties are connected with problems in adequately representing the dynamics of the mixed layer. The loss of accuracy is most notable in the simulation of the depth and the 20
sharpness of the corresponding thermo- and haloclines. Despite the application of so-phisticated turbulent closure schemes and different schemes for vertical mixing, none of the models, analyzed in Myrberg et al. (2010), were able to accurately simulate the vertical profiles of temperature and salinity. Latest experiments with turbulence param-eterizations of 3-D hydrodynamic model COHERENS presented in Tuomi et al. (2013) 25
OSD
12, 2395–2421, 2015Effects of lateral processes on the
seasonal water stratification of the
Gulf of Finland
R. E. Vankevich et al.
Title Page
Abstract Introduction
Conclusions References
Tables Figures
◭ ◮
◭ ◮
Back Close
Full Screen / Esc
Printer-friendly Version Interactive Discussion
Discussion
P
a
per
|
Discussion
P
a
per
|
Discussion
P
a
per
|
Discussion
P
a
per
|
speed only slightly improved the performance of the turbulence parameterizations in modelling the thermocline depth.
However, a number of studies have reported important effects of the vertical ther-mohaline structure on the characteristics and processes in the marine ecosystems of the GOF, such as phytoplankton species composition (Rantajarvi et al., 1998) and sub-5
surface maxima of phytoplankton biomass (Lips et al., 2010), cyanobacteria blooms (Lips et al., 2008), distribution of pelagic fish (Stepputtis et al., 2011), macrozooben-thos abundance (Laine et al., 2007) and oxygen concentrations in the near bottom layer (Maximov, 2006).
Summarizing all written above, prediction of the thermohaline structure is a com-10
plex problem for the GOF. The spatial variability of thermohaline structure encompass a wide range of physical processes at different scales, some of which are still poorly understood (Soomere et al., 2008, 2009). For example, we believe that the local strati-fication depends very strongly a on the across GOF movements of water masses and sub-mesoscale eddies generated by baroclinic instability of fronts in upper layers of the 15
sea play an important role in heterogeneity of spatial distribution of parameters (tem-perature, nutrients, phytoplankton) but also they can act to re-stratify the UML ocean, as described in Gent and McWilliams (1990).
In the ocean, submesoscales are scales of motion equal or less than the Rossby radius of deformation but large enough to be influenced by planetary rotation (Thomas 20
et al., 2007). Recent studies showed that increasing the horizontal resolution of the model up to 0.5 km (for the GOF Rossby radius aprox. 2–4 km) enables mod-els to resolve submesoscale eddies. As a result, surface currents and temperatures show highly detailed patterns that qualitatively match well with the expected features (Sokolov, 2013; Zhurbas et al., 2008). However, there was no yet considered the in-25
fluence of eddy motions and across Gulf movements of water masses on vertical re-stratification of the upper mixed layer of the GOF.
OSD
12, 2395–2421, 2015Effects of lateral processes on the
seasonal water stratification of the
Gulf of Finland
R. E. Vankevich et al.
Title Page
Abstract Introduction
Conclusions References
Tables Figures
◭ ◮
◭ ◮
Back Close
Full Screen / Esc
Printer-friendly Version Interactive Discussion
Discussion
P
a
per
|
Discussion
P
a
per
|
Discussion
P
a
per
|
Discussion
P
a
per
|
– to provide an insight into the submesoscale and basin-scale processes in the GOF. We are interested, in particular, in learning how lateral advection processes contribute to the thermocline variations.
– to assess the impact of horizontal grid resolution on the representation of vertical stratification.
5
2 Approach
Traditional point of view is that the eddy diffusion dominates in the horizontal direction and in the vertical direction mixing due to eddies is limited, and small scale processes such as turbulence provide the majority of mixing. Based on this idea most commonly 1-D approach is used to set up vertical mixing by tuning a turbulent scheme. For the 10
GOF as an enclosed basin with complex bathymetry and strong stratification mixed layer dynamics can be strongly affected by lateral advective processes. To investigate this phenomenon we present a state-of-the art three-dimensional model of the GOF with high vertical and two different horizontal resolutions. Shelf sea modelling is char-acterized by a demand for a many different configurations to meet multiple science 15
and user needs. NEMO gives the capability to rapidly configure shelf sea models using appropriate high resolutions and parameterizations on the representation of coastal dynamics.
2.1 General model set-up
Our study is based on a 3-D thermo-hydrodynamic model build on the NEMO (Nu-20
OSD
12, 2395–2421, 2015Effects of lateral processes on the
seasonal water stratification of the
Gulf of Finland
R. E. Vankevich et al.
Title Page
Abstract Introduction
Conclusions References
Tables Figures
◭ ◮
◭ ◮
Back Close
Full Screen / Esc
Printer-friendly Version Interactive Discussion
Discussion
P
a
per
|
Discussion
P
a
per
|
Discussion
P
a
per
|
Discussion
P
a
per
|
ments implemented in most ocean modeling platforms. The NEMO implementation for the GOF uses the TVD advection scheme in the horizontal direction, the piecewise parabolic method (PPM) in the vertical direction (Liu and Holt, 2010), the non-linear variable volume (VVL) scheme for the free surface. In the horizontal plane, the model uses the standard Jacobean formulation for the pressure gradient, the viscosity and dif-5
fusivity formulation with a constant coefficient for momentum and tracer diffusion. The horizontal viscosity and diffusivity operators are rotated to be aligned with the density iso-surfaces to accurately reproduce density flows.
In this paper, we used gridded bathymetric data set with a resolution of 0.25 nm for the GOF (Andrejev, 2010). Choosing different grid resolutions of the model is formally 10
equivalent to the choice of an appropriate averaging operator (low-pass filtering at the grid step) and an approach to estimate the contribution of smaller scales to the gen-eral motion. To assess the impact of submesoscale motion on the vertical stratification, two configurations of NEMO GOF were generated by utilizing different horizontal and the same vertical resolution of 1 m. Both configurations have 94 vertical levels, but 15
1 min zonal and 2 min meridional resolution (∼2 km) in a standard configuration and
0.25 min zonal and 0.5 min meridional resolution (∼0.5 km) in a finer resolution
config-uration. The parameters of configurations were kept as identical as possible. The main exception is the coefficients of horizontal diffusivity and viscosity which were set to the minimum values guaranteeing the numerical stability.
20
Numerical experiments were started from rest and initialized with temperature and salinity from operational model of Baltic Sea HIROMB (Funkquist, 2001). The compu-tational domain covers entire GOF with open boundary set at 23E longitude, boundary conditions being taken also from HIROMB. The model was forced by the surface forc-ing dataset HIRLAM (http://hirlam.org) (usforc-ing the CORE bulk forcforc-ing algorithm) and 25
OSD
12, 2395–2421, 2015Effects of lateral processes on the
seasonal water stratification of the
Gulf of Finland
R. E. Vankevich et al.
Title Page
Abstract Introduction
Conclusions References
Tables Figures
◭ ◮
◭ ◮
Back Close
Full Screen / Esc
Printer-friendly Version Interactive Discussion
Discussion
P
a
per
|
Discussion
P
a
per
|
Discussion
P
a
per
|
Discussion
P
a
per
|
2.2 Parameterization of convective flows
One of the possible mechanisms by which the lateral motion affects the stratification is a shear-induced convection: situation in which heavy water may be advected on top of lighter water. This mechanism has been observed, e.g. in the bottom boundary layer of lakes (Lorke et al., 2005) and on the continental shelf (Rippeth et al., 2001). Evidently, 5
the shear-induced convection can take place throughout the water column, for example, during upwelling. In nature, convective processes quickly re-establish the static stability of the water column (Umlauf, 2005). These processes have been removed from the model via the hydrostatic assumption so they must be parameterized.
To reproduce convective mixing by turbulent closure scheme NEMO offers: 10
(1) a computationally efficient solution “TKE scheme” in combination with convective adjustment procedures (a non-penetrative convective adjustment or an enhanced ver-tical diffusion) and (2) physically more accurate the “GLS scheme”.
The “TKE scheme” is a turbulence closure scheme proposed by Bougeault and Lacarrére (1989) originally developed to a model of the atmospheric boundary layer. In 15
the Mellor and Yamada (1974) hierarchy it is a 1.5-level closure and consists of a prog-nostic closure for the turbulent kinetic energy (TKE) and an algebraic formulation for the mixing length scale. The time evolution of TKE is the result of the production of TKE through vertical shear, its suppression through stratification, its vertical diffusion, and its dissipation of Kolmogorov (1942) type:
20
∂e ∂t =
Km e23
"
∂u ∂k
2
+
∂v ∂k
2#
−KρN2+ 1
e3 ∂ ∂k
K
e e3
∂e ∂k
−Cεe
3/2
lε
, (1)
Km=Cklk p
e, (2)
Kρ=Km/Prt (3)
OSD
12, 2395–2421, 2015Effects of lateral processes on the
seasonal water stratification of the
Gulf of Finland
R. E. Vankevich et al.
Title Page
Abstract Introduction
Conclusions References
Tables Figures
◭ ◮
◭ ◮
Back Close
Full Screen / Esc
Printer-friendly Version Interactive Discussion
Discussion
P
a
per
|
Discussion
P
a
per
|
Discussion
P
a
per
|
Discussion
P
a
per
|
is the vertical scale factor,Prt is the Prandtl number,Km andKρ are the vertical eddy
viscosity and diffusivity coefficients. The parameterCk is known as a stability function
and is defined as a constant in the TKE scheme. The constantsCk=0.1 andCε=0.7 are designed to deal with vertical mixing at any depth (Gaspar et al., 1990).Ke is the eddy diffusivity coefficient for the TKE. In NEMOKe=Km.
5
For computational efficiency, the original formulation of the turbulent length scales proposed by Gaspar et al. (1990) has been simplified to the following first order ap-proximation
lk=lε=p2e/N. (4)
This simplification valid in a stable stratified region with constant values of the buoyancy 10
frequency has two major drawbacks: it makes no sense for locally unstable stratifica-tion and the computastratifica-tion no longer uses all the informastratifica-tion contained in the vertical density profile. To overcome these drawbacks, NEMO TKE implementation adds an extra assumption concerning the vertical gradient of the computed length scale. So, the length scales are first evaluated as in Eq. (4) and then bounded such that:
15
1 e3
∂l ∂k
≤1, withl=lk=lε (5)
In order to impose the constraint Eq. (5), NEMO introduces two additional length scales: lup and ldwn. The length scales lup and ldwn are respectively the upward and downward distances to which a fluid parcel is able to travel from currentzlevelk, con-verting its TKE into the potential energy by doing work against the stratification, and 20
they can be evaluated as:
lup(k)=minl(k),lup(k+1)+e(3k) fromk=1 tonk (6)
ldwn(k) =min(l(k)l(k−1) dwn +e
(k−1)
OSD
12, 2395–2421, 2015Effects of lateral processes on the
seasonal water stratification of the
Gulf of Finland
R. E. Vankevich et al.
Title Page
Abstract Introduction
Conclusions References
Tables Figures
◭ ◮
◭ ◮
Back Close
Full Screen / Esc
Printer-friendly Version Interactive Discussion
Discussion
P
a
per
|
Discussion
P
a
per
|
Discussion
P
a
per
|
Discussion
P
a
per
|
wherenkis the number of level in vertical,l(k)is computed using Eq. (4), i.e.
l(k)=
q
2e(k)/N2(k). (8)
Finally,
lk=lε=min(lupldwn). (9)
The Generic Length Scale (GLS) scheme is formally equivalent to the TKE scheme, 5
excepting using: (1) a prognostic equation for the generic length scaleφand (2) ex-pressions for the complex stability functions instead constants. We usedk−εturbulent
closure scheme (Rodi, 1987) with itsφ=C30µe3/2l−1
, whereC0µis a constant
depend-ing on the choice of the stability function (Galperin et al., 1988; Kantha and Clayson, 1994).
10
This prognostic length scale is valid for convective situations and arbitrary increase diffusivity to represent convection (Umlauf and Burchard, 2003, 2005):
∂φ ∂t =
φ e
(
C1Km
σφe3
"
∂u
∂k
2
+
∂v
∂k
2#
−C3KρN2−C2ε )
+ 1
e3 ∂ ∂k
K
m
e3 ∂φ
∂k
(10)
Km=Cµpel, (11)
Kρ=Cµ′
p
el, (12)
15
ε=C0µe
3/2
l−1, (13)
Here C1, C2,C3, σφ are constants for the k−εturbulent closure scheme. They are
equal 1.44, 1.92, 1.0, 1.3 respectively. Cµ and Cµ′ are calculated from the stability function.
As known, the equation fails in stably stratified flows, and for this reason almost all 20
OSD
12, 2395–2421, 2015Effects of lateral processes on the
seasonal water stratification of the
Gulf of Finland
R. E. Vankevich et al.
Title Page
Abstract Introduction
Conclusions References
Tables Figures
◭ ◮
◭ ◮
Back Close
Full Screen / Esc
Printer-friendly Version Interactive Discussion
Discussion
P
a
per
|
Discussion
P
a
per
|
Discussion
P
a
per
|
Discussion
P
a
per
|
maximum permissible length scale is determined by
lmax=Clim
p
2e/N. (14)
A value ofClim=0.53 is often used (Galperin et al., 1988). Umlauf and Burchard (2005) show that the value of the clipping factor is of crucial importance for the entrainment depth predicted in stably stratified situations. Another value is 0.26, several authors 5
have suggested limiting the dissipative length-scale in the presence of stable stratifica-tion even down to 0.07 (Holt and Umlauf, 2008).
In addition, convective mixing can be parameterized in NEMO by an enhancement to the eddy viscosity and diffusivity (ED), when forN2<0,Km andKρare locally set to the value of 100 m2s−1.
10
We performed comparative tests of listed above convection parameterizations to in-vestigate their principal applicability for shear-induced convective situations.
3 Numerical experiments
The modeling period were chosen from 1 April to 31 August 2011 when pronounced thermocline occurs. The thermocline starts its formation in early May when the heating 15
and turbulent mixing are dominant processes. Note that year 2011 was characterized by strong upwelling events in the beginning and in the end of modeling period.
In Sect. 2.1 the GLS, TKE and ED mixing parameterizations are compared in a series of sensitivity experiments. The choice of closure scheme and the effects of varying Galperin limit were investigated against MODIS SST to get the best reproduction of 20
SST pattern.
In Sect. 2.2 we present results of the model runs compared with available CTD data to study the performance of the chosen parameterizations to represent the UML evolu-tion. Also the ability of the model to correctly capture such features as fronts was tested against SST images for different resolutions in beginning of August 2011 when there 25
OSD
12, 2395–2421, 2015Effects of lateral processes on the
seasonal water stratification of the
Gulf of Finland
R. E. Vankevich et al.
Title Page
Abstract Introduction
Conclusions References
Tables Figures
◭ ◮
◭ ◮
Back Close
Full Screen / Esc
Printer-friendly Version Interactive Discussion
Discussion
P
a
per
|
Discussion
P
a
per
|
Discussion
P
a
per
|
Discussion
P
a
per
|
3.1 Sensitivity to vertical mixing parameterizations
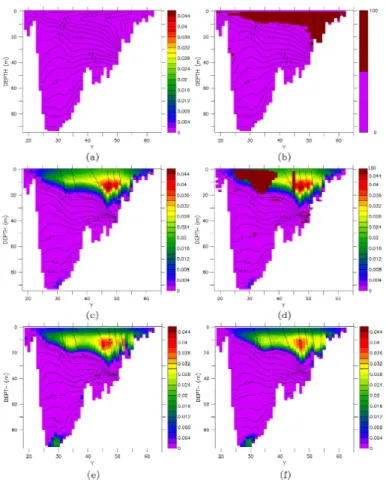
In this section we study closure schemes and enhanced diffusion parameterization performance for convective situations caused by upwelling near the Estonian coast stated on 12 May. Figure 1 shows a cross section of the GOF for the density field (black isolines) overlaid by the vertical eddy diffusivity coefficient (color filled).
5
Fragment A of Fig. 1 illustrate the mechanism instability formation. It is a gipotertic solution obtained with constant eddy diffusivity coefficients set to the minimum possible for this case values of 10−4–10−5m2c−1and ED switched off. All cross-sections present the situation mainly formed by an upwelling event near the Estonian coast (left side of the cross-section). Due to the presence of permanent density gradient from Estonian to 10
Finish coast and strong offshore current caused by upwelling, dense waters originated from the Estonian side overlay more fresh lighter water in the downwelling area near the Finish coast.
Fragment B illustrates the performance of the ED procedure setting the eddy viscos-ity and diffusivity coefficients equal to 100 m2s−1in the areas of unstable stratification. 15
According to this experiment, the maximum depth of convection penetration is equal to 10 m in the center of GOF and reaches up to 25 m near the Finish coast.
Fragment C illustrates the performance of solution with the TKE closure scheme in-cluding previously described modifications introduced in NEMO. As seen, the solution demonstrates high values of eddy diffusion coefficients in the areas of unstable stratifi-20
cation. The depth of the mixed layer is not limited by the convection penetration depth (see Fig. 1b) and formed as a result of a joint action of current velocity shear, buoyancy and TKE diffusion and dissipation (see Eq. 1).
Fragment D shows the combined effect of cases B and C. As seen from comparison of Fig. 1d and c, the solution with modified TKE scheme captures most of the existing 25
OSD
12, 2395–2421, 2015Effects of lateral processes on the
seasonal water stratification of the
Gulf of Finland
R. E. Vankevich et al.
Title Page
Abstract Introduction
Conclusions References
Tables Figures
◭ ◮
◭ ◮
Back Close
Full Screen / Esc
Printer-friendly Version Interactive Discussion
Discussion
P
a
per
|
Discussion
P
a
per
|
Discussion
P
a
per
|
Discussion
P
a
per
|
Fragments E and F present the performance of the solution with the GLS closure scheme with Galperin limit of 0.53 and 0.26, correspondently. A solution with GLS parameterization with switched-offlength scale limitation was also obtained but turned out to be practically equal to the case E. UML depth in these solutions is comparable to that in the cases C and D confirming success of TKE modifications in NEMO. 5
The above tests confirm that both TKE and GLS closure schemes used in NEMO are able to catch the convection induced by upwelling. As it comes from Fig. 1 an instability of vertical column initiates dramatic increasing in vertical diffusivity coefficients up to 0.04 m2s−1 TKE (Fig. 1c and d) or 0.036 m2s−1 GLS (Fig. 1e and f) from the back-ground value set to 10−6m2s−1. TKE scheme forms a core with stronger mixing in the 10
area of downwelling but at the same time the UML depth is comparable in both cases. Switched on ED do not modify UML depth predicted by turbulent closure schemes.
Evaluation of the actual performance of presented alternative parameterizations of convective processes is a complex task requiring high spatial and temporal resolution of in situ data that is not available at the moment. The sea surface temperature (SST) 15
derived from the satellite thermal infrared imagery during cloud-free conditions pro-vides significant information for monitoring of the relevant key ocean structures, such as fronts, eddies, and upwelling. At the same time, the SST fields can be used as an indicator of vertical mixing processes. As soon as we would get a realistic stratification, the surface pattern of simulated SST will also be in agreement with remotely observed 20
SST.
Results of the comparison of modeled (various mixing parameterizations and reso-lutions) and MODIS-derived SST are presented at Fig. 2. The model shows that max-imum upwelling development occurs on 14 May when the upwelling front reaches the center of the GOF and characterized by maximum temperature gradient across the 25
front up to 5◦C. Unfortunately, due to heavy cloudiness, the satellite images captured only relaxation phase of the upwelling dated on 20 May.
OSD
12, 2395–2421, 2015Effects of lateral processes on the
seasonal water stratification of the
Gulf of Finland
R. E. Vankevich et al.
Title Page
Abstract Introduction
Conclusions References
Tables Figures
◭ ◮
◭ ◮
Back Close
Full Screen / Esc
Printer-friendly Version Interactive Discussion
Discussion
P
a
per
|
Discussion
P
a
per
|
Discussion
P
a
per
|
Discussion
P
a
per
|
of mixing and increased SST values compared to MODIS data. On the other hand, the solution obtained with TKE scheme underestimates mixing, nevertheless it is not too far from the observations. The best performance takes place at the higher resolution and GLS scheme used when the solution is in a good agreement with the MODIS SST (Fig. 2b). Based on presented sensitivity tests, the GLS mixing scheme was chosen 5
and the length scale limiting was fixed asClim=0.53
3.2 General model performance
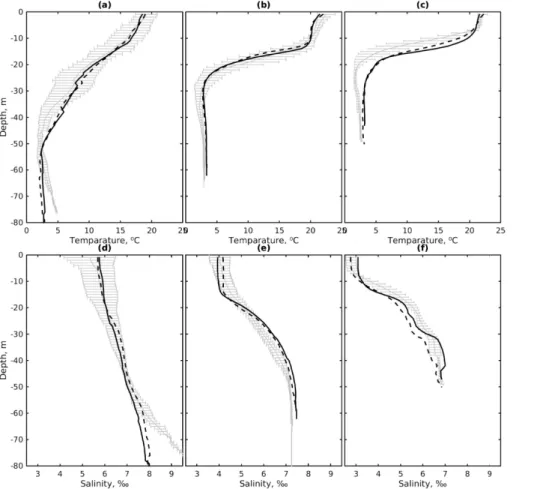
To evaluate the general model performance, we used in situ data for temperature and salinity obtained during Russian state hydrometeorological institute expedition dated from 20 July 2011 to 5 August 2011. The comparison of model and data has been per-10
formed for the last decade of July just before the UML starts to degrade due to heating and wind conditions (Fig. 3). CTD data were grouped into three sets of profiles repre-senting western (Lat 23:26, 10 profiles), central (Lat 26:28.2, 12 profiles) and eastern (Lat 28.2:30, 12 profiles) parts of the GOF. According to the presented at Fig. 3 aver-aged CTD profiles (black curves), the UML is much deeper in the western part of the 15
GOF and considerably shallower and sharper in the central and eastern parts. This UML behavior typical for the GOF captured quite well by all the model realizations (colored curves). Standard deviation of CTD data given as error bars presents the vari-ability corridor of in situ data. All presented solutions with different parameterizations are in good agreement with the data in terms of the UML depth while the fine spatial 20
resolution slightly better represents the nature in the western part of GOF. In the east-ern part of GOF strongly influenced by the Neva outflow the modeled thermocline is about 5 m deeper than observed. This is mainly due to prescribing climatic boundary conditions at the river mouth not allowing for the differences in individual years and complicated hydrodynamics of the estuary.
25
OSD
12, 2395–2421, 2015Effects of lateral processes on the
seasonal water stratification of the
Gulf of Finland
R. E. Vankevich et al.
Title Page
Abstract Introduction
Conclusions References
Tables Figures
◭ ◮
◭ ◮
Back Close
Full Screen / Esc
Printer-friendly Version Interactive Discussion
Discussion
P
a
per
|
Discussion
P
a
per
|
Discussion
P
a
per
|
Discussion
P
a
per
|
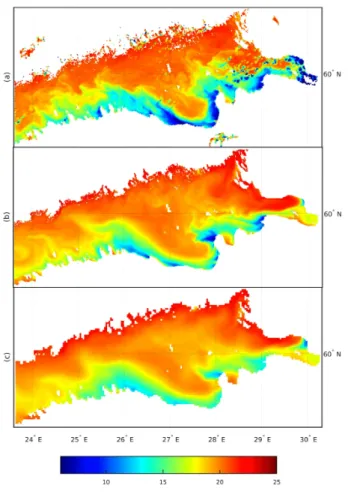
high resolution model solution the temperature of cold water rising to the surface drops down to 6◦C that is consistent with the satellite SST. In the case of coarse resolution the upwelling effect is less pronounced: the lowest temperature in the core region is about 10◦C. Solutions with both resolutions reproduce spatial patterns of upwelling. Although the coarse resolution solution gives more flattened upwelling front (shown by 5
the isotherm of 19.5◦C), high resolution solution is more rugged due to reproduced submesoscale features that corresponds well with observed SST.
Results of model comparison with SST and in situ data confirm the robustness of the developed model, which allows us to use it in a more detailed evaluation of the vertical structure formation mechanisms of the sea and it’s temporal evolution.
10
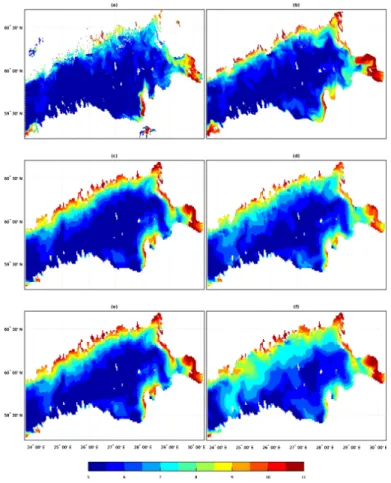
4 Results
During the upwelling/downwelling event in May model on both grids simulates a sub-stantial re-stratification of the UML. The re-stratification is characterized by sharpen-ing and at the same time deepensharpen-ing of the thermocline down to 40 m near the Finish coast and export of the cold water to the surface near the Estonian coast (Fig. 5). 15
Figure 5a and b shows maps of the turbocline depth on the 16 May 2011. The tur-bocline depth is defined as the depth at which the vertical eddy diffusivity coefficient falls below a given value (here taken equal to background value of 5 cm2s−1) and can be interpreted as a maximum penetration depth of the turbulent motion in the surface layer.
20
According to Fig. 5a and b presenting solutions on 2 and 0.5 km grids correspon-dently, the turbocline depth reaches the maximum in the areas near the Finnish coast where the convection is a dominant factor in vertical mixing. We can note the significant differences in the spatial patterns of the turbocline for fine and rough resolutions. Solu-tion on 0.5 km grid shows deeper and more complex thermocline paten. It can be ex-25
OSD
12, 2395–2421, 2015Effects of lateral processes on the
seasonal water stratification of the
Gulf of Finland
R. E. Vankevich et al.
Title Page
Abstract Introduction
Conclusions References
Tables Figures
◭ ◮
◭ ◮
Back Close
Full Screen / Esc
Printer-friendly Version Interactive Discussion
Discussion
P
a
per
|
Discussion
P
a
per
|
Discussion
P
a
per
|
Discussion
P
a
per
|
2007) acting to locally restratify UML. The model with 2 km resolution cannot resolve submesoscale frontal features and high values (compare to fine resolution) of lateral diffusion coefficients act to smooth the front in other words decreasing potential energy of the front. Unfortunately, few data is available for validation of these differences. Loca-tions of CTD profiles on 16 May are marked as points I, II, III in Fig. 5a and c. However, 5
the UML depth for the 2 km model are not deep enough, barely reaching 25 m depth everywhere whereas observations in western part show it values reaching a maximum of about 40 m depth.
Figure 6 presents evolution of the thermocline through the season. Left panels present the maximum depth of the turbolcline and thermocline for the May when the 10
thermocline was formed. Right panels present also maximum turbolcline and thermo-cline depths but for the period from 1 June to 28 July. This period ends just before the upwelling in July–August from which the UML erosion begins. Thermocline depth was defined as the depth of 3.5◦C isotherm (see Fig. 3). As it comes from the presented data, turbulent mixing during the upwelling in May was the strongest throughout the 15
season (see Fig. 6b). At the same time increasing of the 3.5◦C isotherm depth up to 45 m during June–July is not accomplished by any considerable turbulent activity (maximum turbocline depth during June–July do not exceed 20 m for the most of the territory of the GOF). Taking in consideration the low value of the background vertical diffusivity coefficient (10−6m2s−1), this fact highlights the importance of the advective 20
processes for the formation of the shape and depth of the thermocline. Advective pro-cesses resulting in deepening of the isotherm are initiated by intrusion of warm dense water from the open boundary from the Baltic Proper. The intrusion compensates the general surface outflow from the GOF caused by rivers runoff. Notable difference in the shape of averaged profiles presented at Fig. 3 confirm this hypothesis. Eastern 25
OSD
12, 2395–2421, 2015Effects of lateral processes on the
seasonal water stratification of the
Gulf of Finland
R. E. Vankevich et al.
Title Page
Abstract Introduction
Conclusions References
Tables Figures
◭ ◮
◭ ◮
Back Close
Full Screen / Esc
Printer-friendly Version Interactive Discussion
Discussion
P
a
per
|
Discussion
P
a
per
|
Discussion
P
a
per
|
Discussion
P
a
per
|
to 45 m in the western part of GOF is caused mainly by the GOF-Baltic Sea exchange processes since turbulent mixing do not penetrate at this depth here.
The sensitivity of the model solution to increased horizontal resolution manifested in the different intrusion propagation to east (compare right plots on Fig. 6d and f). Density fronts associated with the intrusion are a source of baroclinic instability which 5
are differently resolved by the 0.5 km eddy permitting configuration (Fig. 6c) compared to 2 km configuration (Fig. 6e).
5 Discussion and conclusions
We used state-of-the-art modeling framework NEMO initially developed for the open ocean to build an eddy resolving model of the GOF. To evaluate the model skill and 10
performance two different solutions where obtained: commonly used 2 km grid and 0.5 km eddy resolving fine grid. Refinement below this level at shelf scale would be of limited benefit in a hydrostatic model. Increased model resolution was found to better capture the position and strength of the SST front. Moreover, instabilities along the front led to large temporal and spatial variability of UML in the high resolution model. The 15
role of submesoscale flows in setting stratification in the upper ocean over the annual cycle has been investigated.
Hydrostatic hypothesis removes convective processes from the initial Navier–Stokes equations and so convective processes must be parameterized instead. In this study we used available in NEMO parameterizations of convective processes to reproduce 20
the interaction of small-scale baroclinic instabilities with turbulent mixing in the frame of the hydrostatic assumption. We explore the efficacy of convection parameterizations available in NEMO and found that GLS or even modified TKE closure schemes can de-scribe convective processes in UML of GOF without additional convective adjustment procedures.
25
OSD
12, 2395–2421, 2015Effects of lateral processes on the
seasonal water stratification of the
Gulf of Finland
R. E. Vankevich et al.
Title Page
Abstract Introduction
Conclusions References
Tables Figures
◭ ◮
◭ ◮
Back Close
Full Screen / Esc
Printer-friendly Version Interactive Discussion
Discussion
P
a
per
|
Discussion
P
a
per
|
Discussion
P
a
per
|
Discussion
P
a
per
|
by the upwelling/downwelling. It is noteworthy that data coverage may not be enough to outline the differences in behavior of the model resolutions.
Increasing of resolution also leads to an increase in the propagation distance of intrusions from the Baltic Proper. This fact should be deeply investigated by excluding of possible boundary effects: for example, through a shift of the open boundary to the 5
west or running the model for entire Baltic Sea.
Since the time period of the runs was rather short (less than 1 year) and the model had not been used before it is obvious that choose of some parameters might have been somewhat improper for the use in this study. Through fine tuning of the model better results could be probably obtained. However, the focus in this study was to ex-10
amine the differences arising from different horizontal resolutions, the fact that model parameters were similar in each case should be considered to be far more important than the quantitative agreement between observations and model results. Actually, it was shown that the model results for both resolutions are in a reasonable agreement with available observations.
15
It has been clearly demonstrated that a combined analysis of observations, in our case of remote sensing data, and the results of numerical modeling, is superior to single methods alone in many ways. The usage of results of hydrodynamic model-ing together with SST information can provide an extended analysis and deeper un-derstanding of the upwelling process. Convection induced by upwelling in the surface 20
layer promotes to re-stratification of the UML and results in changes of the SST pattern observed from satellites. Lateral movements induced by upwelling lead to consider-able re-stratification of the GOF. Our results unambiguously suggest the occurrence of shear-induced convection in stratified waters of GOF which is characterized by pres-ence of permanent lateral density gradient in the north–south direction. This is a poten-25
tially important mixing mechanism that has yet to be explored in detail in this context and hence deserves further investigation.
rep-OSD
12, 2395–2421, 2015Effects of lateral processes on the
seasonal water stratification of the
Gulf of Finland
R. E. Vankevich et al.
Title Page
Abstract Introduction
Conclusions References
Tables Figures
◭ ◮
◭ ◮
Back Close
Full Screen / Esc
Printer-friendly Version Interactive Discussion
Discussion
P
a
per
|
Discussion
P
a
per
|
Discussion
P
a
per
|
Discussion
P
a
per
|
resentation of lateral processes by the model let us decrease the role of background constants in turbulent mixing scheme. This simplifies the traditional trade-offbetween the depth and sharpness of the thermocline. Setting the background values of vertical eddy viscosity and diffusivity to 10−5 and 10−7 correspondently let us keep the sharp form of the thermocline and halocline while UML depth corresponds to observations. 5
Most of the mixing is achieved by the wind and convective processes caused by up-welling and intrusions. This approach demonstrates a substantial improvement in the modeled basin stratification compared to previous numerical studies.
Acknowledgements. This work was supported by the Federal Targeted Programme for Re-search and Development in Priority Areas of Development of the Russian Scientific and
Tech-10
nological Complex for 2014–2020 (Grant Agreement No.: RFMEFI57414X0091).
References
Alenius, P., Myrberg, K., and Nekrasov, A.: The physical oceanography of the Gulf of Finland: a review, Boreal Environ. Res., 3, 97–125, 1998.
Alenius, P., Nekrasov, A., and Myrberg, K.: The baroclinic Rossby-radius in the Gulf of Finland,
15
Cont. Shelf Res., 23, 563–573, 2003.
Andrejev, O., Sokolov, A., Soomere, T., Värv, R., and Viikmäe, B.: The use of high-resolution bathymetry for circulation modelling in the Gulf of Finland, Estonian Journal of Engineering, 16, 187–210, 2010.
Boccaletti, G., Ferrari, R., and Fox-Kemper, B.: Mixed layer instabilities and restratification,
20
J. Phys. Oceanogr., 37, 2228–2250, 2007.
Bougeault, P. and Lacarrère, P.: Parameterization of orography-induced turbulence in a mesobeta-scale model, Mon. Weather Rev., 117, 1872–1890, 1989.
Funkquist, L.: HIROMB, an operational eddy-resolving model for the Baltic Sea, Bulletin of the Maritime Institute in Gdansk, XXVIII, 7–16, 2001.
25
OSD
12, 2395–2421, 2015Effects of lateral processes on the
seasonal water stratification of the
Gulf of Finland
R. E. Vankevich et al.
Title Page
Abstract Introduction
Conclusions References
Tables Figures
◭ ◮
◭ ◮
Back Close
Full Screen / Esc
Printer-friendly Version Interactive Discussion
Discussion
P
a
per
|
Discussion
P
a
per
|
Discussion
P
a
per
|
Discussion
P
a
per
|
Gaspar, P., Gregoris, Y., and Lefevre, J.-M.: A simple eddy kinetic energy model for simulations of the oceanic vertical mixing: Tests at station Papa and long-term upper ocean study site, J. Geophys. Res., 95, 16179–16193, 1990.
Gent, P. R. and McWilliams, J. C.: Isopycnal mixing in ocean circulation models, J. Phys. Oceanogr., 20, 150–155, 1990.
5
Hankimo, J.: Some computations of the energy exchange between the sea and the atmosphere in the Baltic area, Finnish Meteorological Office Contributions, 57, 26 pp., 1964.
High Resolution Limited Area Modelling project HIRLAM: available at: http://hirlam.org, last access: 1 February 2015.
Holt, J. and Umlauf, L.: Modelling the tidal mixing fronts and seasonal stratification of the
North-10
west European Continental Shelf, Cont. Shelf Res., 28, 887–903, 2008.
Kantha, L. H. and Clayson, C. A.: An improved mixed layer model for geophysical applications, J. Geophys. Res., 99, 25235–25266, 1994.
Kolmogorov, A. N.: The equation of turbulent motion in an incompressible fluid, Izvestiya Akademii Nauk SSSR Seriya Fizicheskaya, 6, 56–58, 1942.
15
Laine, A. O., Andersin, A.-B., Leinio, S., and Zuur, A. F.: Stratification-induced hypoxia as a structuring factor of macrozoobenthos in the open Gulf of Finland (Baltic Sea), J. Sea Res., 57, 65–77, 2007.
Lips, U., Lips, I., Liblik, T., and Elken, J.: Estuarine transport versus vertical movement and mixing of water masses in the Gulf of Finland (Baltic Sea), in: US/EU-Baltic International
20
Simposium, 2008 IEEE/OES, 1–8, doi:10.1109/BALTIC.2008.4625535, Tallinn, 27–29 May 2008.
Lips, U., Lips, I., Liblik, T., and Kuvaldina, N.: Processes responsible for the formation and maintenance of sub-surface chlorophyll maxima in the Gulf of Finland, Estuar. Coast Shelf S., 88, 339–349, 2010.
25
Liu, H. and Holt, J. T.: Combination of the Vertical PPM Advection Scheme with the Existing Horizontal Advection Schemes in NEMO, MyOcean Science Days, available at: http: //mercator-myoceanv2.netaktiv.com/MSD2010/Abstract/AbstractLIUhedongMSD2010.doc (last access: 1 June 2013), 2010.
Lorke, A., Peeters, F., and Wuëst, A.: Shear-induced convective mixing in bottom boundary
30
layers on slopes, Limnol. Oceanogr., 50, 1612–1619, 2005.
OSD
12, 2395–2421, 2015Effects of lateral processes on the
seasonal water stratification of the
Gulf of Finland
R. E. Vankevich et al.
Title Page
Abstract Introduction
Conclusions References
Tables Figures
◭ ◮
◭ ◮
Back Close
Full Screen / Esc
Printer-friendly Version Interactive Discussion
Discussion
P
a
per
|
Discussion
P
a
per
|
Discussion
P
a
per
|
Discussion
P
a
per
|
Madec, G., Delecluse, P., Imbard, M., and Levy, C.: OPA 8.1 Ocean General Circulation Model reference manual. Note du Pole de modelisation, Institut Pierre-Simon Laplace (IPSL), Paris, France, No 11, 91 p., 1998.
Maximov, A. A.: Causes of the bottom hypoxia in the eastern part of the Gulf of Finland in the Baltic Sea, Oceanology, 46, 204–210, 2006.
5
Mellor, G. L. and Yamada, T.: A hierarchy of turbulence closure models for planetary boundary layers, J. Atmos. Sci., 31, 1791–1806, 1974.
Myrberg, K., Ryabchenko, V., Isaev, A., Vankevich, R., Andrejev, O., Bendtsen, J., Erichsen, A., Funkquist, L., Inkala, A., Neelov, I., Rasmus, K., Medina, M. R., Raudsepp, U., Passenko, J., Soderkvist, J., Sokolov, A., Kuosa, H., Anderson, T. R., Lehmann, A., and Skogen, M. D.:
10
Validation of three-dimensional hydrodynamic models of the Gulf of Finland, Boreal Environ. Res., 15, 453–479, 2010.
Nekrasov, A. V. and Lebedeva, I. K.: Estimation of baroclinic Rossby radius Koporye region, BFU Research Bulletin, 4–5, 89–93, 2002.
Rantajarvi, E., Gran, V., Hällfors, S., and Olsonen, R.: Effects of environmental factors on the
15
phytoplankton community in the Gulf of Finland – unattended high frequency measurements and multivariate analyses, Hydrobiologia, 363, 127–139, 1998.
Rippeth, T. P., Fisher, N. R., and Simpson, J. H.: The cycle of turbulent dissipation in the pres-ence of tidal straining, J. Phys. Oceanogr., 31, 2458–2471, 2001.
Rodi, W.: Examples of calculation methods for flow and mixing in stratified Fluids, J. Geophys.
20
Res., 92, 5305–5328, 1987.
Sokolov, A.: Modelling of submesoscale dynamics in the Gulf of Finland (Baltic Sea), Geo-physical Research Abstracts Vol. 15, EGU2013–9646, General Assembly, Vienna, Austria, 2013.
Soomere, T., Myrberg, K., Leppäranta M., and Nekrasov, A.: The progress in knowledge of
25
physical oceanography of the Gulf of Finland: a review for 1997–2007, Oceanologia, 50, 287–362, 2008.
Soomere, T., Leppäranta M., and Myrberg, K.: Highlights of the physical oceanography of the Gulf of Finland reflecting potential climate changes, Boreal Environ. Res., 14, 152–165, 2009.
30
OSD
12, 2395–2421, 2015Effects of lateral processes on the
seasonal water stratification of the
Gulf of Finland
R. E. Vankevich et al.
Title Page
Abstract Introduction
Conclusions References
Tables Figures
◭ ◮
◭ ◮
Back Close
Full Screen / Esc
Printer-friendly Version Interactive Discussion
Discussion
P
a
per
|
Discussion
P
a
per
|
Discussion
P
a
per
|
Discussion
P
a
per
|
Stepputtis, D., Hinrichsen, H.-H., Bottcher, U., Gotze, E., and Mohrholz, V.: An example of meso-scale hydrographic features in the central Baltic Sea and their influence on the distri-bution and vertical migration of sprat,Sprattus sprattus balticus(Schn.), Fish. Oceanogr., 20, 82–88, 2011.
Thomas, L., Tandon, A., and Mahadevan, A.: Submesoscale ocean processes and dynamics,
5
in: Ocean Modeling in an Eddying Regime, edited by: Hecht, M. and Hasume, H., Geophys-ical Monograph 177, American GeophysGeophys-ical Union, Washington DC, 217–228, 2007. Tuomi, L., Myrberg, K., and Lehmann, A.: The performance of different vertical turbulence
pa-rameterizations in modelling the development of the seasonal thermocline in the Gulf of Fin-land, Geophysical Research Abstracts Vol. 15, EGU2013-8229, General Assembly, Vienna,
10
Austria, 2013.
Umlauf, L.: Modelling the effects of horizontal and vertical shear in stratified turbulent flows, Deep-Sea Res. Pt. II, 52, 1181–201, 2005.
Umlauf, L. and Burchard, H.: A generic length-scale equation for geophysical turbulence mod-els, J. Marine Syst., 61, 235–265, 2003.
15
Umlauf, L. and Burchard, H.: Second-order turbulence closure models for geophysical bound-ary layers, a review of recent work, J. Marine Syst., 25, 795–827, 2005.
Zhurbas, V., Laanemets, J., and Vahtera, E.: Modeling of the mesoscale structure of coupled upwelling/downwelling events and the related input of nutrients to the upper mixed layer in the Gulf of Finland, Baltic Sea, J. Geophys. Res., 113, C05004, doi:10.1029/2007JC004280,
20
OSD
12, 2395–2421, 2015Effects of lateral processes on the
seasonal water stratification of the
Gulf of Finland
R. E. Vankevich et al.
Title Page
Abstract Introduction
Conclusions References
Tables Figures
◭ ◮
◭ ◮
Back Close
Full Screen / Esc
Printer-friendly Version Interactive Discussion
Discussion
P
a
per
|
Discussion
P
a
per
|
Discussion
P
a
per
|
Discussion
P
a
per
|
Figure 1.Meridional cross section of the GOF at 25.5◦
E. Vertical eddy diffusivity coefficient (shaded surface) overlaid by density isolines:(a)constant vertical eddy viscosity/diffusivity coef-ficients set to the 10−4/10−5m2s−1,(b)convective adjustment only (ED),(c)TKE,(d)TKE+ED,
OSD
12, 2395–2421, 2015Effects of lateral processes on the
seasonal water stratification of the
Gulf of Finland
R. E. Vankevich et al.
Title Page
Abstract Introduction
Conclusions References
Tables Figures
◭ ◮
◭ ◮
Back Close
Full Screen / Esc
Printer-friendly Version Interactive Discussion
Discussion
P
a
per
|
Discussion
P
a
per
|
Discussion
P
a
per
|
Discussion
P
a
per
|
Figure 2.SST on 20 May 2011:(a)MODIS SST,(b)GLS with Galperin limit 0.53 and horizontal
OSD
12, 2395–2421, 2015Effects of lateral processes on the
seasonal water stratification of the
Gulf of Finland
R. E. Vankevich et al.
Title Page
Abstract Introduction
Conclusions References
Tables Figures
◭ ◮
◭ ◮
Back Close
Full Screen / Esc
Printer-friendly Version Interactive Discussion
Discussion
P
a
per
|
Discussion
P
a
per
|
Discussion
P
a
per
|
Discussion
P
a
per
|
Figure 3. Averaged vertical profiles of temperature and salinity in west (a, d), central (b, e)
OSD
12, 2395–2421, 2015Effects of lateral processes on the
seasonal water stratification of the
Gulf of Finland
R. E. Vankevich et al.
Title Page
Abstract Introduction
Conclusions References
Tables Figures
◭ ◮
◭ ◮
Back Close
Full Screen / Esc
Printer-friendly Version Interactive Discussion
Discussion
P
a
per
|
Discussion
P
a
per
|
Discussion
P
a
per
|
Discussion
P
a
per
|
Figure 4.SST maps of GOF on 2 August 2011:(a) MODIS data, (bandc) modeled SST on
OSD
12, 2395–2421, 2015Effects of lateral processes on the
seasonal water stratification of the
Gulf of Finland
R. E. Vankevich et al.
Title Page
Abstract Introduction
Conclusions References
Tables Figures
◭ ◮
◭ ◮
Back Close
Full Screen / Esc
Printer-friendly Version Interactive Discussion
Discussion
P
a
per
|
Discussion
P
a
per
|
Discussion
P
a
per
|
Discussion
P
a
per
|
Figure 5.Modelled turbocline depth (m) in GOF on 20 May 2011: (aandb) horizontal
OSD
12, 2395–2421, 2015Effects of lateral processes on the
seasonal water stratification of the
Gulf of Finland
R. E. Vankevich et al.
Title Page
Abstract Introduction
Conclusions References
Tables Figures
◭ ◮
◭ ◮
Back Close
Full Screen / Esc
Printer-friendly Version Interactive Discussion
Discussion
P
a
per
|
Discussion
P
a
per
|
Discussion
P
a
per
|
Discussion
P
a
per
|
Figure 6. Depth of isotherm 3.5◦C and turbocline depth for the periods: left column 11–30