www.atmos-meas-tech.net/9/3325/2016/ doi:10.5194/amt-9-3325-2016
© Author(s) 2016. CC Attribution 3.0 License.
Comparisons of IASI-A and AATSR measurements of
top-of-atmosphere radiance over an extended period
Manik Bali1, Jonathan P. Mittaz2, Eileen Maturi3, and Mitchell D. Goldberg3
1ESSIC/CICS, University of Maryland, College Park, MD, USA 2Department of Meteorology, University of Reading, Reading, UK
3National Oceanic and Atmospheric Administration, College Park, MD, USA
Correspondence to:Manik Bali (manik.bali@noaa.gov)
Received: 21 July 2015 – Published in Atmos. Meas. Tech. Discuss.: 18 September 2015 Revised: 15 May 2016 – Accepted: 27 June 2016 – Published: 27 July 2016
Abstract. This study examines the trustworthiness of the Advanced Along-Track Scanning Radiometer (AATSR) and the Infrared Atmospheric Sounding Interferometer (IASI-A), as on-orbit reference instruments that are useful in re-calibrating the Advanced Very High Resolution Radiometer (AVHRR) series (Mittaz and Harris, 2011). To do this, a 39-month period (1 January 2008 to 31 March 2011) of AATSR and IASI-A inter-comparisons of top-of-atmosphere (TOA) radiance measurements is examined. Our inter-comparison reveals features of the AATSR and IASI-A bias with respect to scan angle, scene temperature, time and orbital maneuvers, and gives insight into their trustworthiness as an in-orbit ref-erence instruments.
The first feature that our study reveals is that the AATSR (nadir view) and IASI-A are both stable (have no percep-tible trends in the period of study). The second feature is that IASI-A is perhaps more accurate (∼0.05 K) than its stated accuracy (0.5 K). In fact the AATSR and IASI-A bias is close to the AATSR pre-launch bias (plus a small offset of +0.07 K) implying that IASI-A can get close to pre-launch levels of accuracy. Third, a very small scan angular depen-dence of AATSR and IASI-A bias indicates that the IASI-A response vs. scan angle algorithm is robust, while the instru-ment is in orbit.
Inter-comparisons of AATSR with IASI-A further reveal the impact of orbital maneuvers of the ENVISAT, the plat-form carrying AATSR, done in October 2011 and not antic-ipated previously. Our study reveals that this maneuver in-troduced a temperature-dependent bias in the AATSR mea-surements for low temperatures (< 240 K) in the period fol-lowing this maneuver (Cocevar et al., 2011). Our study also
shows that the known AATSR 12 µm channel offset is in fact temperature dependent, grows up to 0.4 K, varies seasonally and is correlated with instrument temperature and cannot be corrected by shifting the spectral response function (SRF) of AATSR.
We also present a set of recommendations to help iden-tify the parameters under which these instruments can pro-vide the most trustworthy observations for the AVHRR re-calibration.
1 Introduction
The launch of ENVISAT in 2002 and the launch of MetOp-A in 2006 put two highly accurate instruments in space to mea-sure the top-of-atmosphere (TOA) radiances. These instru-ments are the Advanced Along-Track Scanning Radiome-ter (AATSR) and Infrared Atmospheric Sounding Instrument (IASI-A). The AATSR is able to measure brightness temper-ature (BT) to an accuracy of 30 mK (Illingworth et al., 2009). The IASI-A is a hyper spectral instrument that has a stated accuracy of 0.5 K (Illingworth et al., 2009).
Under the aegis of the Global Space-based Inter-Calibration System (GSICS) over 15 satellite agencies use IASI-A as a reference to monitor their in-orbit instruments by inter-comparing them with IASI-A in real time. Such inter-comparisons have helped detect anomalies and trends in monitored instruments and correct them (Hewison et al., 2013).
Ad-vanced Very High Resolution Radiometer (AVHRR) series of instruments. Mittaz and Harris (2011) developed a new calibration scheme for the AVHRR series of instruments. This scheme uses IASI-A as a reference source and the inter-comparison of IASI-A with AVHRR to detect time, temper-ature and viewing-angle-dependent biases in AVHRR TOA radiance measurements. This scheme physically models the AVHRR biases and corrects them. This calibration scheme brings the AVHRR measurements close to the “climate readi-ness” i.e accuracy better than 0.1 K and its stability better than 0.05 K dec−1(Ohring et al., 2005).
However the legacy of the AVHRR series goes back to 1978 and one needs a cascade of reference instruments prior to the launch of the IASI-A to re-calibrate AVHRRs launched prior to 2006. AIRS (Atmospheric Infrared Sounder), an-other commonly used hyper spectral sounding instrument dates back to 2002 only. Prior to that, the only credible TOA reference is the Along-Track Scanning Radiometer series, namely the ATSRs (ATSR-1 launched in 1991, ATSR-2 in 1995 and the AATSR in 2002). Hence in principle if one were to use a combination of the ATSR’s AIRS and IASI-A (launched in 2006) one can get a reference radiance start-ing from the early 90s right until now. However one needs to evaluate how well these instruments can reveal the time, scene temperature, viewing-angle-dependent biases of the AVHRRs to have an opinion of their trustworthiness for use as a reference for re-calibration of AVHRR series. As a first step in this study we focus on the period from 2002 onwards and evaluate the trustworthiness of the AATSR and IASI-A in their role as a reference for re-calibration of AVHRR .
A previous study by Illingworth et al. (2009) used the AATSR as a benchmark and attempted to measure the bias in IASI-A vs. AATSR. Using a small number of colloca-tions (41 for clear sky and 66 for homogenous scenes) taken from a single orbit on 1 September 2007 over oceans, this study concluded that the mean measurements for the 11 and 12 µm channels of IASI-A and AATSR measurements agree to within −0.05 and 0.23 K, respectively. The Illingworth study was sufficient to provide a basic estimate of differ-ences between IASI-A and the AATSR. However in order to form an opinion about their use for re-calibration studies, key questions about the possible variations of bias with scan angle, scene temperature, time and spectrum still needed to be addressed. In addition, for the AATSR there is a known brightness temperature (BT) offset on the order −0.2 K in the 12 µm channel when compared to the ATSR-2 (Corlett, 2014; Smith, 2007). This offset is most likely a calibration issue that occurred post launch, and possible causes range from change in detector characteristics to changes in the SRF characteristics (position and shape).
The main objective of this paper is to estimate the trustworthiness of the AATSR and IASI-A for use in re-calibration by examining the full extent of the AATSR–IASI-A measurement biases over a wide range of scan angles, temperatures range (210 to 310 K), time (January 2008 to
March 2011) and spectral (11–12 µm). Achieving this goal would help us in identification of scan-angles, time spans and geographic locations of observation that could be considered to be used as reference.
In the next section, we give a brief description of the ATSR-2, AATSR, AIRS and the IASI instruments along with the collocation algorithm that is used in this study to com-pare the two in-orbit references. This is followed by the re-sults section. In the rere-sults section, we first address the issue of scan angle dependence of the AATSR and IASI-A biases. Following this, the temperature and time dependence of the AATSR and IASI-A biases are presented in addition to the impact of AATSR SRF shift on the temperature-dependent bias of the AATSR 12 µm channel. This section also evalu-ates the impact of changes in orbital parameters of ENVISAT on AATSR measurements and concludes by an independent analysis of spectral dependence of IASI-A bias. This study focuses on inter-comparison of 11 and 12 µm which are fully spanned by the IASI-A radiances. The IASI-A does not fully span the SRF of the 3.7 µm channel of the AATSR and the 3.6 µm of AVHRR and is therefore at this point not consid-ered as a reference for its recalibration for this channel.
Inter-calibration a relative approach
While extensively used in monitoring contemporary instru-ments, inter-comparison between two in-orbit instruments such as that presented here has its limitations. A comparison between the AATSR and IASI-A does not provide enough evidence of their trustworthiness as a reference. By research-ing additional evidences this study would attempt to piece together evidences to zero in on goodness of the instruments and in case of anomalies, figure out the most likely source (AATSR or IASI-A) of the anomalies in the bias. In our anal-ysis, this evidence is obtained (1) by comparing pre-launch characterization of the instruments with post launch inter-comparison results and by (2) independent inter-inter-comparison with stable instruments, for example, with AIRS and ATSR-2. Several contemporary studies of IASI-A and AATSR such as Smith et al. (2012), Illingworth et al. (2009) etc are also cited extensively during the analysis.
2 Instrument description and collocation algorithm 2.1 Along-Track Scanning Radiometer (ATSR-2) and
Advanced Along-Track Scanning Radiometer (AATSR)
The ATSR-2 was launched in 1995 on board the ERS-2. It had three visible channels – 0.555, 0.659, and 0.865 µm, and three thermal channels – 3.7, 10.8, and 12 µm. It had an equa-torial crossing time of 10:30 a.m. (within 30 min of AATSR). The Level 1B data sets for ATSR-2 are available from 1995 through 2003, which provides users the opportunity to inter-compare the ATSR-2 with AIRS which started its operations in 2002.
The AATSR was an advanced version of the ATSR-2. It had four visible (0.555, 0.659, 0.865 and 1.61 µm) and three thermal bands (3.7, 11 and 12 µm). Its viewing principle and calibration mechanism is similar to ATSR-2. It was launched (onboard ENVISAT) in 2002 and operated until 8 April 2012. In order to achieve their scientific goals of contributing to climate research these instruments aim to measure TOA to a very high level of accuracy. They use a highly sophisticated calibration mechanism (Llewellyn-Jones et al., 2001; Smith et al., 2001, 2012) to achieve this. This calibration mech-anism uses two Système international (SI) traceable black bodies that are situated at either boundary of the sea sur-face temperature (SST range, approximately 253 and 305 K) as calibration references. Since these references are at either boundary they provide anchor points to estimate the effects of detector nonlinearity within the SST range. This reduces possible calibration errors maintaining high intrinsic sensi-tivity at the same time (Smith et al., 2001, 2012). The detec-tors themselves are maintained at a constant temperature of 80 K which ensures stability and keeps the radiometric noise at 270 K to within 0.05 K.
The ATSR-2 and AATSR have a conical scan and views a location at two zenith angles, once looking through the at-mosphere at 55◦ zenith angle in the forward direction and a second time 3 min later but with a 0◦zenith angle in time when it scans the same location in the nadir as a consequence of the satellites forward motion. This mode of scan pro-duces two swaths of 500 km each; with a spatial resolution of 1 km×1 km at nadir and 1.5 km×2.0 km at the forward view, respectively. For the purpose of inter- comparison, we have used the AATSR Level 1B gridded data sets. This data set is the observed TOA radiance that is geo-located and re-sampled to 1 km×1 km resolution everywhere (every pixel of forward as well as nadir views is 1 km×1 km).
The two IR channels (11 and 12 µm) of the AATSR over-lap the IR spectrum of A. Since both AATSR and IASI-A are morning/evening satellites and have equatorial cross-ing times within 30 min of each other, they provide a large amount of collocated pixels that are observed within a few minutes of each other. Similarly the 11 and 12 µm channels of ATSR-2 overlap with IR spectral of AIRS.
2.2 Infrared Atmospheric Sounding Interferometer (IASI-A)
The IASI-A is a hyper spectral instrument on board the MetOp-A . Launched in 2006, it measures the outgoing Earth
radiance in IR bands (Phulpin et al., 2007; Clerbaux et al., 2007). It is recognized by GSICS as a benchmark for inter-satellite comparison of TOA radiance (e.g. Wu et al., 2009). It works on the principle of a Michelson’s interferometer. It consists of a Fourier Transform Spectrometer with an imag-ing system which provides infrared spectra between 645 and 2760 cm−1(3.6 to 15.5 µm) at a resolution of 0.25 µm (EU-METSAT, 2012). The IASI-A takes these observations in a step and stare mode and covers the±47.85◦FOV range in 30 steps during every 8.0 s scan cycle, with 3.3◦for each step (normal mode). This means that the scan angle varies from [−47.85 to+47.85◦].
IASI-A has a pixel resolution of 12 km at nadir with four pixels per view each positioned in the cross- and along-track directions located at ±0.825◦ from the centre point. The measured interferograms are processed by an onboard digital processing subsystem to reduce the data transmission rate. This subsystem also performs the radiometric calibra-tion (based on the measurements of cold and warm refer-ence targets, i.e. deep space and an onboard black body), and nonlinearity corrections. Once these data are received at the ground station, then the ground system processing takes over. The main components of the ground processing are radio-metric post calibration, spectral calibration and apodization. The main output of this ground processing is a resampled, apodized, and calibrated spectrum with 8461 spectral sam-ples. This product is known as the IASI-A level-1C radiance product, and is used as input to the collocation method de-scribed in the next subsection.
2.3 Atmospheric Infrared Radiometer Sounder (AIRS) AIRS stands for Atmospheric Infrared Radiometer Sounder. It was launched on 4 May 2002 onboard the NASA’s Aqua Satellite. It is a hyper spectral spectrometer with 2378 bands in the thermal infrared (3.7–15.4 µm) and 4 bands in the vis-ible (0.4–1.0 µm). These ranges have been specifically se-lected to allow determination of atmospheric temperature with an accuracy of 1◦K in layers 1 km thick, and humidity with an accuracy of 20 % in layers 2 km thick in the tropo-sphere. The spectral ranges overlap with the AATSR and its predecessor the ATSR-2’s (Along-Track Scanning Radiome-ter) 11 and 12 µm channels.
Table 1.Thresholds applied on collocated AATSR pixels in a single IASI pixel.
Thresholds
Standard deviation of collocated pixels
< 0.5 K
Standard deviation of perimeter pixels
< 1 K
Time difference < 15 min
Time span January 2008–March 2011
Percentage of area of IASI pixel collocated with AATSR pixels
70 %
Sat zenith angle difference 1◦
For the purpose of our study AIRS would be used as a transfer between the AATSR and ATSR-2 as its period of operation, and IR spectrum overlaps with both.
2.4 Collocation method
The purpose of a collocation algorithm is to identify pixel pairs (one from each sensor) where a given target is viewed by two sensors at nearly the same time under similar view-ing conditions thus enablview-ing a direct comparison of corre-sponding measurements. The accuracy and selection criteria of pixel pairs that are finally considered for comparison are fundamental parameters of a collocation algorithm. The lat-ter has been discussed by Wu et al. (2009), wherein GSICS provided a baseline criterion for pixel pair selection during intcomparison. Within the error bounds of geolocation er-rors, application of this criterion results in selection of scenes that are uniform, viewed with similar viewing angles around the same time. Thresholds for viewing angle and observation time differences are stated in Table 1. Selection of uniform scenes ensures that the effects of geolocation errors and ef-fects of differing spatial resolution of the pixel pairs are min-imized when their radiances are compared.
For the AATSR and IASI-A inter-comparison, a new col-location algorithm was developed that inherited some of the selection criteria from the GSICS baseline (Wu et al., 2009). This algorithm took the IASI-A (Level-1C) radiance data and AATSR (gridded Level-1B) orbital files as input and identi-fied AATSR pixels of nadir and forward view that were col-located within the IASI-A pixel. In order to achieve a high degree of accuracy, the exact shape and size of the IASI-A pixel as it varied with scan angle was computed using stan-dard trigonometric functions and used for the collocation.
This algorithm was used to identify AATSR:IASI-A col-located pixels from January 2008 through March 2011. For a given IASI-A:AATSR collocation, the IASI-A footprint on the ground is larger (12 km at nadir) than the AATSR (which is re-sampled to make it 1 km everywhere on the swath) so several AATSR pixels fall within each IASI-A pixel. In
or-der to ensure scene uniformity within the IASI-A footprint, thresholds are set regarding the standard deviation (SD) of the AATSR pixels within the IASI footprint (Table 1). How-ever setting this threshold alone does not guarantee that the state of the scene viewed by the two instruments remains ho-mogenous and invariant when viewed by the two satellites. It is possible that clouds move into the IASI-A pixel within the threshold time (time between two satellite viewings of the same target) and break the homogeneity after the test is applied.
To ensure that such IASI-A pixels are identified and sub-sequently rejected, a second SD threshold test is applied. For this a perimeter area of five AATSR pixels around an IASI-A pixel (Fig. 1) is selected and the SD is computed for this set of AATSR pixels. Only those pixels for which the SD of perimeter pixels is also less than 1 K were selected for further comparison.
In the end the IASI-A spectrum for these collocations is integrated (convoluted) over the AATSR SRF (Eq. 1) to get IASI representative radiances. In this integration all the IASI-A radiances (denoted by IIASI-ASI_RIASI-AD in Eq. 1) that fall within the range of (9.82–12.18) µm were used to get 11 µm IASI representative radiances and all the IASI-A radiances in the range (11.02–13.40) µm to get the 12 µm IASI representa-tive radiances (IASI rep radiances). These wavelength ranges have been taken from the AATSR stated SRF ranges of the 11 and 12 µm channels. The radiances are then compared with the mean radiances of the AATSR that are collocated with the IASI-A pixel. Here IASI_RAD are the IASI-A radiances that fall within the wavelength band pass of AATSR.
Representative IASI-A radiances that have been computed by convoluting with the SRF of a target instrument with the aim of comparing for monitoring target instruments (as indi-cated in Eq. 1) have been widely used in GSICS community. Hewison et al. (2013) have argued that uncertainty due to spectral convolution is of the order of 0.01 K. This is smaller than calibration accuracy and would have little effect on the outcome of in-orbit inter-comparisons such as used here.
IASI-A representative radiance=
P
IASI_RAD·SRF P
SRF (1)
This study also uses inter-comparisons of AIRS and ATSR-2 to investigate spectral dependence of IASI-A measurements (Sect. 3.5). These AIRS vs. ATSR-2 inter-comparisons are also made using a similar collocation method. In this case the AIRS radiances are convoluted over the ATSR-2 SRF to get ATSR-2 representative radiances. The thresholds in Table 1 are also same as used for AATSR vs. IASI-A.
Figure 1.IASI-A foot print (blue) at nadir. The outer red bound-aries indicate the perimeter area where the perimeter threshold is applied. This area is 5 AATSR pixels (5 km) wide. The mean radi-ance of AATSR pixels collocated within the blue is compared with the IASI-A representative pixel radiance.
Table 1) and spanned the 240–280 K range enough for this inter-comparison to be useful as an independent reference for our study. Due to wide difference in equatorial crossing time, the collocations were mainly in located in higher latitudes. This has been summarized in Table 2.
Throughout this paper we have used IASI-A or AIRS representative radiances, i.e, IASI-A radiances convoluted with AATSR SRF for comparisons of AATSR with IASI-A and AIRS convoluted with ATSR-2 SRF for comparison of ATSR-2 with AIRS.
3 Collocation results
3.1 Scan angle dependence of AATSR–IASI-A bias Measurement bias with respect to scan angle is a known phenomenon that has been displayed by instruments such as GOME (UV bands), AMSU (microwave bands) and AVHRR (IR bands, Snel, 2001; Tanzi, 2001; Wu, 2004; Wang and Cao, 2008; Mittaz and Harris, 2011). These instruments have been found to have scan angle dependencies in TOA mea-surements to varying degrees. The reasons for scan angle de-pendence are not always clear but in AVHRR it is hypothe-sized that it is due to the variation in polarization (Wang and Cao, 2008) that occurs when incident radiant flux originat-ing from the target scene falls on the scan mirror at different angles while it is scanning (rotating). Since the root cause of this dependence is not fully understood, it is difficult to phys-ically model it and as a result this dependence usually does not go away by employing a better calibration technique.
In its role as an in-orbit reference it is expected that inter-comparisons of IASI-A with concurrently flying instruments are able to reveal scan angle dependence of the measure-ments of the inter-compared instrument. In view of this the analysis of the scan angle dependence of AATSR–IASI-A aims to answer two questions (1) does the inter-comparison of IASI-A with AATSR show any evidence of scan angle de-pendence of IASI-A or the AATSR measurements? Earlier studies by Mittaz and Harris (2011) also detected scan angle
Figure 2. Scan angle dependence of the AATSR–IASI bias for cold (200–220 K) and SST (265–300 K) temperature ranges. Nei-ther AATSR nor IASI show any scan angle dependence in the−20 to+20◦scan angle range.
dependence of AVHRR–IASI-A bias but It was not clear as to which instrument contributed most to this bias AVHRR or IASI-A . (2) Can the forward view of the AATSR act as a suitable in-orbit reference for IASI-A?
The 12 µm channel of AATSR has a known offset of 0.2 K. As will be shown later, it has complex temperature and time dependence so it is not used to measure the scan angle de-pendence.
Figure 2 shows the variation of AATSR–IASI-A 11 µm bias over the entire the scan angle range of IASI-A (i.e −47.85 to+47.85◦) and AATSR scan angles in cold and SST temperature ranges.
While the bias in the scan angle range±20◦comes from the collocations between the nadir view of AATSR and the IASI-A, the biases beyond±40◦IASI-A scan angles come from collocations between the forward view of AATSR and the IASI-A. Both these views show different characteristics. Figure 2 also shows that the AATSR–IASI-A bias at nadir view is nearly constant with some residual errors (∼0.0025 K degree−1 of satellite zenith angle) and a con-stant offset of close to zero. Given the fact that the scan-angle-dependent variation of the bias at the nadir view is very small, the scan-angle-dependent bias between AVHRR and IASI-A seen by Mittaz and Harris (2011) is most likely an AVHRR effect and not an IASI-A effect.
Table 2. Number of collocations produced by the collocation algorithm for AATSR vs. IASI-A inter-comparison and ATSR-2 vs. AIRS inter-comparison (second last column). The last column displays the number of collocations obtained after applying threshold stated in Table 1 that are eventually used in this study.
Collocation Period of collocation Number of
collocations
Number of qualifying collocations used in this study
AATSR vs. IASI-A 1 January 2008–31 March 2011 10, 047, 594 1, 447, 030 ATSR-2 vs. AIRS 1 September 2002–30 November 2002 767, 354 23, 305
Figure 3. Temperature dependence of AATSR–IASI-A (in grey) bias over the period of 39 months. Blue curve is the same tem-perature dependence with an offset of 0.11 K (i.e. post launch) sub-tracted from it. This blue curve is similar to pre-launch (Smith et al., 2012) characteristics of AATSR to within hundredth of a kelvin.
Corlett (2014) noted alignment issues with the AATSR forward view, wherein the forward-view minus nadir-view image shows significant edge effects around eddy structures and also at the edges of clouds. Such alignment issues lead to geo-location errors in the forward view particularly at cloud edges which are characterized by low temperature (temper-atures < 240 K). Hence forward view of the AATSR is not suitable to act as in orbit reference. In the analysis presented in this paper only nadir view of AATSR is considered in eval-uating the AATSR–IASI-A biases.
3.2 Temperature dependence of the AATSR–IASI-A bias
3.2.1 11 µm
Figure 3 shows the variation of AATSR–IASI-A biases over a temperature range of 210–300 K computed from all the pixels irrespective of their location (land/ocean) and time of observation (day/night). The temperature range chosen here (210–300 K) is similar to the range used by Smith et al. (2012) to depict the difference between the temperature measured by the AATSR and that of a black body that it ob-served during pre-launch testing (green curve in Fig. 3). This temperature range also includes the range (275–300 K) used
by Illingworth et al. (2009) to study the AATSR–IASI-A dif-ference. Hence the choice of this range gives us the opportu-nity to compare and verify the inter-comparison results with two independent studies, one conducted at pre-launch and the other carried out post-launch with limited sample size.
The AATSR–IASI-A bias variation in the 210–300 K range is similar to the difference that was observed by Smith et al. (2012), during the pre-launch testing. The characteristic dip at the low temperature (< 230 K) and the hump at 245 K are captured well. If one applies an offset of−0.11 K to the AATSR–IASI-A variation curve, the pre-launch and the post launch (i.e. our inter-comparison) variations match to within a few hundredths of a degree kelvin.
Since the AATSR pre-launch calibration has a known neg-ative bias of the order of 0.0–0.05 K referenced to SI cali-brated sources, and the inter-comparison of AATSR–IASI-A shows a positive bias of the order of 0.07 K (Fig. 3), the ob-served positive AATSR–IASI-A bias (grey curve in Fig. 3) is likely to be an IASI-A bias relative to the AATSR. Since in the SST temperature regime the AATSR is thought to be ab-solutely accurate to a few hundredths of a degree, the impli-cation is that IASI-A (when corrected for this small bias) can generate radiances that are almost as accurate as pre-launch data to within a few hundredths of a degree kelvin.
The −0.11 K offset has been computed by minimizing the root mean square (RMS) difference between the pre-launch and the post pre-launch (AATSR–IASI-A) curve. A se-ries of RMS difference between post and pre-launch val-ues was calculated by adding successively 0.001 K offsets to IASI-A temperature and reducing the AATSR-IASI bias. The minimum value of RMS differences occurs at an offset of−0.11 K.
Our inter-comparison results are in agreement with the AATSR–IASI-A comparisons of Ilingworth et al. (2009) to a level of a few hundredths of degree. While our mean differ-ence over the entire temperature range is 0.073 K (±0.03 K), Illingworth et al. (2009) difference is of the order of 0.05 K (±0.03 K). The small difference between the two compar-isons can be attributed to the difference in data sets.
3.2.2 12 µm
Figure 4.Temperature-dependent bias of the AATSR-IASI-A for the 12 µ channel.
BT offset of ∼ −0.2 K in the SST temperature range when compared with the ATSR-2 (Corlett, 2014). It was verified by Smith (2007) to be an AATSR artifact.
However, our analysis has found that the BT offset is strongly temperature-dependent and steadily grows to about 0.4 K as the temperatures decreases to 210 K (Fig. 4). In the SST temperature range the bias is negative. Taking into ac-count the small (0.07 K) IASI-A bias discussed above, this is approximately consistent with the previously known bias of −0.2 K. Among the possible reasons of this effect is that the SRF may have undergone a shift or a possible long wave leak developed post launch (Smith, 2007).
We have investigated the possibility of estimating a simple SRF shift to explain the bias by undertaking a set of experi-ments. The SRFs were shifted by±nwave numbers (where
n=1,2,3). Figure 5 shows the impact of shifting the SRF on the AATSR–IASI bias for each “n”. As shown in Fig. 5, the temperature dependence of the bias is preserved right up until a shift of+3 wave numbers is applied. A similar conclu-sion was drawn with the−3 shifts, and the overall conclusion is that SRF shift is an unlikely solution to the temperature-dependent bias.
Further investigation into possible causes of the bias is be-yond the scope of this study. The bias variation shown in Fig. 4 also shows that the error bars are small. The maximum value of the error bar is±0.0023 K which indicates that the bias is highly stable and can be empirically corrected by fit-ting a polynomial function.
3.3 Temporal dependence of AATSR–IASI-A biases Legacy instruments such as the AVHRR are known to show seasonal variation in radiance measurements. This variation is mainly attributed to seasonal variation in instrument tem-perature. Mittaz and Harris (2011) have shown that this seasonal effect can be corrected by using a better
calibra-Figure 5.Impact of shifting the AATSR spectral response function by three wave numbers on either side of its central wave number (Wn) position in steps of 1 Wn. The scene-temperature-dependent nature of AATSR-IASI-A bias does not diminish by shifting SRF.
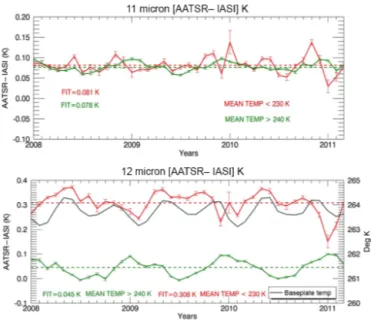
Figure 6.Time series of variation of AATSR–IASI bias for 11 and 12 µm channels in the cold (red) and warm (green) temper-ature ranges. The bias at cold tempertemper-ature in 12 µm is correlated (ρ=0.78) with the instrument baseplate temperature (grey curve in the lower plot).
tion scheme that physically models the effects of seasonal changes in instrument temperature. However, this scheme needs stable references that are minimally impacted by in-strument temperature. Since IASI-A and AATSR are envis-aged to be used as references in the AVHRR re-calibration, it is vital to understand and quantify the seasonal variation in the measurement.
tem-perature range that lies between the warm and the cold black body. The cold temperature range (BT < 230 K) is chosen de-liberately away from this temperature range as it is likely to have a reduced impact of the robust calibration scheme. 3.3.1 Warm temperature range (temp > 240 K)
The temperature of the two calibration black bodies in the AATSR instrument lie in the warm temperature range at 260 K cold and 310 K warm. This helps in pinning down the effect of detector nonlinearly and ward off effects of sea-sonal changes in instrument temperature. The robustness of this calibration system is clearly demonstrated when month-to-month AATSR–IASI-A bias was analysed. As seen in Fig. 6, the 11 µm channel maintains a very well-calibrated stance with small annual deviations (±0.01 K) around its mean value of 0.078 K.
The 12 µm channel of AATSR–IASI-A bias shows slightly larger amplitude (0.045±0.032 K) than the 11 µm channel, in this temperature range. Despite the known temperature-dependent BT offset (Fig. 6) of this channel, the calibra-tion mechanism ensures that the seasonal variability in the AATSR–IASI bias at the warm temperature range remains confined to less than a few hundredths of a degree K. So the seasonal variation in the bias for warmer temperatures (T > 240 K) in both of the channels can be estimated as very small (a few hundredths of degree).
3.3.2 Cold temperature range (temp < 230 K)
The cold temperature range lies outside of the temperature range spanned by the two calibration black bodies of the AATSR which are situated at roughly 250 and 305 K. The AATSR has a calibration bias (see green curve in Fig. 3, Smith et al., 2012) below 230 K that grows to−0.1 K. A sim-ilar characteristic dip is displayed post launch when AATSR is compared with IASI-A over several months (Fig. 3). This inter-comparison shows that the 11 µm channel (Fig. 6) bias for colder BTs is slightly higher than that seen for the warmer BTs, and hovers around 0.081 K (±0.022 K).
A similar analysis of the 12 µm channel AATSR–IASI bias reveals a larger seasonal variation of 0.31 K (±0.03 K) as compared to the 11 µm. Within a given year there are two distinct peaks. For this channel, the entire AATSR–IASI bias curve is closely cross correlated (Fig. 6) with the instrument base plate temperature variation (cross correlation=0.78) thereby indicating that the instrument temperature could be influencing the AATSR measurements in the colder temper-ature range for this channel.
In the 11 µm channel, some months (November and De-cember) show spikes of the order of 0.15 K that stand out. Since these spikes occur during the time of “year end orbit maneuver of ENVISAT” (Noll, 2010) it is likely that these are caused by temporary AATSR geo-location errors and not calibration errors of the AATSR or the IASI-A.
For 2008 and 2009 these spikes are nearly the same how-ever the spike in end of 2010 appears unique as it is followed by an anomalous dip in January 2011.
Impact of ENVISAT orbit lowering maneuver in 2010 It must also be noted that the orbit maneuver carried out in October 2010 was different from the ones carried out in prior years because orbital inclination control was switched off and the altitude of the satellite was reduced by 17.4 km (Miranda et al., 2010). This led to a new 30-day repeat cy-cle (431 orbits per cycy-cle), instead of the earlier 35-day repeat cycle (501 orbits per cycle). It was expected that this would not cause any anomalies in AATSR measurements and ini-tial testing immediately after the maneuver did not detect any anomaly (Cocevar et al., 2011).
However it must be noted that changes in orbital incli-nation are slow and their impacts would not be visible in the first few orbits that were used in the testing phase (Co-cevar, 2013) and might be detectable only in the subse-quent months. By extending the inter-comparison several months beyond October 2010 (i.e. until March 2011) our inter-comparison study was able to detect the impact of this maneuver (Fig. 6) on AATSR measurements as a spike that starts in November 2010 and lasts till February 2011.
Since such spikes can impact the AVHRR recalibrating process, we investigated the full scale of these spikes. Fig-ure 7 shows the temperatFig-ure dependence of AATSR–IASI-A bias for the DJF for the 11 and 12 µm channels. This figure shows that while the 2008 and 2009 spikes show small de-viations at the cold temperature end the bias for 2010–2011 shows a clear temperature-dependent trend.
These deviations in 2011 are important as they can im-pact the re-calibration of the AVHRR from 2011 onwards if AATSR is to be used as a reference for this period. Further analysis (Fig. 8) showed that these deviations are largest for collocations between the AATSR and IASI-A over Green-land. Figure 8 also shows the biases for the same months (DJF) when Greenland data are excluded and one can see that the deviations are reduced.
Given that AATSR’s onboard calibration has worked well prior to this maneuver and has even replicated pre-launch be-haviour for months prior to October 2010, the deviations seen here do not appear to be a calibration issue as change in or-bital parameters would not be able to influence the robust onboard calibration scheme. This trend could be due to small number of collocations over this area or could also be due to geolocation errors that manifest themselves when the in-clination control is switched off and satellite orbit is lowered thereby changing the observation geometry. More investiga-tion is required to reveal the cause of this anomaly.
con-Figure 7.Year to year AATSR–IASI bias for DJF for the 11 and 12 µm channels. An anomalous trend at cold temperature is clearly visible in November 2010 DJF.
Figure 8.Comparison of AASR–IASI-A bias over Greenland and outside Greenland. The anomalous trend seen in November 2010 DFJ AATSR–IASI bias is mainly confined to Greenland.
ditions as they do over Greenland. All the collocations be-tween 60 and 82◦S occur over ocean. Since spatial tempera-ture gradients over the oceans are not as sharp as those over land (i.e. neighbouring pixels have nearly the same temper-ature value), any offsets in those pixel location due to errors in geo-location would not show up as a temperature bias.
3.4 Spectral dependence of AIRS and IASI-A measurements.
Table 3.Summary of AATSR vs. IASI-A inter-comparison. The table shows the measurements of the two instruments agree with each other.
Channel Scan angle Temperature Temporal Spectral
11 Micron No scan angle dependence AATSR, forward view not recommended to be used as a reference.
AATSR and IASI-A agree to within 0.07 K and bias variation similar to pre-launch AATSR behaviour.
No evidence of temporal trends in a 39-month period of study.
It is likely that IASI-A has a small spectral dependence bias of ∼0.02 K. Routine monitoring of this bias is recommended.
12 Micron n/a Varies from
[0.4 to−0.2 K] over scene temperature range [220– 300 K]
No evidence of temporal trends in a 39-month period of study.
n/a: not applicable.
Earlier studies by Wang et al. (2010, 2011) compared IASI-A with AIRS (IASI-A–AIRS) using direct SNO as well as by using GOES-11 as a transfer. These studies conclude that the AIRS vs. IASI-A bias has small temperature as well as spectral dependence. Wang et al. (2011) indicate that the bias is of the order of −0.042 K (±0.05 K) and−0.093 K (±0.05 K) for 11 and 12 µm for cold (i.e less than 240 K) temperature. For warm (more than 260 K) temperature bias is−0.029 K (±0.01 K) and−0.043 K (±0.01 K) for 11 and 12 µm channels. All uncertainties are at 95 % confidence level. Though the study suggested a difference in the AIRS– IASI-A bias from 11 to 12 µm which indicated a small spec-tral bias between the two, the study also suggested further analysis to concretize this bias in order to use it for climate purposes. It was also not clear weather AIRS or IASI-A or both caused the spectral dependence bias seen in this study.
Using collocation data produced from 3 months of SNO inter-comparison of AIRS and ATSR-2, we examined the AIRS biases with ATSR-2. It was found that they agree to within −0.015 K (±0.001 K) in 11 µm and −0.011 (±0.004 K) 12 µm channels. The ATSR-2 is a satellite be-longing to the AATSR family and has no known inter-channel-dependent bias and as stated earlier measures TOA to a high level of accuracy. Hence it is likely that IASI-A is contributing more (than AIRS) to the AIRS vs. IASI-A bias found in the Wang et al. (2012) study and needs to be ac-counted for when using IASI-A as a reference.
3.5 Other dependencies of AATSR–IASI-A bias
Mittaz and Harris (2011) have shown that in instruments such as the AVHRR have significant diurnal biases that result from heating and cooling of the instrument as the satellite moves from sunlit to non-sunlit sides over an orbit. For instruments (such as AATSR and IASI-A) that are candidates for being used as in-orbit references it is important that such diurnal variations are quantified. The dependence of AATSR–IASI-A vs. scene temperature biases on scene selection (land/sea
and day/night scenes) over the entire 39-month period of col-location was also investigated. It was found that a signifi-cant number of collocation pixels were rejected when ad-ditional scene selection criterion was applied together with those thresholds stated in Table 1. This only influenced ran-dom noise associated with the AATSR–IASI-A bias and does not impact our conclusions of the AATSR–IASI-A bias vari-ation with respect to scene temperature and it remains similar to pre-launch behaviour. This demonstrated the robustness of the onboard calibration of the two instruments and their abil-ity to resolve diurnal variations in measurements when used as references and compared with other instruments.
However, specific events such as orbital maneuvers have had some impact AATSR–IASI-A bias on specific scene lo-cations (such as Greenland) and these spots would be even-tually ignored while constructing the reference radiance.
4 Conclusions
Using AATSR and IASI-A collocations spanning 39 months (January 2008–March 2011) this study measures the trust-worthiness of AATSR and the IASI-A. The idea is to even-tually use these instruments as in-orbit reference for re-calibration of the AVHRR series of instruments (Mittaz and Harris, 2011). This study focuses on the 11 and 12 µm chan-nels only.
This trustworthiness is measured by evaluating several pa-rameters. These are the following: (1) similarity between pre-launch temperature-dependent bias (Smith et al., 2012) of AATSR and post launch temperature dependence of AATSR–IASI-A bias as shown in Fig. 2, (2) scan angle pendence of AATSR–IASI-A bias, (3) scene temperature de-pendence of bias, and (4) time dede-pendence of the AATSR– IASI-A bias, (5) spectral dependence of bias AATSR–IASI bias. Results of our analysis are summarized in Table 3.
period of study and a very small spectral dependence of mea-surement bias in the IASI-A. In fact, for the 11 µm channel, the AATSR retains its characteristic pre-launch behaviour (Fig. 3) and the IASI-A is nearly as good as a pre-launch reference (plus an offset of 0.07 K). Also the 12 µm AATSR bias is temperature-dependent but stable and can be empiri-cally corrected. Hence these instruments can act as trustwor-thy reference however care needs to be taken while generat-ing long term reference records for recalibration purposes. In addition the study answers three more questions that are vital to their use as a reference for AVHRR re-calibration.
Our study answers a long pending question posed by stud-ies such as by Blumstein et al. (2007), Wang and Cao (2008) and later by Mittaz and Harris (2011) which detected scan an-gle bias in AVHRR and IASI-A inter-comparison and it was not conclusively known by these studies which of the two in-struments contributed to the scan angle bias. The AVHRR has scan-angle-dependent bias at cold temperature range (210–240 K).
Our study provides evidence that IASI-A has a small spectral dependence with respect to AIRS. This varies by a few hundredth of a kelvin from 11 to 12 µm. Given that later IASI’s like IASI-B have detected spectral bias (Jouglet, 2016). In order to use it as a reference it is vital to monitor this bias and apply corrections when needed.
Our study reveals that ATSR-2-AIRS bias is −0.015 K (±0.001 K) in 11 µm and−0.011 (±0.004 K) 12 µm chan-nels. These biases are small and no evidence of tempera-ture, time and spectral dependence in this bias was found; hence AIRS can act as an perspective to bridge ATSR-2 with AATSR, which can help provide a long time series of refer-ence radiance for the AVHRR recalibration.
Recommendations for using AATSR and IASI-A as a reference.
In order to use AATSR and IASI-A as reference we need to know the conditions under which the AATSR and IASI-A give the most credible radiances. Based on the analysis pre-sented in this study we have the following recommendations for generating reference radiances.
1. It is recommended that only nadir view of AATSR is used as reference and forward view is not used as a ref-erence.
2. It is recommended that post the orbital maneuver of EN-VISAT in October 2010 only mid and lower latitudes TOA measured by AATSR should be used. AATSR TOA data over Greenland should be excluded from be-ing used as a reference.
3. The AATSR and IASI-A match to hundredth of a kelvin in the SST temperature range. Outside this range their agreement drops to a tenth of a kelvin. Empirical cor-rections should be applied to the AATSR 11 and 12 µm.
A sixth degree polynomial is a good fit to temperature dependence of the 12 µm bias. Further, independent esti-mates of AATSR and IASI-A should also be made (such as IASI-A comparison with AIRS and ATSR-2 compar-ison with AIRS).
4. Since 12 µm AATSR also has a cold bias that season-ally varies (Fig. 6), the cold temperature range for this channel should either be ignored or be used with caution while re-calibrating AVHRR.
5. Information from routine instrument monitoring re-ports (such as ENVISAT Cycle rere-ports) and IASI-A Quarterly Performance Reports in “Observation” pre-sented on CNES website: https://iasi.cnes.fr/en/IASI/ lien1_car_instr.htm, need to be routinely analysed to identify the cause of measurement anomalies and iden-tify times and location of best instrument behaviour. These reports can help select time and geographic lo-cations and help reveal vital parameters of the reference instrument such as spectral bias (Jouglet, 2016) or devi-ations in the onboard calibration mechanism etc.
Acknowledgements. We wish to thank Bob Kuligowski, Lawrence E. Flynn, Sriharsha Madhavan at NOAA/STAR, and Richa Mathur for proofreading and help improving this article. Thanks are also due to Andy Harris at NOAA/STAR for providing the IASI-A footprint shapes and also for providing vital information on the ATSR-2 and AATSR calibration. Thanks are also due to Fuzhong Weng for supporting the publication of this paper.
Edited by: A. Richter
Reviewed by: three anonymous referees
References
Blumstein, D., Tournier, B., Cayla, F. R., Phulpin, T., Fjortoft, R., Bull, C., and Ponce, G.: Inflight performance of the Infrared At-mospheric Sounding Interferometer (IASI) on Metop-A, P. SPIE, 6684, 66840H, doi:10.1117/12.560907, 2007.
Cocevar, P.: ENVISAT – AATSR CYCLIC REPORT #98, ESA, 1–19, available at: https://earth.esa.int/sppa-reports/envisat/ aatsr/cyclic/2010-12-26/AATSR_CR_98_101226_110125.pdf (last access: 14 September 2015), 2011.
Cocevar, P.: IDEAS – Envisat AATSR Performance Report, IDEAS-VEG-OQC-REP-1143, ESA, 1–46, available at: https://earth.esa.int/documents/10174/437508/Envisat_AATSR_ Performance_Report.pdf (last access: 14 September 2015), 2013.
Corlett, G. K.: (A)ATSR Validation Activities, available at: http://atsrsensors.org/pdf/ATSRValidationIssues.pdf (last access: 14 September 2015), University of Leicester, UL- AATSR-VIR, 5B, 2014.
Tournier, B., and Phulpin, T.: The IASI/MetOp Mission: first ob-servations and highlights of its potential contribution to GMES, Space Research Today, 168, 19–24, 2007.
EUMETSAT: IASI Level 1 Product Guide, Ref: EUM/OPS-EPS/MAN/04/0032, Issue v3j, EU- METSAT, 1–110, avail-able at: http://www.eumetsat.int/website/wcm/idc/idcplg? IdcService=GET_FILE&dDocName=pdf_iasi_level_1_prod_ guide&RevisionSelectionMethod=LatestReleased&Rendition= Web (last access: 14 September 2015), 2012.
Hewison, T. J., Wu, X., Yu, F., Tahara, Y., and Koenig, M.: GSICS inter-calibration of infrared channels of geostationary imagers using Metop/IASI, IEEE Trans. Geosci. Remote Sens., 51, 3, 1056–1080, 2013.
Illingworth, S. M., Remedios, J. J., and Parker, R. J.: Intercompar-ison of integrated IASI and AATSR calibrated radiances at 11 and 12 µ, Atmos. Chem. Phys., 9, 6677–6683, doi:10.5194/acp-9-6677-2009, 2009.
Jouglet, D.: IR hyperspectral comparisons, GSICS An-nual Meeting 2016, Tokyo, Japan, available at: http: //gsicswiki.net/pub/Development/20160229/3p_Jouglet_IR_ hyperspectral_comparisons.ppt, last access: 14 May 2016. Llewellyn-Jones, D., Edwards, M. C., Mutlow, C. T., Birks, A. R.,
Barton, I. J., and Tait, H.: AATSR: global-change and surface-temperature measurements from Envisat, ESA Bull.-Eur. Space, 105, 11–21, 2001.
Miranda, N. Duesmann, B., Pinol, M., Giudici, D., and D’Aria, D.: Impact of the Envisat Mission Extension on SAR data, avail-able at: http://earth.esa.int/pub/ESA_DOC/ENVISAT/Impact_ of_Envisat_Mission_Extension_on_SAR_data_-_1_01.pdf (last access: 12 September 2015), 2010.
Mittaz, J. P. D. and Harris, A. R.: A physical method for the cali-bration of the AVHRR/3 thermal IR channels. Part II: An in-orbit comparison of the AVHRR long wave thermal IR channels on board MetOp-A with IASI, J. Atmos. Ocean. Tech., 28, 1072– 1087, 2011.
Noll, C. E.: The Crustal Dynamics Data Information System, a resource to support scientific analysis using space geodesy, in: DORIS Special Issue: Scientific Applications in Geodesy and Geodynamics, edited by: Willis, P., Adv. Space Res., 45, 1421– 1440, doi:10.1016/j.asr.2010.01.018, 2010.
Ohring, G., Wielicki, B., Spencer, R., Emery, B., and Datla, R.: Satellite instrument calibration for measuring global climate change – report of a Workshop, B. Am. Meteorol. Soc., 86, 1303– 1313, 2005.
Phulpin, T., Prel, F., Blumstein, D., Tournier, B., Prunet, P., and Schlüssel, P.: Applications of IASI on MetOp-A: first results and illustration of potential use for meteorology, climate mon-itoring, and atmospheric chemistry, Proc. SPIE, 6684, 66840F, doi:10.1117/12.736816, 2007.
Smith, D. L.: Effect of long wavelength response in AATSR fil-ters on brightness temperature measurements, AATSR Technical Note, PO-TN-RAL-AT-0541, Issue 1.0, Rutherford Apple- ton Laboratory, 2007.
Smith, D. L., Delderfield, J., Drummond, D., Edwards, T., Mutlow, C., Read, P., and Toplis, G.: Calibration of the AATSR instru-ment, Adv. Space Res., 28, 31–39, 2001.
Smith, D., Mutlow, C., Delderfield, J., Watkins, B., and Mason, G.: ATSR infrared radiometric calibration and in-orbit performance, Remote Sens. Environ., 116, 4–16, 2012.
Snel, R.: In-orbit optical path degradation: gome experience and sciamachy prediction, in: Proceedings of the ERS-ENVISAT Symposium, ESA Publications Division, Nordwijk, the Nether-lands, SP-461 (on CD ROM), 16–20 October 2000, Gothenburg, Sweden, 2001.
Tanzi, C. P.: Degradation of UV earth albedo observations by Global Ozone Monitoring Experiment (GOME), in: Proceedings of the ERS-ENVISAT Symposium, ESA Publications Division, Nordwijk, the Netherlands, SP-461 (on CD ROM), 16–20 Octo-ber 2000, Gothenburg, Sweden, 2001.
Wang, L. and Cao, C.: On-orbit calibration assessment of AVHRR longwave channels on MetOp-A using IASI, IEEE T. Geosci. Re-mote, 46, 4005–4013, doi:10.1109/TGRS.2008.2001062, 2008. Wang, L., Wu, X., Goldberg, M., Cao, C., Li, Y., and Sohn, S.-H.:
Comparison of AIRS and IASI radiances using GOES imagers as transfer radiometers toward climate data records, J. Appl. Mete. Climatol., 49, 478–492, doi:10.1175/2009JAMC2218.1, 2010. Wang, L., Goldberg, M., Wu, X., Cao, C., Iacovazzi Jr., R.
A., Yu, F., and Li, Y.: Consistency assessment of Atmo-spheric Infrared Sounder and Infrared AtmoAtmo-spheric Sound-ing Interfer ometer radiances: double differences versus si-multaneous nadir overpasses, J. Geophys. Res., 116, D11111, doi:10.1029/2010JD014988, 2011.
Wu, D. L.: Mesoscale gravity wave variances from AMSU-A radiances, Geophys. Res. Lett., 31, L12114, doi:10.1029/2004GL019562, 2004.