Functional Profiling of Unfamiliar Microbial Communities Using a Validated De Novo Assembly Metatranscriptome Pipeline.
Texto
Imagem
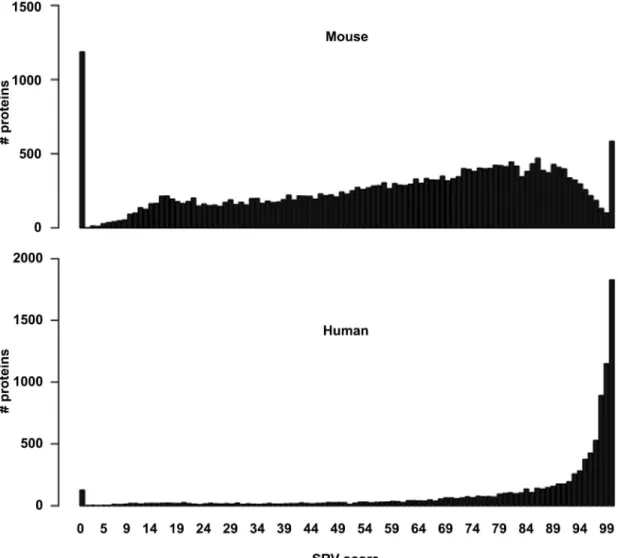
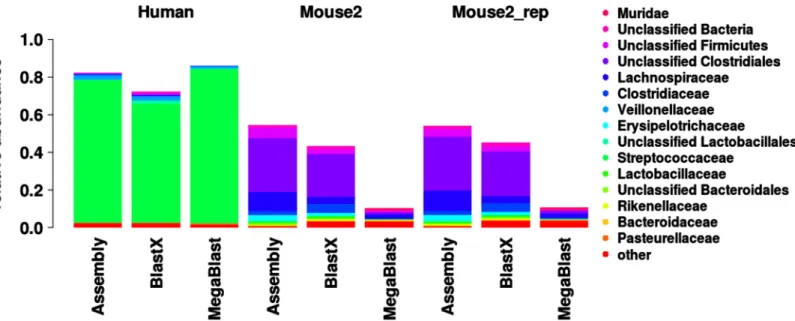
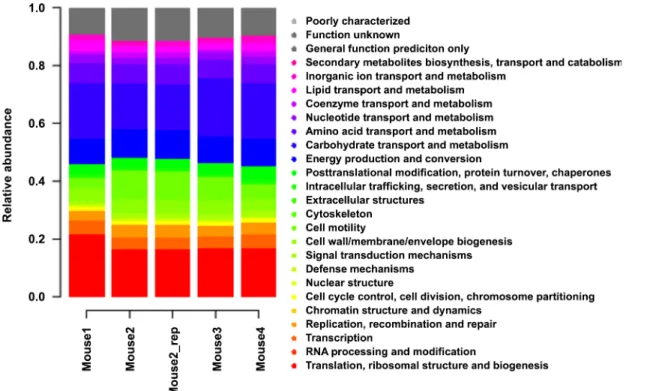
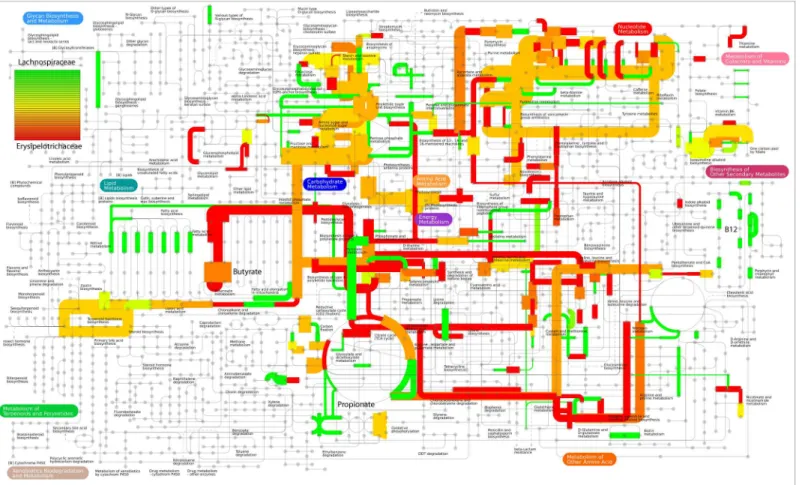
![Fig 3. Comparison of functional and taxonomic profiles of the Altered Schaedler Flora from the intestine of a NOD mouse model [13]](https://thumb-eu.123doks.com/thumbv2/123dok_br/17097928.237228/7.918.60.863.111.394/comparison-functional-taxonomic-profiles-altered-schaedler-flora-intestine.webp)
Documentos relacionados
In the present study, an analytical method for the determination of Gd-DTPA-BMA in liposomes by HILIC was developed, using chemometric tools, validated and applied for
A suitable high-performance liquid chromatography method was developed and validated, using LLE and SPE as the extraction procedures, for the simultaneous detection of
A simple, rapid, and sensitive luorimetric method was developed and validated to quantify curcumin in lipid and polymeric nanocapsule suspensions, using acetonitrile as a solvent..
Through the lenses of the Resource Based View (RBV), we discuss the role of product innovation, the case of The Judge revolver, as a resource for competitive advantage
Assim sendo, o objectivo do presente trabalho passou a centrar-se na comparação de contextos propícios e contra-indicados à busca e conquista de autonomia
A Interacção entre Professores e Pais A Socialização dos Professores c a Participação dos Pais na Escola Programáticos tratados nas Aulas» transmitido durante a Interacção com
A method was developed and validated in-house for determination of ochratoxin A (OTA) in wine using charge coupled device (CCD) to acquire the luorescence images of mycotoxin from
The method of DLLME optimized and validated for the quantification of parathion-methyl by GC/ECD was adequate and effective in the extraction of pesticides in water
