Artigo
*e-mail: [email protected]
DEVELOPMENT AND VALIDATION OF A DISSOLUTION TEST WITH REVERSED-PHASE LIQUID CHROMATOGRAPHY ANALYSIS FOR RUPATADINE IN TABLET DOSAGE FORMS
Sérgio Luiz Dalmora*, Daniele Rubert Nogueira, Guilherme Zanini Calegari, Ana Cláudia Bergamo e Fernanda Pavani Stamm Departamento de Farmácia Industrial, Universidade Federal de Santa Maria, 97105-900 Santa Maria - RS, Brasil
Recebido em 23/11/09; aceito em 15/1/10; publicado na web em 3/5/10
A dissolution test for in vitro evaluation of tablet dosage forms containing 10 mg of rupatadine was developed and validated by RP-LC. A discriminatory dissolution method was established using apparatus paddle at a stirring rate of 50 rpm with 900 mL of deaerated 0.01 M hydrochloric acid. The proposed method was validated yielding acceptable results for the parameters evaluated, and was applied for the quality control analysis of rupatadine tablets, and to evaluate the formulation during an accelerated stability study. Moreover, quantitative analyses were also performed, to compare the applicability of the RP-LC and the LC-MS/MS methods. Keywords: rupatadine; dissolution test; RP-LC.
INTRODUCTION
Dissolution test has emerged in the pharmaceutical ield as a very important tool to characterize drug product performance. Therefore the dissolution studies are used not only to assess batch-to-batch consistency of drug release from solid dosage forms, but they are also essential in several stages of formulation development, for screening and proper assessment of different formulations. Moreover, the in vitro dissolution studies are relevant to predict the in vivo performance of a drug release and have been used as a tool to estimate the bioavailability of the drug.1-6
Rupatadine, chemically (8-chloro-6,11-dihydro-11-[1-[(5-methyl3-pyridinyl) methyl]-4-piperidinylidene]-5H-benzo[5,6]-cyclohepta[1,2b]pyridine), is a new drug which represents a second generation of H1-antihistamine that inhibits both platelet activating factor (PAF) and histamine (H1) effects, through its interaction with speciic receptors.It is rapidly absorbed (Tmax = 0.75-1 h) after oral administration, and is subjected to extensive presystemic metabolism, with hepatic cytochrome P450 (CYP) 3A4 as the main enzyme involved in its biotransformation. Clinically is indicated for the ma-nagement of diseases with allergic inlammatory conditions, such as seasonal and perennial rhinitis, and chronic urticaria.7-9
The literature describes validated liquid chromatography tandem-mass spectrometry (LC-MS/MS) methods, with detection performed by positive atmospheric pressure chemical ionization (APCI) and gradient elution for LC analysis, for the simultaneous determination of rupatadine and its two active metabolites in human plasma after liquid-liquid extraction and enzymatic hydrolysis, supporting pharmacokinetic studies.9-13 Moreover, sensitive isocratic LC-MS/MS methods with
posi-tive electrospray ionization (ESI) were developed and validated for the quantitation of rupatadine in human plasma without determination of the main active metabolites,14 and with determination of the metabolite
desloratadine.15 For the analysis of rupatadine in tablet dosage forms, a
reversed-phase liquid chromatography (RP-LC) method was developed and validated over the concentration range of 0.5-400 µg/mL, using a C18 analytical column and isocratic elution with UV detection at 242 nm.16 Furthermore, stability-indicating methods were performed by
micellar electrokinetic capillary chromatography (MEKC),17 and
high-performance thin-layer chromatography (HPTLC),18 and applied for
the quantitative and qualitative analysis of rupatadine and its degraded products in pharmaceutical dosage forms.
At the moment rupatadine is not described in any pharmacopoeia and there are no speciications for the dissolution test. Therefore, the aim of the present study was to develop and validate a dissolution test condition for rupatadine tablets, using a RP-LC method for the quan-LC method for the quan-titative analysis of the drug in the dissolution medium, contributing to improve the quality control and to assure the therapeutic eficacy of the pharmaceutical product. Moreover, perform quantitative analysis of rupatadine by liquid chromatography tandem mass spectrometry (LC-MS/MS), demonstrating correlation and advantages of this technique for the dissolution rate studies.
EXPERIMENTAL
Chemicals and reagents
Rupatadine fumarate reference substance (purity, 99.4%) was purchased from Sequoia Research Products (Oxford, UK). The Ru-pain® (Biosintética, Brazil) tablets containing 10 mg of rupatadine
base were obtained from commercial sources within their shelf life period. HPLC-grade acetonitrile was obtained from Tedia (Fairield, USA). Hydrochloric acid (HCl), monobasic potassium phosphate, sodium acetate and ammonium acetate were purchased from Merck (Darmstadt, Germany). All chemicals used were of pharmaceutical or special analytical grade. For all the analyses, ultrapure water was puriied using an Elix 3 coupled to a Milli-Q Gradient A10 system (Millipore, Bedford, USA). The 0.01 and 0.1 M HCl, sodium acetate USP buffer (pH 4.5), and monobasic potassium phosphate USP buffer (pH 6.8) were prepared according to the directions in USP 32.4 The
pharmaceutical formulation excipients (magnesium stearate, micro-crystalline cellulose, lactose, pregelatinised starch, ferric oxide yellow and red) were obtained from different local distributors.
Apparatus
A Vankel VK7010 (Vankel Technology Group, Cary, USA) dissolution testing station multi-bath (n = 8) was used integrated with a VK 8000 dissolution sampling station, VK type bidirectional peristaltic pump and VK 750D digitally controlled heater/circulator.
detec-tor was set at 242 nm and peak areas were integrated automatically by computer using a Shimadzu Class VPV 6.14 software program. The LC-MS/MS experiments were performed on a triple quad-rupole mass spectrometer (Micromass, Manchester, UK), model Quattro LC, equipped with an electrospray ionization (ESI) source. The data acquisition and analysis were performed using a Masslynx (v 3.5) software program.
Preparation of reference solution
The reference substance solution of rupatadine was prepared by weighting accurately 12.80 mg of the reference substance, transferred to individual 10 mL volumetric lask and diluted to volume with methanol, obtaining a concentration of 1 mg/mLof rupatadine base. The stock solution was stored at 2-8 °C protected from light, and daily diluted to an appropriate concentration (11.11 µg/mL) in the dissolution medium. The solution was iltered in a 0.45 µm membrane ilter before injection in the column.
Chromatographic conditions
The RP-LC method applied for the analyses of the rupatadine release percent is described elsewhere.16 The elution was carried out
on a Phenomenex (Torrance, USA) Gemini C18 column (150 mm x 4.6 mm i.d., with a particle size of 5 µm and pore size of 110 Å). A security guard holder was used to protect the analytical column. The Shimadzu LC system was operated isocratically at controlled tem-perature of 30 °C using a mobile phase of ammonium acetate buffer (0.01 M, pH 3.0) with 0.05% of 1-heptanesulfonic acid/acetonitrile (71.5:28.5, v/v) run at a low-rate of 1.0 mL/min, and using PDA detection at 242 nm. The injection volume was 20 µL for both the reference substance and the samples.
Dissolution testing conditions
Rupatadine sink conditions are desirable,19 and were tested using
900 mL of 0.01 M HCl, sodium acetate buffer pH 4.5, phosphate buffer pH 6.8 and water, with an amount of the drug equivalent to three times the dose of the pharmaceutical formulation.
To evaluate possible adsorption of the drug and to remove inso-luble excipients that may cause high background or turbidity of the samples solution,20 the iltration procedure was performed using a 10
µm Full FlowTM Filters (Vankel Technology Group, Cary, USA), with
solutions at concentration of 11.11 µg/mL in dissolution medium. The dissolution rate studies of rupatadine from tablets were performed on a paddle-stirrer type of apparatus by a semi-automated system. Drug release tests were carried out according to conventional dissolution procedures recommended for single-entity products19,22 in
900 mL of different media such as 0.01 M HCl (50 and 75 rpm), 0.1 M HCl (50 rpm), sodium acetate buffer pH 4.5 (50 rpm), monobasic potassium phosphate buffer pH 6.8 (50 rpm), and water (50 rpm), for 1 h. The media were degassed by heating followed by vacuum iltration. The temperature of the cell was maintained at 37 ± 0.5 ºC by using a thermostatic bath, and the glass dissolution vessels were covered to minimize evaporation. At each sample time interval (2, 5, 10, 15, 30, 45 and 60 min), an exact volume of the sample (5 mL) was withdrawn from each lask and immediately replaced with an identical volume of fresh medium to maintain a dissolution sink condition. The concentrations of rupatadine in the dissolution medium were deter-mined by the RP-LC method, and a correction factor was included in the calculations for the drug lost in the sampling. The cumulative percentage of drug released was plotted against time, in order to obtain the release proile and to calculate the in vitro dissolution data
(n = 6). The dissolution proiles of rupatadine tablets were evaluated using the concept of dissolution eficiency (DE), calculated from the area under curve (AUC) and expressed as a percentage of the area of the rectangle described by 100% dissolution in the same time.23
Validation of the dissolution method
The method was validated using samples of pharmaceutical for-mulations with the label claim of 10 mg, and the quantitative analysis performed by RP-LC method demonstrating the capability for disso-lution test purposes, by the determination of the following parameters: speciicity, linearity, precision, accuracy, robustness and stability, according to the USP Pharmacopoeia, and the ICH guideline.4,24
Speciicity was evaluated by analyzing a sample containing only placebo (in-house mixture of all the tablet excipients). The concentra-tion of the excipients was calculated for a medium weight of content (these concentrations were determined based in Handbook of Phar-maceutical Excipients).25 The samples of placebo were transferred to
separate vessels (n = 3) with 900 mL of dissolution medium at 37 ± 0.5 ºC, and stirred for 45 min at 50 rpm using paddle (USP apparatus 2). Aliquots were withdrawn and analyzed by the LC method.
Linearity was determined by constructing three analytical curves, each one with six reference substance concentrations of rupatadine, in the range of 1–30 µg/mLprepared in 0.01 M HCl. Three replicates of 20 µL injections of the reference solutions were tested in order to verify the repeatability of the detector response. The peak areas of the chromatograms were plotted against the respective concentrations of rupatadine to obtain the analytical curve. The linearity was evalu-ated by linear regression analysis by the least square method and by ANOVA statistical analysis.
The precision of the method was determined by repeatability and intermediate precision and was evaluated through the relative standard deviation (RSD%). Repeatability was assessed after subjected six ta-blets of rupatadine to the dissolution test conditions, on the same day and under the same experimental conditions. The intermediate precision of the method was assessed by carrying out the dissolution test of six tablets on two different days (inter-days), and also using another HPLC equipment (Shimadzu LC system, CBM-20A Prominence).
The accuracy was evaluated by adding known amounts of the re-ference substance to the placebo sample in the dissolution medium at 80, 100 and 120% of the nominal assay of rupatadine, corresponding to the concentrations of 8.89, 11.11 and 13.33 µg/mL, respectively. The accuracy was calculated as the percentage of the drug recovered from the formulation matrix and also expressed as the percentage relative error (bias %) between the measured mean concentrations and added concentrations. Each concentration was prepared in duplicate and was injected in triplicate.
The robustness of an analytical procedure refers to its ability to remain unaffected by small but deliberate variations in method parameters and provides an indication of its reliability for the routine analysis. It was evaluated determining how the inluence of deaeration affects the release of rupatadine from the tablets. The dissolution proiles obtained using deaerated medium were compared to those not subjected to the deaeration process.
To assess the stability of rupatadine in the dissolution medium, the samples were diluted in 0.01 M HCl, and tested after 24 h at room temperature and also kept at 37 ± 0.5 ºC for 2 h. The stability of these solutions was studied comparing the chromatographic pattern with freshly prepared solutions.
LC-MS/MS conditions
system and a triathlon autosampler (Spark, Emmen, Holland) was used. The experiments were carried out on a reversed phase Pheno-menex (Torrance, USA) Gemini C18 column (150 x 4.6 mm I.D., 5µ). The LC system was operated isocratically at controlled temperature (35 ºC) using a mobile phase of methanol: acetonitrile: 100 mM acetic acid (50:40:10, v/v/v). The low rate was 0.8 mL/min (split 1:6) and the injection volume was 30 µL for both standard and samples. The triple quadrupole mass spectrometer, equipped with ESI source in the positive mode, was set up in multiple reaction monitoring (MRM) mode, monitoring the transitions 416.1>282.1 and 315.1>242.1, for rupatadine and clomipramine (IS), respectively. For the optimization of mass spectrometer conditions, a mixed standard solution (1000 ng/mL) containing rupatadine and IS was directly introduced into the system and the following parameters were selected: capillary potential of 3 kV, a cone voltage of 30 V, a RF lens voltage of 0.5 V, a source temperature of 120 ºC, and ESI probe temperature of 350 ºC, respectively. For the quantitative analysis, the dissolution samples were diluted to 1 µg/mL before injection in the LC-MS/MS system, and the concentrations of the unknown solutions were calculated based on the analytical curve previously determined.
Accelerated stability study
Samples of rupatadine tablets were stored for six months under accelerated conditions of temperature and humidity (40 ± 2 °C/75 ± 5% RH) in a climatic chamber (Tecnal, Brazil).26,27 The quantitative
analyses of the samples were performed by the previously validated RP-LC method,16 and the dissolution test by the method developed in
the present study. Moreover, the rupatadine tablets were evaluated on the basis of weight variation, disintegration, hardness and friability tests, following the speciications,28 and the results were compared
at the initial and inal time points (0 and 6 months, respectively).
RESULTS AND DISCUSSION
Development of the dissolution test
The dissolution test is widely used as in vitro test to determine the release rate of drug products and to assure the quality of solid dosage forms by the pharmaceutical industry and regulatory agencies.29
The sink conditions were determined and expressed as percentage of drug released.
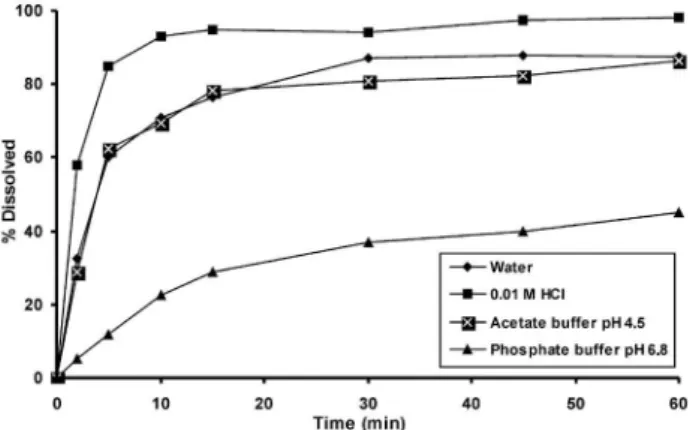
The dissolution medium was selected based on the solubility data and the screening study. Rupatadine showed signals of insta-bility in the 0.1 M HCl, with changes in the chromatographic pat-tern. The results showed that 0.01 M HCl was the best dissolution medium, since it provides the highest drug release percent and also ensured sink conditions. The dissolution proiles obtained with the different media tested are presented in Figure 1. The comparison of the dissolution proiles was performed using the concept of dissolution eficiency (DE), and also by the Tukey’s test, showing that phosphate buffer pH 6.8 medium was signiicantly different from the other media tested with low solubility. The calculated DE values are shown in Table 1.
The USP apparatus 2 (paddles) was chosen due to its acceptance as a standard procedure for tablets, and is frequently used at 50 or 75 rpm.20 Thus, non-signiicant difference was observed in the total drug
released from the pharmaceutical formulation using 50 or 75 rpm, but the stirring rate of 50 rpm was selected as mild condition that allowed maximum discriminating power. Finally, the evaluation of the 10 µm Full FlowTM Filters demonstrated that there was no interference in the
analysis, giving values within 98-102% 20,21 for the iltered samples
compared to the centrifuged solutions.
Based on these results, USP apparatus 2 (paddle) at a stirring rate of 50 rpm was selected using 900 mL of 0.01 M HCl as the dissolution medium, for 45 min.
Results of the dissolution method validation
The speciicity of the method towards the drug was established through the determination of the peak purity of the analyte using PDA detector which gave index in the range of 0.999-1. No interference from formulation excipients was found, showing that the peak was free from any coeluting peak, thus demonstrating that the proposed method is speciic for the analysis of rupatadine (Figure 2).
The analytical curves constructed for rupatadine were found to be linear in the 1–30 µg/mLrange. The value of the determination coeficient calculated (r2=0.9999, y = 37111.98x – 8510.96, where, x is concentration
and y is the peak absolute area) indicated the linearity of the analytical curve for the method. The validity of the three analytical curves was veriied by means of ANOVA, which demonstrated signiicant linear regression (p<0.05) and non-signiicant deviation from linearity (p>0.05).
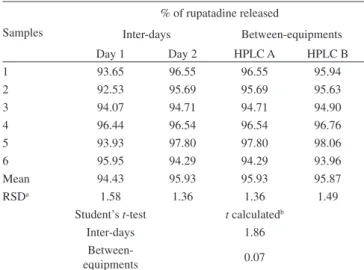
The precision evaluated as the repeatability shown RSD value of 1.57%. The RSD values obtained during the intermediate precision evaluation, on two different days and using another HPLC system, were 1.11 and 0.04%, respectively. The values were submitted to statistical analysis using Student’s t-test, showing non-signiicant difference (p>0.05), as shown in Table 2. These results demonstrated the good precision of the method for the dissolution test.
The accuracy was assessed from three replicate determinations of three different samples containing 8.89, 11.11 and 13.33 µg/mL of rupatadine, giving concentrations respectively of 8.76, 11.13 and 13.39 mg/mL, with RSD lower than 1.91%. The recoveries obtained
with a mean value of 99.74% and bias lower than 1.46%, demonstrated that the method is accurate for its intended use.
Certain drug and formulations are sensitive to dissolved air in the dissolution medium,19 which was tested showing that there was
Table 1. Dissolution eficiency (DE) values obtained from dissolution tests asses-sed with different dissolution media, apparatus paddle and stirring rate of 50 rpm
Dissolution medium DE ± RSDa
Hydrochloric acid 0.01 M 93.21 ± 2.39 Monobasic potassium phosphate buffer pH 6.8 71.73 ± 2.73 Sodium acetate buffer pH 4.5 87.65 ± 1.51
Water 88.51 ± 0.81
aRSD = Relative standard deviation
no interference in the dissolution proile of rupatadine, indicating the robustness of the method.
The stability test of sample solutions showed that rupatadine was stable in the dissolution medium when maintained at room temperature for 24 h and at 37 ºC for 2 h. The results were within the acceptable range, between 98-102% of the initial value,21
allow-ing to maintain the integrity of the drug durallow-ing all the analysis time.
Method application
The validated dissolution method was applied for the stud-ies of rupatadine in tablet dosage forms (n=12), performing the quantitative analysis by a validated RP-LC method, and also by an alternative LC-MS/MS method. The internal standard was used only for the LC-MS/MS analysis to compensate possible detec-tion variadetec-tions. The percentage of rupatadine released evaluated by the quantitative methods and the RSD values are shown in Table 3, demonstrating that a dissolution greater than 90% was
achieved in 30 min, meeting the acceptance criteria which claims the range of 70-80% 20
The proposed discriminative dissolution method was also applied during an accelerated stability study (40 ± 2 °C/75 ± 5% RH) for 6 months. The method was applied to dissolution rate studies which were performed at 0, 3 and 6 months. The dissolution proiles were compared by the dissolution eficiency (DE), and the analysis of variance showed that the proiles were similar (Fcal = 0.13 < Fcrit = 3.59) with non-signiicant differences (p>0.05), as shown in Figure 3. The rupatadine content was evaluated by the LC method, demonstra-ting signiicant decomposition according to ICH guidelines26 for the
batch tested (> 5%). The results of weight variation, disintegration, hardness and friability are in accordance with pharmacopoeial limits and speciications, as shown in Table 4.
CONCLUSION
The dissolution test developed for the analysis of rupatadine tablets by RP-LC method was validated showing to be speciic, accurate, precise and linear, without any interference from the excipients. The LC-MS/MS analyses were also performed dem-onstrating to be a valid alternative with low time consumption for the dissolution studies. Moreover, the dissolution method was considered satisfactory since the stability of the drug in the dissolution medium and the ilter suitability were guarantee. Therefore, the proposed method was successfully applied and suggested for the quality control and stability studies of rupata-the quality control and stability studies of rupata-dine in pharmaceutical dosage forms, contributing to assure the therapeutic eficacy of the drug.
ACKNOWLEDGMENTS
The authors wish to thank CNPq (Conselho Nacional de Desenvolvimento Cientíico e Tecnológico) and CAPES (Coor-denação de Aperfeiçoamento de Pessoal de Nível Superior) for the support.
Table 2. Repeatability and intermediate precision of the dissolution method
Samples
% of rupatadine released
Inter-days Between-equipments Day 1 Day 2 HPLC A HPLC B
1 93.65 96.55 96.55 95.94
2 92.53 95.69 95.69 95.63
3 94.07 94.71 94.71 94.90
4 96.44 96.54 96.54 96.76
5 93.93 97.80 97.80 98.06
6 95.95 94.29 94.29 93.96
Mean 94.43 95.93 95.93 95.87
RSDa 1.58 1.36 1.36 1.49
Student’s t-test t calculatedb
Inter-days 1.86
Between-equipments 0.07
aRSD = Relative standard deviation; bt critic for p = 0.05 (2.23)
Table 3. Percentage of rupatadine released in the dissolution test by RP-LC and LC-MS/MS methods (n=12), using 0.01 M HCl medium, apparatus paddle and stirring rate of 50 rpm
Time (min) RP-LCa (%) RSDb (%) LC-MS/MSa (%) RSDb (%)
2 66.51 6.29 58.91 8.56
5 92.59 3.47 88.84 5.25
10 94.35 3.11 91.36 4.28
15 96.27 1.54 93.59 4.13
30 97.40 1.65 98.31 5.31
45 98.89 1.39 99.47 3.22
60 99.29 0.96 100.36 2.89
a Mean of three replicates; bRSD = Relative standard deviation
Table 4. Accelerated stability study: assay and physico-chemical tests per-formed at the initial and inal time points
Month Assay (%) Mean weightmg ± SDa c Humidity
(%)
Disintegrationd time (s)
Friabilitye (%)
Hardnessf (N)b 0 99.15 98.44 ± 1.98 5.58 35 0.02 52.90 6 91.86 98.29 ± 1.90 1.84 60 0.02 50.02 aSD = Standard deviation; b N = Newton Speciications: cMean ± 7.5%; dmaximum 30 min in water, emaximum 1.5%; fminimum 30 N.
Figure 2. Typical RP-LC chromatogram of (A) rupatadine reference substance (11.11 µg/mL) in 0.01 M HCl, (B) placebo solution after dissolution with 0.01 M HCl using apparatus 2 at stirring rate of 50 rpm
REFERENCES
1. Furlanetto, S.; Maestrelli, F.; Orlandini, S.; Pinzauti, S.; Mura, P.; J. Pharm. Biomed. Anal. 2003, 32, 159.
2. Ambike, A. A.; Mahadik, K. R.; Paradkar, A.; Int. J. Pharm. 2004, 282,
151.
3. Shah, V. P.; Noory, A.; Noory, C.; McCullough, B.; Clarke, S.; Everett, R.; Naviasky, H.; Srinivasan, B. N.; Fortman, D.; Skelly, J. P.; Int. J. Pharm. 1995, 125, 99.
4. The United States Pharmacopoeia, 32th ed., United States Pharmaco-poeial Convention: Rockville, 2009.
5. Azarmi, S.; Roa, W.; Löbenberg, R.; Int. J. Pharm. 2007, 328, 12. 6. Fronza, M.; Brum Jr, L.; Wrasse, M.; Barth, T.; Dalmora, S. L.; Acta
Pharm. Bonae. 2006, 25, 117.
7. Merlos, M.; Giral, M.; Balsa, D.; Ferrando, R.; Queralt, M.; Puigdemont, A.; García-Rafanell, J.; Forn, J.; J. Pharmacol. Exp. Ther. 1996, 280, 114.
8. Solans, A.; Izquierdo, I.; Donado, E.; Antonijoan, R.; Peña, J.; Nadal, T.; Carbó, M.; Merlos, M.; Barbanoj, M.; Clin. Ther. 2008, 30, 1639.
9. Izquierdo, I.; Merlos, M.; Garcia-Rafanell, J.; J. Drugs Today 2003, 39, 451.
10. Izquierdo, I.; Nieto, C.; Ramis, J.; Cooper, M.; Dewland, P.; Forn, J.;
Meth. Find. Exp. Clin.Pharmacol. 1997, 19-Suppl. A, 189.
11. Picado, C.; Expert. Opin. Pharmacother. 2006, 7, 1989.
12. Barbanoj, M. J.; Garcia-Gea, C.; Antonijoan, R.; Isquierdo, I.; Donado, E.; Perez, I.; Solans, A.; Jane, F.; Hum. Psychopharmacol. Clin. Exp.
2006, 21, 13.
13. Solans, A.; Carbó, M. L.; Pena, J.; Nadal, T.; Izquierdo, I.; Merlos, M.;
Clin. Ther. 2007, 29, 900.
14. Tian, Y.; Zhang, J.; Lin, H.; Liang, J.; Zhang, Z.; Chen, Y. J.; Pharm. Biomed. Anal. 2007, 47, 899.
15. Wen, J.; Hong, Z.; Wu, Y.; Wei, H.; Fan, G.; Wu, Y.; J. Pharm. Biomed. Anal. 2009, 49, 347.
16. Nogueira, D. R.; D’Avila, F. B.; Rolim, C. M. B.; Dalmora, S. L.;
Chromatographia 2007, 66, 915.
17. Nogueira, D. R.; Sangoi, M. S.; Silva, L. M.; Todeschini, V.; Dalmora, S. L.; J. Sep. Sci. 2008, 31, 3098.
18. Shirkhedkar, A. A.; Thorve, R. R.; Fursule, R. A.; Surana, S. J.; Acta Chromatogr. 2008, 20, 423.
19. FDA; Guidance for Industry: Dissolution Testing of Immediate Release Solid Oral Dosage Forms, Food and Drug Administration: Rockville, 1997.
20. The United States Pharmacopoeia, Pharmacopeial Forum, 2004, vol. 30, 351.
21. Marques, M. R. C.; Brown, W.; Analytica 2002, 1, 48. 22. Moore, J. W.; Flanner, H. H.; Pharm. Technol. 1996, 20, 64.
23. Khan, K. A.; J. Pharm. Pharmacol. 1975, 28, 48.
24. International Conference on Harmonisation (ICH) of Technical Require-ments for the Registration of Pharmaceutical for Human Use, Validation of Analytical Procedures: Text and Methodology Q2(R1); November,
2005, p. 1-13, Geneva.
25. Wade, A.; Weller, P. J.; Handbook of Pharmaceutical Excipients, 2nd ed., falta editor: cidade, 1994.
26. International Conference on Harmonisation (ICH) of Technical Require-ments for the Registration of Pharmaceutical for Human Use, Stability Testing of New Drugs Substance and Products Q1A(R2); February,
2003, p. 1-18, Geneva.
27. BRASIL. Agência Nacional de Vigilância Sanitária; RE nº 1, de 29 de julho de 2005. Guia para a Realização de Estudos de Estabilidade,
Diário Oicial da União, Brasília, 01/08/2005.
28. Farmacopéia Brasileira; 4ª ed., Atheneu: Rio de Janeiro, 1988. 29. Shah, V. P.; Lesko, L. J.; Fan, J.; Fleischer, N.; Handerson, J.; Ma-29. Shah, V. P.; Lesko, L. J.; Fan, J.; Fleischer, N.; Handerson, J.;