of Cerebral Cortical Folding Patterns
Deborah A. Striegel*, Monica K. Hurdal
Department of Mathematics, Florida State University, Tallahassee, Florida, United States of America
Abstract
The mechanism for cortical folding pattern formation is not fully understood. Current models represent scenarios that describe pattern formation through local interactions, and one recent model is the intermediate progenitor model. The intermediate progenitor (IP) model describes a local chemically driven scenario, where an increase in intermediate progenitor cells in the subventricular zone correlates to gyral formation. Here we present a mathematical model that uses features of the IP model and further captures globalcharacteristics of cortical pattern formation. A prolate spheroidal surface is used to approximate the ventricular zone. Prolate spheroidal harmonics are applied to a Turing reaction-diffusion system, providing a chemically based framework for cortical folding. Our model reveals a direct correlation between pattern formation and the size and shape of the lateral ventricle. Additionally, placement and directionality of sulci and the relationship between domain scaling and cortical pattern elaboration are explained. The significance of this model is that it elucidates the consistency of cortical patterns among individuals within a species and addresses inter-species variability based on global characteristics and provides a critical piece to the puzzle of cortical pattern formation.
Citation:Striegel DA, Hurdal MK (2009) Chemically Based Mathematical Model for Development of Cerebral Cortical Folding Patterns. PLoS Comput Biol 5(9): e1000524. doi:10.1371/journal.pcbi.1000524
Editor:Karl J. Friston, University College London, United Kingdom
ReceivedFebruary 23, 2009;AcceptedAugust 27, 2009;PublishedSeptember 25, 2009
Copyright:ß2009 Striegel, Hurdal. This is an open-access article distributed under the terms of the Creative Commons Attribution License, which permits unrestricted use, distribution, and reproduction in any medium, provided the original author and source are credited.
Funding:DAS is supported by Florida State University for graduate studies. The funders had no role in study design, data collection and analysis, decision to publish, or preparation of the manuscript.
Competing Interests:The authors have declared that no competing interests exist.
* E-mail: [email protected]
Introduction
Cerebral cortical patterns have fascinated scientists for centuries with their beauty and complexity. Numerous groups relate malformations in sulcal patterns to different diseases in humans, such as autism [1] and attention deficit/hyperactivity disorder (ADHD) [2]. Though many advances have occurred in cortical development and sulcogenesis, the understanding of how sulci form and what factors determine the placement of sulci is still limited. The cerebral cortex across species displays a variety of shapes and sizes and also wide array of sulcal patterning. Studying the evolutionary development of sulcal patterns might provide clues about the cortical development taking place in humans.
A major advance in determining how these sulcal patterns form was the introduction of the axonal tension hypothesis [3]. This hypothesis describes a mechanically-based scenario where axonal tension, created by developing corticocortical connections in strongly interconnected regions, pulls together gyral walls and creates a folding pattern. This hypothesis furthered the concept that variability between folding patterns among individuals is genetically driven, not just the consequence of random mechanical buckling from a confined cortex. Other mechanochemical models have also been proposed to explain morphogenesis in the central nervous system [4].
Recently, it has been suggested that a cortical pattern can arise based on regional patterns of intermediate progenitor (IP) cells in the subventricular zone (SVZ) [5]. The intermediate progenitor model, which builds upon the intermediate progenitor cell hypothesis [6], states that during the development of the cortex certain radial glial cells in the ventricular zone (VZ) are activated
to create IP cells that travel to the SVZ. These IP cells amplify the amount of neurons created in a given radial column. Furthermore, a subset of IP cells creates a local amplification of neurons in upper cortical layers surrounded by areas of non-amplification, resulting in a wedge shape in the cortex. This wedge shape is representative of a gyrus. This new hypothesis is still being debated [7,8] and, if correct, could be a scenario for chemically-based pattern formation in the cortex.
Here, a relatively simple and, we believe, elegant chemically-driven mathematical model is proposed to explain how IP cell subsets are distributed spatially and temporally in the developing cortex. Our model, which we call the Global Intermediate Progenitor (GIP) model, uses a Turing reaction-diffusion system [9] containing an activator and inhibitor on a prolate spheroidal surface to determine regional areas of activation of the production of IP cells. The GIP model allows determination of the placement of the initial sulci underlying observed complex cortical patterns. It also demonstrates that the initial folds of the arising sulcal pattern are governed by the global shape of the lateral ventricle. The dependency on the global shape provides a critical piece to the puzzle of cortical development.
Model
In the Intermediate Progenitor Model, sulci occur based on the distribution of IP cells during cortical development. Mutations of
We assume an activator and inhibitor are travelling throughout the VZ, which is located in the lateral wall of the lateral ventricle. The lateral ventricle is a c-shaped cavity located in both hemispheres of the cerebral cortex [11] as shown in Figure 1. The proposed GIP model approximates the shape of the lateral ventricle with a prolate spheroid and the VZ with a prolate spheroidal surface. This allows the capture of key domain shape characteristics (the eccentricity of the lateral ventricle) with the focal distance (f) of a prolate spheroid.
Also, there are multiple discrete time intervals where the distribution of the reactants determines the creation of IP cells. These time intervals represent the temporal windows [5] for the production of neurons in the upper cortical layers. This assumption allows for the layering of multiple patterns to form based on distributions of an activator and inhibitor.
Reaction-Diffusion System
The patterns created by Turing reaction-diffusion systems have been used to describe pattern formation in numerous biological systems [12]. Though biological Turing patterns have not been proven as rigorously as chemical Turing patterns [13], recent results [14] give supporting evidence of Turing patterns formation in a biological setting. A Turing system is a reaction-diffusion
system, given by
Ut~dd+2UzF(U,V)
and ð
1aÞ
Vt~d+2VzG(U,V), ð1bÞ
containing an activator (U) and an inhibitor (V) that are diffusing throughout their domain and interacting with each other as described by the reaction kinetics (FandG). The reaction kinetics chosen for the GIP model are from the Barrio-Varea-Maini (BVM) [15] system given by
ut~dd+2uzau1{r1v2zvð1{r2uÞ,
and ð
2aÞ
vt~d+2vzbv 1z ar1
b uv
zuðczr2vÞ ð2bÞ
where (u,v) = (U2U0,V2V0) and (U0,V0) is the steady state. Not
much is known about the possible interactions betweenu and v
that regulate the production of IP cells. Hence the BVM system is ideal because the kinetic equations do not assume any prior knowledge of how the reactants (activator and inhibitor) interact and instead takes a phenomenological approach. These kinetics (Equations 2a,b) also provide control over the amount of linear (a
andcforu; andbforv), quadratic (r2), and cubic (r1) interactions. The diffusivity ratio and domain scaling are given byd and d, respectively. Key aspects of the system that determine what pattern will arise include the ratio of the diffusivities of the activator and inhibitor, domain scale and shape, and quadratic versus cubic terms in the kinetic reactions [12,16].
In order to analyze the nonlinear BVM system, the kinetics are approximated linearly by expanding them in a Taylor series around the steady state and neglecting higher order terms resulting in
ut vt
~Dd+2 u v
zA u v
whereD~ d 0
0 1
andA~ Fu Fv Gu Gv
(0,0) :ð3Þ
Solutions of Equation 3 are of the form (u, v) = TT(t)XX(xx). The temporal solution is TT(t) = el(k2)t, where l(k2) is the temporal eigenvalue. The spatial solution solves the Helmholtz Equation (=2X+k2X = 0) in the given domain where k2 is the spatial eigenvalue.
Turing patterns have been studied in depth in 1D [12], 2D [17], and spherical domains [18]. In all these domains, the solution to the domain’s associated eigenvalue problem can predict which pattern will form. For a spherical domain, the eigenvalue solution yieldsk2=n(n+1)/r2, wherenis the spherical harmonic index andr
is the radius. An increase ink2, which depends on domain scaling when diffusion coefficients are held constant, results in an increase innand changes the predicted Turing pattern. Here, we derive a formula that predicts the Turing pattern observed on a prolate spheroidal surface which represents the SVZ.
Prolate Spheroidal Surface
A prolate spheroid is created by rotating an ellipse about its major axis. It has a focal distancef~pffiffiffiffiffiffiffiffiffiffiffiffiffiffia2{b2, whereaandbare the major and minor axes, respectively. Spheroidal coordinates are expressed as (j,g,Q) wherejis the radial term;g= cosh, whereh is the asymptotic angle with respect to the major axis; andQis the rotation term.
Figure 1. Approximation of lateral ventricle with prolate spheroid. A. Position of lateral ventricle with respect to cerebral cortex.B.The shape of the lateral ventricle can be approximated with a prolate spheroid. The poles of the anterior and inferior horns map to the north and south poles of the prolate spheroid, respectively. doi:10.1371/journal.pcbi.1000524.g001
Author Summary
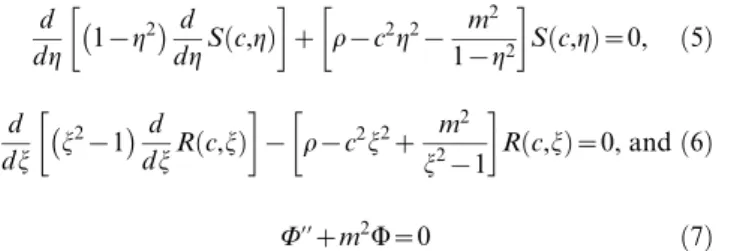
To predict which pattern will emerge, the Helmholtz equation is expanded with respect to the prolate spheroidal coordinate system [19] resulting in
L
Lj j
2{1
L
Ljz L
Lg 1{g
2
L
Lgz
j2{g2 j2{1
1{g2 ð Þ
L2
Lw2zc 2j2{g2
" #
X~0,ð4Þ
wherec~1
2k:f. Because the Helmholtz equation (= 2
X+k2X = 0) is separable in prolate spheroidal coordinates, we rewrite XX in terms of XX =R(c,j)S(c,g)W(Q), such that S(c,g), R(c,j), and W(Q) satisfy
d dg 1{g
2
d
dgS cð ,gÞ
z r{c2g2{ m2 1{g2
S cð ,gÞ~0, ð5Þ
d dj j
2{1
d
djR cð ,jÞ
{ r{c2j2z m2 j2{1
R cð ,jÞ~0, andð6Þ
W’’zm2W~0 ð7Þ
wheremand rare separation constants. Since multiple, discrete values ofrare possible for a givenmandris also dependant onc, the notation will bermn(c).
Because our domain is a prolate spheroidal surface, the
radially-invariant solution is needed (i.e. dR
dj~0). In order for Equation 6 to hold,rmnð Þc{c2j2z
m2
j2{1 must equal zero for a nontrivial solution. This results in
k2~ 4
f2j2 0
rmn 1 2k:f
z m
2
j20{1 !
|fflfflfflfflfflfflfflfflfflfflfflfflfflfflfflfflfflfflfflfflfflfflfflfflffl{zfflfflfflfflfflfflfflfflfflfflfflfflfflfflfflfflfflfflfflfflfflfflfflfflffl} Amn
, ð8Þ
where j0 is the spheroidal radius of the shell that conserves a surface area of 4p (comparable to the surface area of a unit sphere).
The significance of the formula in Equation 8 is that it relates a given domain size (controlled by k2) and domain shape (the eccentricity of the prolate spheroid controlled byf) to the arising pattern. To demonstrate this formula’s ability to predict pattern formation, the system (Equations 2a, b) is discretized similar to that of a sphere [18]. A forward-Euler finite difference scheme is used andu andv are discretized such thatu(g, Q) = (21+h1dg,h2dQ) whereh1= 0,..,34, andh2= 0,..,68. The continuity with respect to
garound the north and south poles is maintained as described in [18] and periodic boundary conditions are used for Q. In Figure 2A,Amnis plotted forn= 0,..,7 andm= 0,..,n. Numerous simulations were executed and two are shown here. The first simulation (Figures 2B and 2C) corresponds to k2= 30. When
k2= 30 (asterisk in middle) is plotted on the Amn vs. k graph (Figure 2A),k2corresponds withA35and predicts a (3, 5) pattern that agrees with the numerical simulation (Figures 2B and 2C). The second simulation corresponds tok2= 60 (Figure 2D and 2E) and when plotted (top right asterisk) on the Amn vs. k graph, predicts a (7, 7) pattern that is observed in the numerical simulation.
Results
A few key observations will be addressed. Qualitatively, as the domain scaling (i.e.,k2) increases, the resulting pattern becomes more elaborate. This result correlates with observations that relate the surface area of the VZ (or size of the founding radial glial cell population) to cortical surface area and hence, to the elaboration of the cortical pattern. The elaboration spans from no pattern observed for smaller surface areas of the VZ (and smaller-scaled cortices) to elaborate patterns observed for larger surface areas of the VZ (and larger cortices) [20].
Figure 2. Computer modeling verification of spheroidal mode equation (Equation (8)). A. Graph ofAmnforn= 0, .., 7 (different colors) and m= 0, ..,n(different linestyles, beginning withm= 0 on the bottom andm=non top) withf= 1. The black asterisks indicatek2=Amn= 30 (middle
asterisk) and 60 (top right). The asterisk fork2= 30 corresponds toA35predicting the pattern (3,5), whereas the asterisk fork2= 60 predicts the pattern
(7,7). Discretizations of Equations 1a,b corresponding to k2= 30 and 60, as shown in Figures B–E agree with these predictions. B. Results of
discretization of Equations 1a,bford= 0.013 (corresponding tok2= 30),a= 0.899,b=20.91,c=20.899,D= 0.5319,r1= 3.5, andr2= 0.C. Projection of
B onto a prolate spheroid (f= 1) such that top (bottom) edge of B maps to the north (south) pole of the spheroid.D. andE. Same as B and C except
Sectorial and Transverse Sulci
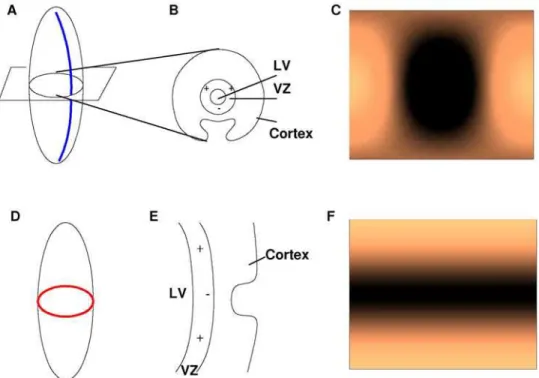
The model presented here addresses the directionality of the initial sulci formed. In order to use the predictive power of the proposed prolate spheroidal harmonic system, sulci need to be formulated in terms of prolate spheroidal harmonics. Since the initial sulcal formations mimic stripes, only the prolate spheroidal harmonics resulting in striped patterns were studied. In order to form a sulcus, the gyral banks on either side of the sulcus need to be created. In terms of the production of IP cells, the areas on either side of the sulcus will need to be ‘activated’ while the area of the sulcus is ‘not activated’ (see Figure 3B and 3E).
The two sulcal directions considered are sectorial and transverse. Sectorial sulci extend in the direction from the frontal lobe around the Sylvian fissure to the temporal lobe. This represents the direction of the major axis of the prolate spheroid approximating the lateral ventricle as shown in Figure 3A. The alignment of sulcal pits (deepest part of sulcus) along the major axis of the lateral ventricle in the human has been shown [21]. In terms of spheroidal harmonics, the pattern of IP cells needed to create sectorial sulci is (m, n) = (1,1) for 1 sulcus (Figure 3C), (2,2) for 2 sulci, and so forth. Transverse sulci form in the direction of rings around the VZ as shown in Figure 3D. This direction corresponds to (0,2) for 1 sulcus (Figure 3F), (0,4) for 2 sulci, and so forth. In each species displaying a cortical pattern, a number of sectorial sulci (or sulcal pits) are observed. The exact number of sectorial sulci is not the focus here. Of interest, rather, are the occurrence of a transverse sulcus, the transition from transverse to sectorial sulci, and the role of lateral ventricular eccentricity.
Forf= 3 (Figure 4A), as the domain scaling (k2) increases,A11is reached first, followed sequentially byA02andA04. This sequence
corresponds to a sectorial sulcus forming first. If the focal distance is increased, e.g. iff= 4 (Figure 4B), there is a shift in the Amn curves and, ask2increases,A02will now occur beforeA11. This results in a transverse sulcus forming before the first sectorial sulcus. A further increase in focal distance to f= 6 (Figure 4C) again shifts theAmncurves, so thatA04now occurs beforeA11. Two transverse sulci will now form before a sectorial sulcus is created. These scenarios illustrate how focal distance plays a role in determining the order of pattern formation.
Discussion
The GIP model illustrates how sulcal placement and direction-ality is related to changes in focal distance. In order to determine the effect of changes in focal distance on cortical pattern formation, the evolutionary development of cortical patterns was examined. The lateral ventricle is a c-shaped cavity with an anterior horn that extends into the frontal lobe of the hemisphere and an inferior pole that enters the temporal lobe [11]. During the critical stages of brain development the volume of the lateral ventricle increases [22] which also increases the surface area of the lateral ventricle (i.e. k2increases) . Also, as species have evolved the neocortex has expanded, resulting in major evolutionary advances [23]. As the frontal and temporal lobes expand, the lateral ventricle extends into the lobes increasing the lateral ventricular eccentricity resulting in changes in the cortical pattern obtained. For example, overlaying an evolutionary ladder on the scenarios described in Figure 3 implies that the cortices of species on the lower rungs of the evolutionary ladder, such as the cat, do not display transverse sulci before the formation of sectorial sulci (Figures 4A and 5A). Following this evolutionary ladder, at some
Figure 3. Determination of prolate spheroidal harmonic needed to form a sectorial and a transverse sulcus. A.A prolate spheroid containing one sectorial sulcus.B.A crossection of Figure A displaying the necessary pattern for a sectorial sulcus to develop. Plus signs indicate areas of activation of the creation of IP cells, whereas negative signs denote nonactivation.C.Spheroidal harmonic (1,1) which matches the pattern needed for a sectorial sulcus to develop. The top (bottom) edge maps to the north (south) pole and the left and right edges connect.D.A prolate spheroid containing one transverse sulcus.E.A crossection of Figure D displaying the necessary pattern for a transverse sulcus to develop. Plus signs indicate areas of activation of the creation of IP cells, whereas negative signs denote nonactivation.F.Spheroidal harmonic (0,2) which matches the pattern needed for a transverse sulcus to develop.
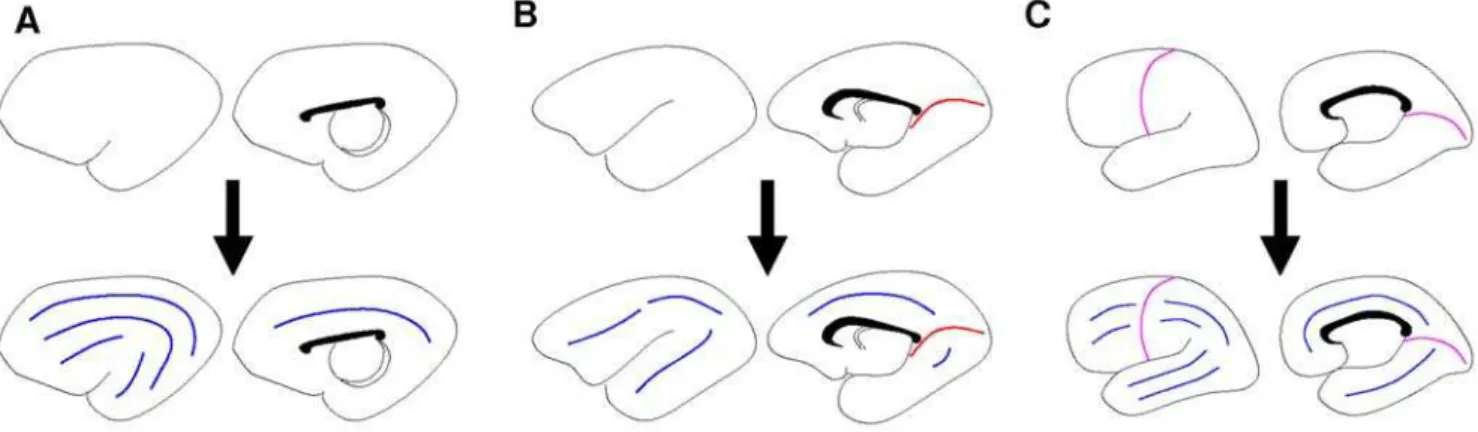
point the first transverse sulcus appears, as shown in Figure 4B. This second stage is representative of the formation of the calcarine sulcus in species such as the lemur (Figure 5B). Further along the evolutionary ladder, the second transverse sulcus appears (Figure 4C). This is representative of the central sulcus found in higher order primates such as the human (Figure 5C).
For humans, this predicted ordering of sulcal formation correlates well with what has been observed during development through the examination of naturally aborted fetuses [24] and MRI study on preterm infants [25]. The first sulci to appear are the anterior calcarine and central sulcus which are in the transverse direction (blue lines in Figure 5C). This is followed by the formation of the superior and inferior frontal sulci, superior and inferior temporal sulci, the intraparietal sulcus and the cingulated sulcus; all which form in the sectorial direction (red lines in Figure 5C).
The GIP model also provides a plausible explanation for the development of the central sulcus. Lemurs and humans are both members of the primate order. The lemur is of the suborder prosimian, which is the most primitive of the primates [26]. Most prosimians can be distinguished from anthropoids, the higher primates, by the absence of the central sulcus [26]. Therefore, this model links evolutionary development, through the lateral ventricular eccentricity, to the development of the central sulcus.
The GIP model is a theoretical model that builds upon the ideas of the IP model. One argument that has been presented against the intermediate progenitor model is that an ‘‘elaborately choreographed set of developmental instructions [regulating the production of IP cells] would be required to account for the tremendous complexity of human cortical convolutions’’ [7]. The beauty of the GIP model is that it provides an uncomplicated approach that relates to a biologically plausible mechanism of pattern formation. It uses chemical morphogens that may be governed by specific genes to control IP cell production, resulting in the ability to predict the placement and directionality of sulcal pattern formation.
The GIP model reveals the role that the global shape of the lateral ventricle has on the positioning of the initial sulci during cortical development. This model explains the development of the initial folds, particularly how two transerve sulci can form before any sectorial sulci in the human. There are many sulci, such as the precentral and postcentral sulcus, that form after this event which are not in the scope of this present work. Also, we believe the Sylvian fissure is formed by the c-shape of the lateral ventricle, which is not applicable to the model.
Lateral ventricular shape, or shape of any nontrivial object, is not easy to quantify. The GIP model approximates the lateral ventricle with a prolate spheroid allowing the capture of key shape
Figure 5. Predicted development of folds in cortices of 3 species.The sulcal patterns produced based on the lateral ventricular geometry shown in Figure 1, and the resulting bifurcations shown in Figure 4. The top row shows the formation of transverse sulci (red curve in B corresponding to the patternA02, magenta curves in C corresponding toA04). The bottom row shows the subsequent creation of a certain number of
sectorial sulci (blue curves) forA: cat,B: lemur,C: human. doi:10.1371/journal.pcbi.1000524.g005
Figure 4. Bifurcations occurring between sectorial and transverse curves. A. An illustration of the scenario of orderA11,A02,A04, which
occurs for fixed focal distances up to 3.7.B. Scenario of orderA02,A11,A04, which occurs for focal distances 3.7 to 5.6.C. Scenario of orderA02,A04,A11,
characteristics in one parameter, the focal distance (f). This approximation also gives the resulting patterns in terms of prolate spheroidal harmonics which contain an order based on the prolate spheroidal indices,mandn. The Helmholtz equation could also be solved on a given triangulated mesh representing the lateral ventricle resulting in a set of eigenvalues and eigenfunctions. The eigenfunction whose associated eigenvalue produces diffusion-driven instability would be the predicted pattern formed. A drawback of this latter approach occurs when comparing predicted patterns from different triangulated meshes. Since each mesh has its own parameterization there is no way of knowing which shape characteristic is responsible for the change in pattern formation.
Although changes in the volume of the lateral ventricle in humans during the developmental stages are documented [22], quantified data on the size and shape of the lateral ventricle during these critical stages is lacking. Further investigations into the size and shape of the lateral ventricle during developmental stages across species are needed. Such parameters could then be incorporated into the GIP model to test its cortical patterning predictions for specific species.
Also, further investigations into how the production of IP cells is regulated (i.e. how the activator and inhibitor interact) would enhance this model. Several genes (Pax6,Ngn2, andId4) have been shown to modulate the production of IP cells in mice [10]. Further studies into how this modulation occurs, and if this modulation changes evolutionarily, could be incorporated into the reaction kinetics in the GIP model enhancing the cortical patterning predictions.
In conclusion, this chemically-based mathematical model (the global intermediate progenitor (GIP) model) extends the interme-diate progenitor model [5], which describes local phenomena, to encapsulate global characteristics. In doing so, the GIP model shows how the global shape of the lateral ventricle, which drives the shape of the VZ, plays a key role in cortical pattern development. This model is able to capture changes in VZ shape along with the complementary role of domain scaling in only two parameters: 1) the focal distance of the prolate spheroid approximating the lateral ventricle, and 2)k2, which is dependent on domain scaling, as given by the formula in Equation 8. The model also has the ability to predict why the cortex of certain species may have little or no folding, and it accounts for the order and directionality of the sulci formed in different species. We consider this model a first step toward a chemically driven and mathematically predictive explanation of cortical folding develop-ment across species.
Acknowledgments
We would like to thank Andre´ Striegel, Washington Mio, and the anonymous reviewers for their constructive comments.
Author Contributions
Conceived and designed the experiments: DAS. Performed the experi-ments: DAS. Analyzed the data: DAS MKH. Wrote the paper: DAS MKH.
References
1. Levitt JG, Blanton RE, Smalley S, Thompson PM, Guthrie D, et al. (2003) Cortical Sulcal Maps in Autism. Cereb Cortex 13: 728–735.
2. Wolosin SM, Richardson ME, Hennessey JG, Denckia MB, Mostofsky SH (2007) Abnormal cerebral cortex structure in children with ADHD. Hum Brain Mapp 30: 175–184.
3. Van Essen DC (1997) A tension-based theory of morphogenesis and compact wiring in the central nervous system. Nature 385: 313–318.
4. Oster GF, Odell GM (1981) The mechanical basis of morphogenesis. Math Soc Sci 1: 433.
5. Kriegstein A, Noctor S, Martinez-Cerdeno V (2006) Patterns of neural stem and progenitor cell division may underlie evolutionary cortical expansion. Nat Rev Neurosci 7: 883–890.
6. Noctor S, Martinez-Cerdeno V, Ivic L, Kriegstein A (2004) Cortical neurons arise in symmetric and asymmetric division zones and migrate through specific phases. Nat Rev Neurosci 7: 136–144.
7. Van Essen DC (2007) Cause and effect in cortical folding. Nat Rev Neurosci 8: 12.
8. Kriegstein A, Noctor S, Martinez-Cerdeno V (2007) Perspective authors response: Patterns of neural stem and progenitor cell division may underlie evolutionary cortical expansion. Nat Rev Neurosci 8: 12.
9. Turing AM (1952) The chemical basis of morphogenesis. Philos T Roy Soc B 237: 37–72.
10. Pontious A, Kowalczyk T, Englund C, Hevner RF (2008) Role of Intermediate Progenitor Cells in cerebral cortex development. Dev Neurosci 30: 24–32. 11. Nieuwenhuys R, Donkelaar HJ, Nicholson C (1998) The central nervous system
of vertebrates. Berlin: Springer.
12. Murray JD (1989) in Mathematical Biology. New York: Springer, ed. 2. 13. Castets V, Dulos E, Boissonade J, Dekepper P (1990) Experimental-evidence of a
sustained standing Turing-type nonequilibrium chemical-pattern. Phys Rev Let 64: 2953–2956.
14. Maini PK, Baker RE, Chuong CM (2006) The Turing model comes of molecular age. Science 314: 1397–1398.
15. Barrio RA, Varea C, Aragon JL, Maini PK (1999) A two dimensional numerical study of spatial pattern formation in interacting Turing systems. B Math Biol 61: 483–505.
16. Ermentrout B (1991) Stripes or spots-nonlinear effects in bifurcation of reaction diffusion equations on the square. P Roy Soc Lon A Mat 434: 413–417. 17. Barrio RA, Varea C (2006) Non-linear systems. Physica A 372: 210–223. 18. Varea C, Aragon JL, Barrio RA (1999) Turing patterns on a sphere. Phys Rev E
60: 4588–4592.
19. Flammer K (1957) Spheroidal Wave Functions. Palo Alto: Stanford University Press.
20. Welker W (1990) Why does cerebral cortex fissure and fold? Cereb Cortex 83: 3–136.
21. Lohmann G, von Cramon DY, Colchester ACF (2008) Deep sulcal landmarks provide an organizing framework for human cortical folding. Cereb Cortex 18: 1415–1420.
22. Kinoshita Y, Okudera T, Tsuru E, Yokota A (2001) Volumetric analysis of the germinal matrix and lateral ventricles performed using MR images of postmortem fetuses. Am J Neuroradial 22: 382–388.
23. Rakic P (1995) A small step for the cell, a giant leap for mankind: a hypothesis of neocortical expansion during evolution. Trends Neurosci 18: 383–388. 24. Connelly C (1950) External Morphology of the Primate Brain. Springfield, IL:
Charles C. Thomas. pp 154–158.
25. Dubois J, Benders M, Cachia A, Lazeyras F, Leuchter RHV, et al. (2007) Mapping the early cortical folding process in the preterm newborn brain. Cereb Cortex 18: 1444–1454.