E
NERGY AND
E
NVIRONMENT
Volume 3, Issue 2, 2012 pp.295-304
Journal homepage: www.IJEE.IEEFoundation.org
Development of a site-independent mathematical model
for the estimation of global solar radiation on earth’s
surface around the globe
Iranna Korachagaon
1, V.N. Bapat
21 Annasaheb Dange College of Engineering and Technology, Ashta – 416 301, Sangli, India.
2 Ganga Institute of Technology and Management, Kablana, Jhajjar, Haryana – 124 104, India.
Abstract
Measured air temperature, relative humidity, wind and moisture measurements for 210 sites around the earth were used for the model development. The models were formulated using multi-parameter input regression type empirical relations. The estimation of Global Solar Radiation (GSR) were made using various combinations of data sets, with use of 1 parameter to 11 parameters. After validation with 665 data sites on these models, finally two candidate models have been proposed. These models are capable of covering 50% of the land area on earth surface between latitude ± 30º, enabling estimation accuracy to 93% of sites, with RMSE limiting to 15%.
Copyright © 2012 International Energy and Environment Foundation - All rights reserved.
Keywords: Global; Solar; Radiation; Estimation; Site-independent; Empirical.
1. Introduction
The growing populations of the world, the fast depleting reserves of fossil fuels, and the awareness of environmental impact have led the researchers to think of alternate sources of energy for a safer life on this earth. Therefore, the whole world is looking for non-exhaustible and renewable energy sources for their future. Among the all renewable energies, solar energy is the best option if it can be used in a cost effective manner; because the technology is also environmentally sound. As the solar energy intercepted by the earth in one year is ten times greater than the total fossil resources including undiscovered and unexplored reserves, it is expected that the present world-wide research and development programs on solar energy would help to solve the future energy crisis of the world.
Solar radiation data are important for the development and the applications of solar energy technology. In general, these data are obtained from the network of monitoring stations where solar radiation is routinely measured. However, such stations are sparse around the globe, as it is a costly affair.
In developing countries, due to lack of meteorological stations equipped for observation of radiation, the numerical methods become a useful alternatives. Most of the empirical correlation models for estimating solar radiation are based on sunshine hour duration. Since for many locations sunshine duration data are also not available, therefore other meteorological parameters can be exploited to estimate solar radiation values for such locations with reasonable accuracies.
of the present work is to develop a mathematical model for the estimation global solar radiation for any location maximizing the area of application around the world with limited accuracies.
2. Literature review
National Academy of Engineering, America identified, grand challenges for the engineers are – Make solar energy economical, Manage nitrogen cycle, Advance health informatics, Prevent nuclear terror, Advance personalized learning, Provide energy from fusion, Provide access to clean water, Engineer better medicine, Engineer the tools of scientific discovery, Develop carbon sequestration methods, Restore & improve urban infrastructure, Reverse-engineer the brain and Enhance virtual reality.
Of above the present work aims to be instrumental in providing a tool for the fair estimation of the global solar radiation for a given location around the world.
Angstrom [1] proposed first theoretical model for estimating global solar radiation based on sunshine duration. Page [2] and Prescott [3] reconsidered this model in order to make it possible to calculate monthly average of the daily global solar radiation on a horizontal surface from monthly average daily total insolation on an extraterrestrial horizontal surface. Tiris et al. [4] for Turkey, Bahel et al. [5] for Bahrain, Zabara [6] for Greece, Almorox et al. [7] for Spain, Samuel [8] for Sri Lanka, Newland [9] and others have developed the modified versions of fundamental Angstroms empirical relations based on sunshine duration. Allen [10], Hargreaves [11], Bristow and Campbell [12], Chen et al. [13] and others have proposed the estimate model based on temperatures. Multi parameter model (MPM) were given by Trabea et al. [14] for Egypt, Ojosu et al. [15] for Nigeria, Garg and Garg [16] for India, Lewis [17] for Zimabwe, El-Metwally [18] for Egypt and Inci Togrul et al. [19] Elazig for Turkey and [20] for Krygyzstan, for etc., for estimating the global solar radiation based on longitude, latitude, altitude and routinely available metrological parameters such as minimum and maximum temperature, relative humidity, rainfall, cloudiness and wind speed data. Iranna et al. [21-24] have explored the estimation models for India, Asia, Africa and observed usefulness of these meteorological parameters for GSR estimation.
From the literature review it is learnt that, mostly the efforts are to develop an estimation models for a single location or for a group of locations for a small region. Therefore there exists a clear scope, for the development of a global estimation model describing the wider area of the world.
3. Data and methodology
The database considered in this study is collected from the Handbook of solar radiation data for India [25] and American society of heating, refrigerating and air-conditioning engineers ASHRAE [26] derived from CTZ2 California climate zone, CWEC Canadian weather for energy calculations, CityUHK City University of Hong Kong, CSWD Chinese standard weather data, CTYW Chinese typical year weather, ETMY Egyptial typical meteorological year, IGDG Italian climatic data collection “Gianni De Giogio”, IMS Weather data for Israel, INETI Synthetic data for Portugal, ISHRAE Indian weather data from Indian society of heating, refrigerating and air-conditioning engineers, ITMY Iranian typical metrological year, IWEC International weather for energy calculations, KISR Kuwait weather data from Kuwait Institute of Scientific Research, NIWA New Zealand weather data, RMY Australian representative meteorological years, SWEC Spanish weather for energy calculations and SWERA Solar and wind energy resource assessment.
3.1 Study and analysis of few existing site-specific models
Past record of meteorological data from number of sites have been made available from authentic sources. The available data covers regions spread all around the globe namely from the continent of Asia, Africa, Australia, America and Europe. Some of this data is used in the current study.
Principal focus of this study is the establishment of limiting capabilities of the site specific models in estimation of global solar radiation (GSR) with respect to extended territory around their parent sites. The study experiments have been so designed to gradually obtain the limiting results of estimation by the respective site specific models. Root Mean Square (RMSE) criterion is used as a measure of estimation error. Standard Deviation (SD) is used as a measure of uncertainty of the estimation.
obtain estimation errors with the same model and results are analyzed. Step 3 involves external augmentation of the regions around India and obtaining and comparison of error trends. External augmentation is further extended to the sites from other continents and results obtained are critically analyzed.
Similar experiment is carried out for second cluster around Bahrain in the gulf region for the model by Nadir et al [28]. Appropriate inferences are drawn in above two cases based on the quality criterion as given in the following sections.
3.2 Quality criterion
Considering the International Energy Agency (IEA) [29] recommendations on estimation accuracies, a quality criterion is defined. On this basis, a quality band and an observation window has been defined to assess the quality of estimates.
Quality Band (QB) is a band of RMSE values lying within 0.0 < RMSE < 0.10. The more the number of estimates within this band, better is the model performance.
Observation window (OBW) is a band of RMSE values lying within 0.0< RMSE<0.20. This window also accommodates estimates which are not lying within the quality band but are in close neighborhood of the QB. RMSEs beyond 0.20 are noted to infer on the performance of the model.
The key observations of the analysis carried out for S.S. Chandel model [27], are --
• The estimation for four of the six stations fall within recommended measurement error (given by %RMSE, <10%) limits by IEA. For two stations, estimation uncertainty is above 10%.
• Out of 57 augmented sites within India, 19% stations fall within quality band (QB), 65% fall within observation window (OBW) and 26% fall outside window.
• Out of 36 stations of Asia (excluding India), augmented externally to India, 39% stations fall within quality band (QB), 8% fall within observation window (OBW) and 53% fall outside window (OW).
• Out of 53 sites from Africa, 19% fall within the quality band, 19% fall within the observation window and the balance 62% sites fall outside window.
• From 85 sites in America and Australia, 11% of the sites fall under quality band, 49% sites fall in observation window, whereas the balance 40% sites fall out of window.
It is observed that RMSEs computed from Nadir’s model[28] for other sites are on very much higher side.
Thus above analysis for two site-specific models revel-out clearly that, a site specific model has extremely limited capability to faithfully estimate global solar radiation (GSR) for locations outside the domain on the basis of which the model is developed.
This gives rise to the necessity, as indicated by IEA [29], of a robust mathematical model capable of estimating the global solar radiation with the accuracies within the quality band for large number of locations covering most of the world.
4. Results and discussions
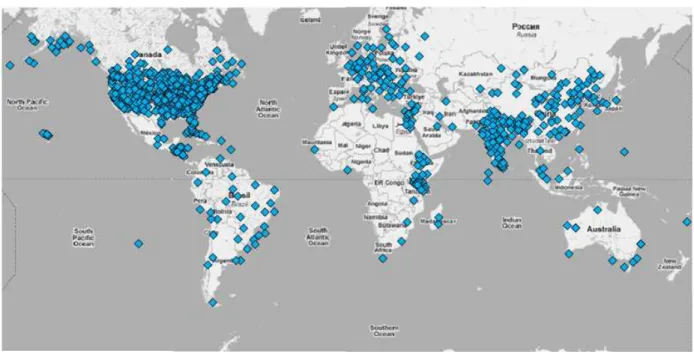
In the present work the data is collected from 875 stations spread around the world as shown in Figure 1. The data contains 15-20 years averaged hourly data of daily global solar radiation, temperature, relative humidity, rain and wind speed. In the present study, this data is converted in a suitable form. DataFit [30] simulation software is used for analysis of the data. The accuracy of DataFit has been verified with the Statistical Reference Datasets Project of the National Institute of Standards and Technology (NIST).
4.1 Procedure
A systematic procedure is followed as under
• Identification of independent variables: Independent variables suitable for the model have been chosen based on the strength of their respective correlation with global solar radiation (GSR).
• Proposing the estimation models
o One parameter (1P) models; having high and medium correlation coefficients o Two parameter (2P) models; with the combinations of parameters used in 1P model o Multi parameter (3P and above) models; adding one parameter each time to develop the
model
o Comparing the estimated values with the measured value by computing the root-mean
square errors (RMSE) for each site for each model
o Computing the standard deviations of RMSEs for each site for each model o Selecting few of the best performing models
• Choosing the one among best performing models
o Defining the modality for benchmarking the performance o Comparing the average RMSEs of selected models o Comparing the standard deviations of selected models o Selecting the best of best model among the other best models • Validation of the chosen model
o Region-wise validation of the model with data input from each regions
o Latitude-wise validation of the model with data input from selected sites within the band
of north and south latitudes.
Figure 1. Meteorological data collected from 875 different sites located around the world
4.2 Observations
1. In the present study, the local meteorological parameters such as Tmin (minimum temperature, °C),
Tmax (maximum temperature, °C), MSL (mea sea level, mtrs.), Longitude, Latitude, %RH (relative
humidity) and Hg (monthly average measured global solar radiation) are used as the main
parameters and ∆T (Tmax - Tmin), Tmax/Tmin, and Tmin/Tmax are used as derived parameters.
2. Out of 875 stations data, 210 sites fairly spread across the globe have been chosen for model development. The available data is sorted based on the regions described by the six continents – Asia, Africa, North America, South America, Australia and Europe.
3. The parameters Tmax, Tmin, RH and ∆T, with a Pearson correlation coefficient of 0.429, 0.323, 0.326
and 0.415 show the strong correlations when correlated with GSR for 210 chosen sites.
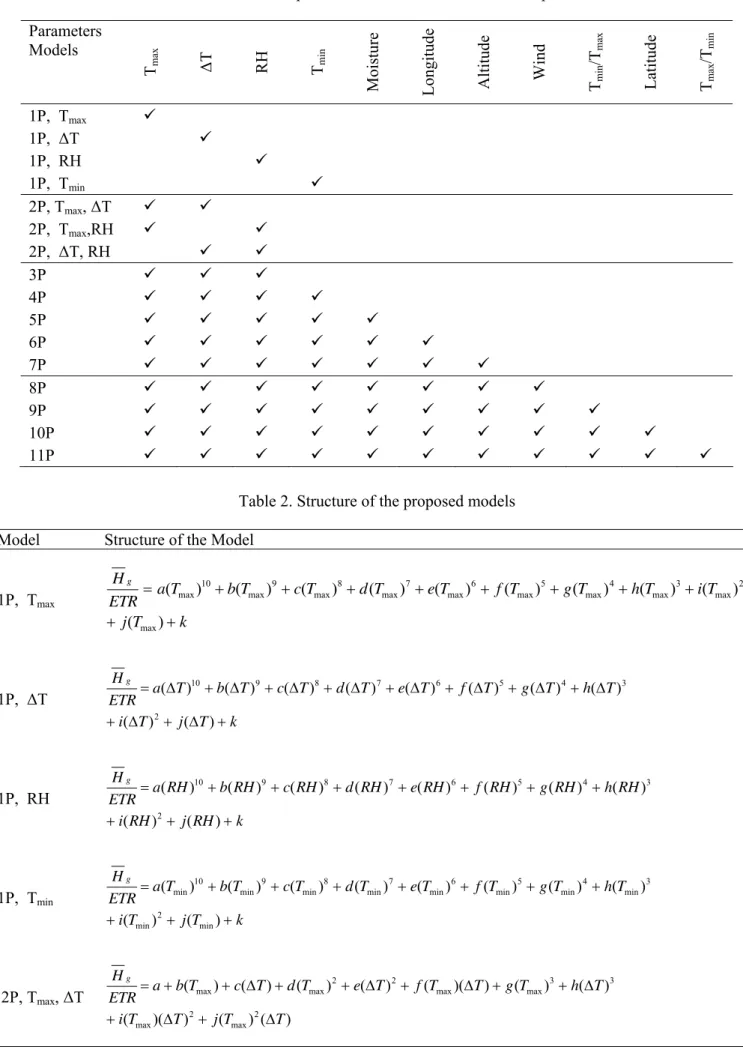
4. The matrix of parameter selection for different model development is given in Table 1. The parameters are arranged in the descending order of their strength of correlations.
5. From the possibility of defining ‘infinite’ set of regression models, a subset of the most commonly used engineering, scientific and statistical regression models have been used. In the present work 298 single independent variable (linear and non-linear) regression models and over 242 multiple independent variable (linear and non-linear) regression models have been defined in simulation software [26], to chose the best one. Accordingly the best performing models in each category have been listed in Table 2.
6. For the modeled data, based on the RMSE (root mean square error) test and SD (standard deviation) test, 10P, 11P, 2P(Tmax, RH) and 2P(Tmax, ∆T) models have been identified as the best, among
7. Threfore these four models are chosen for further for the validation of the the models. These models have been validated with the data from remaining 665 stations.
8. From the RMSE test on validation data, it is observed that
a. The average RMSEs of 10P and 11P models are low (RMSE, 0.137, 0.216, 0.257) for Asia, North America, and Europe
b. The average RMSEs for Africa was g.iven by 1P, RH model (RMSE, 0.087), for South America by 2P (Tmax, RH) with 0.097 RMSE and for Australia the 3P, 4P & 5P models
offered a RMSE of 0.032.
c. The average RMSE for 2P (Tmax, RH) model is below 0.15 for 3 regions, except for
Africa, North America and Europe
d. The average RMSE for 2P (Tmax, ∆T) model is above 0.15 for all regions except for
South America and Australia.
e. While complete world data was considered, 10P and 11P models with RMSE of 0.147, giving a better edge over other models.
9. It is observed that the four models 10P, 11P, 2P (Tmax, RH) and 2P (Tmax, ∆T) exhibited the standard
deviations very close to each other. Hence further analysis of these models was carried out.
10. Accordingly the RMSE test and SD test on the complete data, (modeled data and validation data), it revealed that 10P and 11P show the lower average RMSEs and the standard deviations. Next better models being 2P(Tmax, ∆T) and 2P(Tmax, RH).
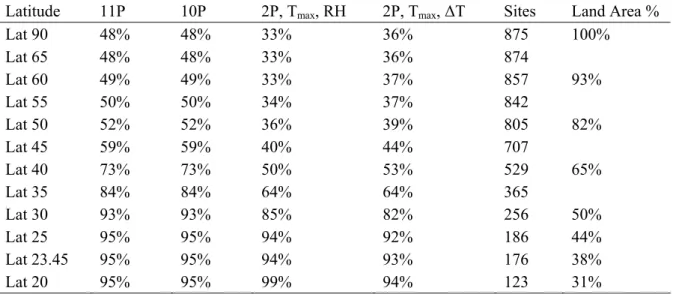
11. During further deeper analysis of these four models, the RMSE values are counted for various set of latitudes. As the data sites spread from equator to ±65° latitude covering the major part of the world; the latitude-wise count of RMSEs is done. Data from only one site was available at the location between±65° to ±90° latitude. Percentage of sites falling within a 15% error (RMSE, 0.15, limiting error) limit for the select models at different latitude reference is given in Table 3.
12. Land area coverage is approximately 50% for latitude within ±30°. Corresponding to this 10P and 11P models are capable of estimating GSR within limiting error, for 93% of sites within this area. 13. If the area within latitudes ±25° is considered, it covers 44% of the land area, and the site coverage
improves to 95%.
14. For the latitudes within ±20°, the 2P (Tmax, RH) model’s performance in terms of site coverage is
99%; whereas for 10P and 11P models it remains as 95%.
15. To have a trade-off between the area coverage and the estimation accuracies, the 50% land area under latitude ±30°, is considered. This constitutes the areas from different continents as – Asia, 38%; Africa, 95%; North America, 21%; South America, 81%, Australia, 63% and Europe, 0%, as shown in Figure 2.
Therefore, considering the above results, the models finally proposed are
10P model,
k Latitude j
T T i WindSpeed h
Altitude g
Longitude f
Moisture e
T d RH c T b T a ETR
Hg
+ +
⎟⎟ ⎠ ⎞ ⎜⎜ ⎝ ⎛ + +
+ +
+ +
+ ∆ + =
) (
) (
) (
) (
) (
) ( ) ( ) ( ) (
max min
min max
(1)
and 2P (Tmax, RH) model,
5 4
3 2
5 max 4
max 3
max 2
max max
) ( ) (
) ( ) ( ) ( ) ( ) ( ) ( ) ( ) (
RH k RH j
RH i RH h RH g T
f T
e T
d T
c T b a ETR
Hg
+ +
+ +
+ +
+ +
+ +
= (2)
Table 1. Matrix of parameter selection for model development
Parameters Models
Tmax ∆T RH Tmin
Moisture Longitu
de
Altitude Wind Tmin /Tma
x
Latitude Tmax
/T
min
1P, Tmax 9
1P, ∆T 9
1P, RH 9
1P, Tmin 9
2P, Tmax, ∆T 9 9
2P, Tmax,RH 9 9
2P, ∆T, RH 9 9
3P 9 9 9
4P 9 9 9 9
5P 9 9 9 9 9
6P 9 9 9 9 9 9
7P 9 9 9 9 9 9 9
8P 9 9 9 9 9 9 9 9
9P 9 9 9 9 9 9 9 9 9
10P 9 9 9 9 9 9 9 9 9 9
11P 9 9 9 9 9 9 9 9 9 9 9
Table 2. Structure of the proposed models
Model Structure of the Model
1P, Tmax
k T j T i T h T g T f T e T d T c T b T a ETR Hg + + + + + + + + + + = ) ( ) ( ) ( ) ( ) ( ) ( ) ( ) ( ) ( ) ( max 2 max 3 max 4 max 5 max 6 max 7 max 8 max 9 max 10 max
1P, ∆T
k T j T i T h T g T f T e T d T c T b T a ETR Hg + ∆ + ∆ + ∆ + ∆ + ∆ + ∆ + ∆ + ∆ + ∆ + ∆ = ) ( ) ( ) ( ) ( ) ( ) ( ) ( ) ( ) ( ) ( 2 3 4 5 6 7 8 9 10
1P, RH
k RH j RH i RH h RH g RH f RH e RH d RH c RH b RH a ETR Hg + + + + + + + + + + = ) ( ) ( ) ( ) ( ) ( ) ( ) ( ) ( ) ( ) ( 2 3 4 5 6 7 8 9 10
1P, Tmin
k T j T i T h T g T f T e T d T c T b T a ETR Hg + + + + + + + + + + = ) ( ) ( ) ( ) ( ) ( ) ( ) ( ) ( ) ( ) ( min 2 min 3 min 4 min 5 min 6 min 7 min 8 min 9 min 10 min
2P, Tmax, ∆T
Table 2. (Continued) Model Structure of the Model
2P, Tmax,RH
5 4 3 2 5 max 4 max 3 max 2 max max ) ( ) ( ) ( ) ( ) ( ) ( ) ( ) ( ) ( ) ( RH k RH j RH i RH h RH g T f T e T d T c T b a ETR Hg + + + + + + + + + + = 2P,
∆T, RH ln( )( ) ln( ) ( )
) ( ) ln( ) )( ln( ) ( ) ln( ) ( ) ln( 2 2 3 3 2 2 RH T j RH T i RH h T g RH T f RH e T d RH c T b a ETR Hg ∆ + ∆ + + ∆ + ∆ + + ∆ + + ∆ + =
3P aT b T c RH d
ETR Hg + + ∆ +
= ( max) ( ) ( )
4P aT b T c RH d T e
ETR Hg + + + ∆ +
= ( max) ( ) ( ) ( min)
5P aT b T c RH d T eMoisture f
ETR Hg + + + + ∆ +
= ( max) ( ) ( ) ( min) ( )
6P aT b T c RH d T e Moisture f Longitude g
ETR
Hg = + ∆ + + + + +
) ( ) ( ) ( ) ( ) ( )
( max min
7P aT b T c RH d T eMoisture f Longitude g Altitude h
ETR Hg + + + + + + ∆ +
= ( max) ( ) ( ) ( min) ( ) ( ) ( )
8P i WindSpeed h Altitude g Longitude f Moisture e T d RH c T b T a ETR Hg + + + + + + + ∆ + = ) ( ) ( ) ( ) ( ) ( ) ( ) ( )
( max min
Table 3. Percentage of sites falling within the 0.15 RMSE limit for the selected models for different latitude reference
Latitude 11P 10P 2P, Tmax, RH 2P, Tmax, ∆T Sites Land Area %
Lat 90 48% 48% 33% 36% 875 100%
Lat 65 48% 48% 33% 36% 874
Lat 60 49% 49% 33% 37% 857 93%
Lat 55 50% 50% 34% 37% 842
Lat 50 52% 52% 36% 39% 805 82%
Lat 45 59% 59% 40% 44% 707
Lat 40 73% 73% 50% 53% 529 65%
Lat 35 84% 84% 64% 64% 365
Lat 30 93% 93% 85% 82% 256 50%
Lat 25 95% 95% 94% 92% 186 44%
Lat 23.45 95% 95% 94% 93% 176 38%
Lat 20 95% 95% 99% 94% 123 31%
Figure 2. Area coverage under latitude ±30°
5. Conclusion
Through exhaustive exploration, two models qualifying to be the targeted site-independent models have been obtained. It is thought that this contribution will go a long way in facilitating availability of more reliable estimation of global solar radiation almost around the globe.
Accordingly two robust models have been chosen among many models proposed. First one is the 10P model, with 10 parameters (maximum air temperature, minimum air temperature, difference of maximum and minimum air temperature, ratio of minimum to maximum air temperature, relative humidity, wind-speed, moisture, latitude, longitude and altitude) as input. The other one is 2P model
with 2 parameters (maximum ambient temperature and relative humidity) as input.
Acknowledgements
This work is a part of the Ph.D. thesis work of Mr. Iranna Korachagaon, submitted to Shivaji University, Kolhapur.
References
[1] Angstrom A., 1924, Solar and terrestrial radiation, Quarterly Journal of the Royal Meteorological Society, Vol. 50(4), 121-126.
[2] Page J.K., 1961, The estimation of monthly mean values of daily total short wave radiation on vertical and inclined surfaces from sunshine records for latitudes 40°N – 40°S, Proceedings of UN Conference on new sources of energy, Rome, Vol. 4, pp 378-390.
[3] Prescott J. A., 1940, Evaporation from a water surface in relation to solar radiation, Transactions of Royal Society, South Australia, Vol. 64, pp 114-118.
[4] Tiris M., Tiris C. and Erdalli Y., 1997, Water heating system by solar energy, Marmara research centre, Institute of Energy systems and environmental research, NATO-TU-COATING, Gebze, Turkey.
[5] Bahel V., Baksh H., Shrinivasan R., 1987, A correlation for estimation of global solar radiation, Energy Vol. 12, pp 131-135.
[6] Zabara K., 1986, Estimation of global solar radiation in Greece, Solar Wind Technology, Vol. 7, pp 267-272.
[7] Almorox J., and Hontoria C., 2004, Global solar radiation estimation using sunshine duration in Spain Energy Conversion and Management, Vol. 45 (9-10), pp 1529-1535.
[8] Samuel TDMA, 1991, Estimation of global radiation for Sri Lanka, Solar Energy, Vol. 47, pp 333-337.
[9] Newland F. j., 1988, A study of solar radiation models for the coastal region of South China, Solar Energy, Vol. 31, pp 227-235.
[10] Allen R.G., 1997, A self calibrating method for estimating global solar radiation from air temperature, Journal of Hydraulic Engineering, ASCE, Vol. 2, pp 56-57.
[11] Hargreaves, G.H. and Z.A. Samani, 1985, Reference crop evapotranspiration from temperature. Transaction of ASAE Vol. 1(2), pp 96-99.
[12] Bristow K.L., Campbell G.S., 1984, On the relationship between incoming solar radiation and daily maximum and minimum temperature, Agricultural and Forest Meteorology, Vol. 31, pp 150-166.
[13] Chen R., Ersi K., Yang J., Lu S., Zhao W., 2004, Validation of five global radiation models with measured daily data in China, Energy Convesion and Management, Vol. 45, pp 1759-69.
[14] Trabea A. A. and Mosalam Shaltout M. A., 2000, Correlation of global solar radiation with meteorological parameters over Egypt, Renewable Energy, Vol. 21, pp 297-308.
[15] Ojosu J.O., Komolafe L.K., 1987, Models for estimating solar radiation availability in South Western Nigeria, Nigerian Journal of Solar Energy, Vol. 16, pp 69-77.
[16] Garg H.P., Garg S.T., 1982, Prediction of global solar radiation from bright sunshine hours and other meteorological parameters, Solar-India, Proceedings of the National Solar Energy Convention, Allied Publishers, New Delhi, pp 1.004-1.007.
[17] Lewis G., 1983, Estimates of irradiance over Zimbabwe, Solar Energy, Vol. 31, pp 609-612. [18] El-Metwally M., 2004, Simple new methods to estimate global solar radiation on meteorological
data in Egypt, Atmospheric Research, Vol. 69, pp 217-239.
[19] Inci Turk Togrul, Hasan Togrul and Dugyu Evin, 2000, Estimation of monthly global solar radiation from sunshine duration measurement in Elazig (Turkey), Renewable Energy, Vol. 19, pp 587-595.
[20] Inci Turk Togrul, 2009, Estimation of solar radiation from Angstroms coefficients by using geographical and meteorological data in Bishkek, Kyrgyzstan, Journal of Thermal Science and Technology, Vol. 29 (2), pp 99-108.
[21] Iranna Korachagaon and Bapat V.N., 2010, Comparison of Correlation Coefficients of Relative Humidity and Duration of Sunshine to Global Solar Radiation over India, Journal of Information, Knowledge and Research in Electrical Engineering, (ISSN: 0975 – 6736), May 2010, Vol. 1, Issue 1, pp 05-08.
Engineering, Technology and Science, IJ-ETA-ETS (ISBN: 0974-3588), Jan – July 2010, Vol. 3, Issue 1, pp 591-596.
[23] Iranna Korachagaon and Bapat V.N., 2009, Generalized Site-independent Models for Estimating Global Solar Radiation for Asia & Africa, International Journal of Emerging Technologies and Applications in Engineering, Technology and Science, IJ-ETA-ETS (ISBN: 0974-3588), Jul – Dec 2009, Vol. 2, Issue 2, pp 250-256.
[24] Iranna Korachagaon, Bapat V.N. and Irfan Anjum Magami, 2008, Few site-independent models for estimating global solar radiation for west and south Asian countries, International Journal of Mechanical and Materials Engineering, University of Malaya, 50603 Kuala Lumpur, Malaysia, Vol. 3 (2008), No. 2., pp 139-144.
[25] Mani A., 1980, Handbook of solar radiation data for India, Allied Publishers Pvt Limited, New Delhi.
[26] ASHRAE, 1981, Handbook of fundamentals, American Society of Heating Refrigerating and Air Conditioning Engineers, New York.
[27] Chandel S. S., Aggarawal . R. K. and Pandey A.N., 2007, New correlation to estimate global solar radiation on horizontal surface from using sunshine duration and temperature data, ASME Transactions, Journal of Solar Energy Engineering, Vol. 127 (3), pp 417-420.
[28] Nadir Ahmed Elagib, Sharief Fadul Bakiker, Shamsul Haque Alvi, 1998, New empirical models for global solar radiation over Bahrain, Energy conversion and management, Vol. 39 (8), pp- 877-835.
[29] IEA, 1988, International Energy Agency, Validation of models for estimating solar radiation on horizontal surfaces, Atmospheric Environment Service, Canada.
[30] http://www.oakdaleengr.com/
Iranna Korachagaon, has more than 18 years of experience in industry and academia. He has submitted his Ph.D. Thesis to Shivaji University in 2010 at Kolhapur. He has done B.E (Electrical & Electronics, 1991) from Mysore University and M.Tech. (Energy Systems Engineering, 2001) from Visweshwaraya Technological University (VTU) Belgaum. His research interests include – Renewable Energy Applications, Energy Management & Audit and Teaching-Learning Techniques. He has published 11 research papers in reputed International/ National Journals/ Conferences and authored one text book. He has life memberships with professional bodies such as MIE, MISTE, MSESI, MGMM. Presently he is working as Professor, Department of Electrical Engineering, Annasaheb Dange College of Engineering & Technology, Ashta, Sangli, India.
E-mail address: [email protected] , Cell. +91 98600 88339.
V. N. Bapat, a professional academia with social concern has received Ph.D. (Control Systems Engineering) from IIT Khargpur in 1993. He has served for more than 28 years at reputed institutions in different capacities. He has published more than 40 papers in International/ National Journals/ Conferences. He has successfully executed 3 projects funded by AICTE. He is actively involved with ISTE, IE, ISO, NBA. Out of 10 candidates registered, 2 have completed their Ph.D. under his supervision. He is recipient of, ‘Order of Merit’, ‘SAMAJSHRI’ for the year 2005 from Indian Council of Management Executives, Mumbai for outstanding work in Management. Presently he is working as Director, Ganga Institute of Technology & Management, Kablana, Jajjar Dist., Haryana.