www.soil-journal.net/2/391/2016/ doi:10.5194/soil-2-391-2016
© Author(s) 2016. CC Attribution 3.0 License.
SOIL
Quantification of the impact of hydrology on agricultural
production as a result of too dry, too wet or too saline
conditions
Mirjam J. D. Hack-ten Broeke1, Joop G. Kroes1, Ruud P. Bartholomeus2, Jos C. van Dam3, Allard J. W. de Wit1, Iwan Supit1, Dennis J. J. Walvoort1, P. Jan T. van Bakel4, and Rob Ruijtenberg5 1Alterra, Wageningen University and Research Centre, P.O. Box 47, 6700 AA Wageningen, the Netherlands
2KWR Watercycle Research Institute, P.O. Box 1072, 3430 BB Nieuwegein, the Netherlands 3Wageningen University, Soil Physics and Land Management group, P.O. Box 47,
6700 AA Wageningen, the Netherlands
4De Bakelse Stroom, Simon Vestdijkstraat 15, 6708 NW Wageningen, the Netherlands 5STOWA, postbus 2180, 3800 CD Amersfoort, the Netherlands
Correspondence to:Mirjam J. D. Hack-ten Broeke ([email protected])
Received: 30 March 2016 – Published in SOIL Discuss.: 18 April 2016 Accepted: 1 July 2016 – Published: 3 August 2016
Abstract. For calculating the effects of hydrological measures on agricultural production in the Netherlands a new comprehensive and climate proof method is being developed: WaterVision Agriculture (in Dutch: Waterwi-jzer Landbouw). End users have asked for a method that considers current and future climate, that can quantify the differences between years and also the effects of extreme weather events. Furthermore they would like a method that considers current farm management and that can distinguish three different causes of crop yield reduction: drought, saline conditions or too wet conditions causing oxygen shortage in the root zone.
1 Introduction
The United Nations formulated 17 sustainable develop-ment goals (SDG) for the period 2015–2030 (http:// sustainabledevelopment.un.org/focussdgs.html). Prominent goals are “End hunger, achieve food security and improved nutrition and promote sustainable agriculture” (SDG 2) and “Ensure availability and sustainable management for water and sanitation for all” (SDG 6). A key factor to achieve these goals is efficient use of water in agriculture. Currently agri-culture uses 92 % of the global fresh water use, exceeding by far the use by industry or households (Keesstra et al., 2016; Hoekstra and Mekonnen, 2012). We may release large amounts of water for extra food production or other pressing human or natural needs by increasing the water productivity in agriculture. However, this requires a profound knowledge of the effects of dry, wet, and saline conditions on growth and yield of agricultural crops.
The changing climate and weather conditions aggravate the need for reliable tools to assess crop yields in view of water stresses. Furthermore, increased water extraction from aquifers, deteriorating water quality and rationed water sup-ply and irrigation services are some reasons for increased agricultural drought stress in arid and semi-arid regions. Over the past 60 years, soil water conditions have been generally wetting over the western hemisphere and drying over the eastern hemisphere, mostly in Africa, East Asia and Europe. Trends over the past 20 years indicate intensification of dry-ing in northern China and southeast Australia, and switches from wetting to drying across much of North America, and southern South America, in part because of several large-scale and lengthy drought events (FAO, 2015). Hotspots of pressures on soil water quantity and quality are, e.g. the North China Plain, Australia, the southwestern United States and Middle East and North Africa (MENA) region. The World Bank took the initiative to generate an improved un-derstanding of water issues in the MENA region, including associated marginal cost of water supply to meet the grow-ing water need. Unmet demand for the entire MENA region, expressed as percentage of total demand, will increase from 16 % currently to 37 % in 2020–2030 and 51 % in 2040– 2050. A large number of measures were evaluated to meet the demand. The measure with the highest benefit/cost ratio is increase of agricultural water productivity, which requires proper attention for both drought and waterlogging risks dur-ing crop production (FutureWater, 2011).
Although salt-affected soils are widespread and an in-creasingly severe problem, no accurate recent statistics are available on their global extent (FAO, 2015). The best available estimates suggest that about 412 million ha are af-fected by salinity and 618 million ha by sodicity (UNEP, 1992), but this figure does not distinguish areas where salinity and sodicity occur together. The Soil Map of the World (FAO-UNESCO, 1980) depicted a similar extent of 953 million ha affected by salinity (352 million ha) and
sod-icity (580 million ha). According to Jones et al. (2012) ex-cess levels of salts in soils are believed to affect around 3.8 million ha in Europe. Naturally saline soils can be found in Spain, Hungary, Greece and Bulgaria. As an effect of ir-rigation artificially induced saline soils occur in Italy, Spain, Hungary, Greece, Portugal, France, Slovakia and Romania.
In the Netherlands salinization is not caused by accumu-lation of salts, but occurs in dry summers when crops are irrigated with salt-rich water from the ditches in the western part of the country near the sea. Excess rainfall in the win-ter period will always wash away these excess salts from the root zone in these areas. Yet, these conditions negatively af-fect crop production.
Models on soil hydrology and crop growth evolve and both integrate and simulate not only the natural interactions but also the effect of farm management decisions. As a conse-quence the currently used instruments for quantifying the effect of hydrological conditions in the root zone on agri-cultural production for instance in the Netherlands are no longer sufficient. Different groups of users, like water boards, provinces, drinking water companies and the National De-partment of Waterways and Public Works are therefore de-manding an instrument that can determine crop yield effects as a result of drought, too wet or too saline conditions for both current and future climatic conditions. In order to be applicable to future climate conditions the system has to be based on process-based models; implicit incorporated expert knowledge cannot be extrapolated to unknown conditions. Other important specifications are that the results must be re-producible, that farm management is included, and that new insights can be added in the future.
WaterVision Agriculture should become that new instru-ment, based on linked model simulations for soil hydrol-ogy (SWAP) and crop growth (WOFOST) on the basis of different weather conditions and future climate. Plant growth is determined by the availability of solar radiation, CO2,
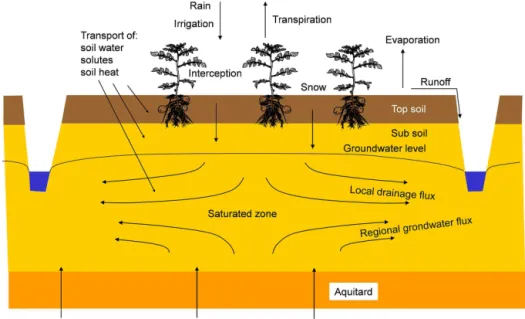
Figure 1.Transport processes and modelling domain of SWAP.
of these models enables us to assess the effects of future cli-mate on the interaction between hydrology and crop growth. Based on these complex process-based models we want to arrive at an easily applicable method with direct relation-ships between groundwater characteristics and crop growth. For this we have derived a meta-model, which mimics the relevant processes involved and generates roughly the same model results as the SWAP-WOFOST model would do, us-ing much less input data. This facilitates the practical appli-cation of scientific knowledge. In this paper we describe how this meta-model for WaterVision Agriculture was derived for grassland and silage maize and how it can be used. The ul-timate project goal is to develop a comprehensive and well recognized method for quantifying agricultural effects of hy-drological change.
2 Materials and methods
First we describe the simulation models used for WaterVision Agriculture, followed by data used for model testing. Then we describe the production of the meta-model and the data required for this action.
2.1 SWAP
The SWAP (Soil-Water-Atmosphere-Plant; van Dam et al., 2008) model is the core of WaterVision Agriculture and is a widely used model for the determination of the actual evapo-transpiration as a function of meteorological data, combined with crop and soil data (Feddes and Raats, 2004). The model simulates water flow in the unsaturated and saturated upper part of the soil profile, where the interaction between ground-water and surface ground-water is important. The model SWAP
cal-culates the water transport, dissolved substances and soil temperature (Fig. 1).
Water transport simulation is based on the Richards equa-tion with a variable sink term for root water extracequa-tion. The potential transpiration rate depends on atmospheric condi-tions (air temperature, wind speed, solar radiation and air hu-midity) and plant characteristics (reflection coefficient, stom-atal resistance, plant height and leaf area index). The po-tential root water extraction rate at a certain depth, Sp(z)
(day−1), is considered to be proportional to the root length
density and the potential transpiration rate:
Sp(z)=
Lroot(z) 0
R
−Droot
Lroot(z)dz Tp,
withLrootthe root length density (cm−2) andDrootthe root
layer thickness (cm).
Stresses due to dry or wet conditions and/or high salin-ity concentrations may reduceSp(z). The drought stress in
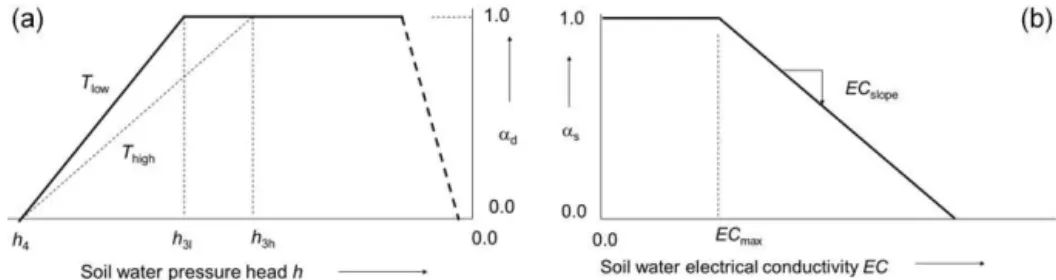
SWAP is described by the dry part of the reduction func-tion proposed by Feddes et al. (1978), which is depicted in Fig. 2a. In the moderate pressure head rangeh > h3root
wa-ter uptake is optimal. Belowh3 root water uptake linearly
declines due to drought until zero ath4(wilting point). The
critical pressure headh3increases for higher potential
tran-spiration rates ofTp.
Figure 2.(a)Transpiration reduction factorαsas function of soil water pressure head and(b)transpiration reduction factorαsas function of soil water electrical conductivity.
(Fig. 3). Oxygen stress occurs when the actual root respi-ration is lower than the potential root respirespi-ration, i.e. when the oxygen supply cannot meet the oxygen demand of plant roots. Root respiration is determined by interacting respira-tory (i.e. oxygen consuming) and diffusive (i.e. oxygen pro-viding) processes in and to the soil. Plant roots respire at a potential rate under optimal soil aeration and thus non-limiting oxygen availability. This potential root respiration is in equilibrium with the oxygen demand of plant roots, which is determined by plant characteristics and soil temperature (Amthor, 2000) only. Upon increasingly wetter conditions, however, the gas-filled porosity of the soil decreases and oxy-gen availability becomes insufficient for potential root respi-ration. The method of Bartholomeus et al. (2008) is applied to all soil layers of SWAP, to account for layer-specific soil physical properties, moisture contents and temperatures.
SWAP uses the response function of Maas and Hoff-man (1977) for salinity stress (Fig. 2b). Below the critical concentration of ECmax (dS m−1) no salinity stress is
as-sumed. At salinity levels above ECmaxthe root water uptake
declines with a constant slope of ECslope(m dS−1). The
ac-tual root water flux, Sa(z) (day−1) is derived in SWAP by
multiplication of the stress factors due to drought, oxygen and salt stress:
Sa(z)=αd(z)αo(z)αs(z)Sp(z),
whereαd(–),αo (–) andαs (–) are reduction factors due to
drought, oxygen and salinity stress, respectively.
Integration of the actual root water flux over the root zone yields the actual transpiration rateTa(cm day−1):
Ta= 0
Z
−Droot
Sa(z)∂z.
Oster et al. (2012) compared five agrohydrological models (ENVIRO-GRO, HYDRUS, SALTMED, SWAP and UN-SATCHEM) that simulate the effect of continually changing salinity and matric stress on crop yields. These models all as-sume a linear relation between relative crop transpiration and relative dry matter production. As input they used soil and climatic conditions of the San Joaquin Valley of California to
Figure 3.Schematisation of the oxygen module used to simulate daily respiration reduction. The model combines interacting physi-ological processes (i.e. root respiration and microbial respiration) and physical processes (i.e. macro-scale and micro-scale oxygen diffusion). Details of equations involved are given in Bartholomeus et al. (2008).
simulate the yields of forage corn for various amounts of ir-rigation and water quality. The results show that SALTMED simulates lower relative yields than the other models for all combinations of irrigation amounts and water quality. For the other models, including SWAP, relative yield values were similar (within about 7 % or less) for all irrigation amounts with electrical conductivity below 3 dS m−1.
The SWAP user manual and corresponding website de-scribe the theoretical background in detail as well as model input and applications (Kroes et al., 2009). SWAP is de-veloped and maintained by Wageningen University and Re-search centre.
2.2 WOFOST
water balance. The most important external drivers are daily weather data. Other external drivers are initial soil and crop conditions. The most important internal driver is the leaf area index (LAI) which is the result of the leaf area dynamics con-trolled by photosynthesis, allocation of biomass to leaves, leaf age and development stage. In turn, LAI controls the daily rates of photosynthesis and evapotranspiration.
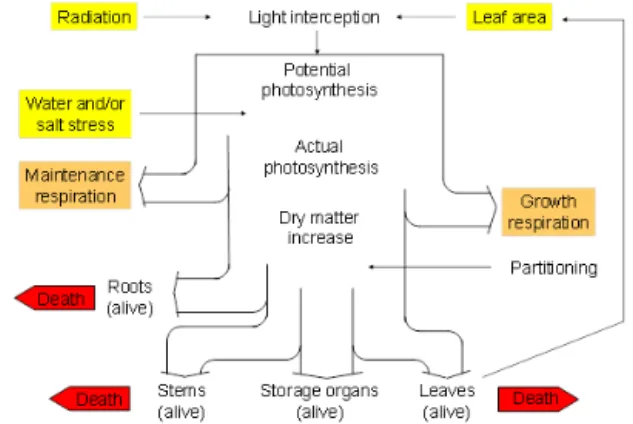
Currently, WOFOST as described by Boogaard et al. (1998) and Kroes et al. (2009) is able to simulate poten-tial production as governed by atmospheric conditions and plant characteristics, and limited production due to water, oxygen and/or salinity stress. Figure 4 shows the processes and relations incorporated in WOFOST. The radiation energy absorbed by the canopy is a function of incoming radiation and crop leaf area. Using the absorbed radiation and taking into account photosynthetic leaf characteristics, the potential photosynthesis is calculated. The latter is reduced due to wa-ter, oxygen and/or salinity stress, as quantified by the relative transpiration (Ta/Tp), and yields the actual photosynthesis.
Part of the carbohydrates (CH2O) produced are used to
provide energy for the maintenance of the living biomass (maintenance respiration). The remaining carbohydrates are converted into structural matter. In this conversion, some of the weight is lost as growth respiration. The dry matter pro-duced is partitioned among roots, leaves, stems and storage organs, using partitioning factors that are a function of the crop development stage. The amount partitioned to the leaves determines leaf area development and hence the capacity of light interception. This interaction of light interception and leaf area growth is a very important positive feedback in WOFOST. The dry weights of the various plant organs are obtained by integrating their growth rates over time. During the development of the crop, part of the living biomass dies due to senescence.
Changes in CO2directly affect photosynthesis. Rising
lev-els of CO2will result in higher CO2uptake but also in closing
of the stomata which then reduces CO2uptake. The net effect
however is increase in crop growth. Kroes and Supit (2011) simulated grassland growth with SWAP-WOFOST for sev-eral climate scenarios and found that the increase of CO2
concentration is more important than the predicted increase in temperature for both potential and actual yield.
In relation to climate change heat stress may become just as important as drought stress for limiting crop production. It is well known that short episodes of high temperatures during the flowering period can drastically reduce the productivity of many field crops. However, the version of the WOFOST crop simulation model currently integrated in SWAP does not consider the direct impact of heat stress on grassland or maize productivity. For the moderate ocean climate of the Netherlands it is not expected that the direct impact of heat stress will lead to considerable yield losses in the coming decades (Teixeira et al., 2013). Furthermore, the amount of experimental data to parametrize such relationships is lim-ited which has hampered adding such algorithms with
suffi-Figure 4. Flow chart of crop growth processes included in WOFOST.
cient confidence in WOFOST. It is only recently within the framework of the AgMIP project that the systematic testing of models against dedicated heat stress experiments is taking place (Liu et al., 2016).
2.3 Linked models and model testing
We have linked these two simulation models SWAP and WOFOST on a daily basis to ensure realistic interaction be-tween water in the root zone and crop growth. This interac-tion allows for dynamic root growth as a funcinterac-tion of weather and soil conditions, dynamic crop growth as a function of weather, crop characteristics and water availability and also more realistic calculation of transpiration as a function of dy-namic crop cover and leaf area simulations. Because both models are process based, the linkage of these models en-ables us to assess the effects of future climate on the inter-action between hydrology and crop growth (Bartholomeus et al., 2012; Guisan and Zimmermann, 2000). In the current SWAP-WOFOST version two production situations are sim-ulated: the potential and water-limited situation. The poten-tial crop production situation is defined by temperature, day length, solar radiation and crop characteristics. Optimum nu-trient and moisture levels are assumed. The water-limited sit-uation is defined by the above-mentioned factors in combina-tion with water or oxygen shortages.
avail-able for 1980–1984 (two different fields) and the Zegveld data for 2003–2005. Then the Cranendonck data for silage maize were measured in the years 1974–1982 and the Dijk-graaf data were more recent (2007–2008).
The grassland composition of the experimental sites that were used for calibrating SWAP-WOFOST mainly consists of varieties of English ryegrass (Lolium perenne) which is the dominant type of grassland in the Netherlands and Western Europe. See also Schapendonk et al. (1998) for a descrip-tion of similar sites that were used for the related LINGRA model.
The crop files for silage maize are based on the standard WOFOST crop files for maize that are calibrated for Nether-lands and Germany. These crop files are based on field trials executed in Belgium, United Kingdom and the Netherlands and on research executed in the framework of the MARS project (https://ec.europa.eu/jrc/en/mars). Typical heat sums for silage maize are 750◦ days for emergence to flowering
and 850◦
days for the period from flowering to ripeness with a baseline temperature of 8◦
C.
2.4 Meta-model
The definition of a meta-model in WaterVision Agriculture is that a meta-model is a model derived from another model. In the case of the linked SWAP-WOFOST model this means that the meta-model of SWAP-WOFOST must be able to simulate crop growth as if it was directly calculated using SWAP-WOFOST. A meta-model thus models the model re-sults from another model (the original model).
A meta-model is usually a lot less complex than the origi-nal model. This can be explained because a meta-model only describes a small part of the original model. In the case of WaterVision Agriculture we are looking for a meta-model that can reproduce the annual average crop yield reduction as a function of drought, too wet or too saline conditions. All other model results simulated by SWAP-WOFOST, like wa-ter content in the root zone or daily biomass production will not be addressed by the meta-model.
The advantage of having a meta-model is that it requires much less input data than the original model. For SWAP-WOFOST simulations for instance we need a soil profile de-scription with hydraulic characteristics and a large number of crop characteristics. For using the meta-model we only need to know soil type and crop type. This will make the meta-model a lot easier to use and it speeds up the cal-culations. So, based on the complex process-based model SWAP-WOFOST easily applicable statistical relationships have been derived between groundwater characteristics and crop yield. These relationships, the meta-model, mimic the relevant processes involved and generate roughly the same model results as the SWAP-WOFOST model would do.
The meta-models we use for WaterVision Agriculture are so called random forests (Breiman, 2001). Random forests consist of many (usually several hundreds of) classifications
or regression trees (CART-models). In our case, we have grown forests with regression trees. Each regression tree pre-dicts crop growth given a set of explanatory variables like crop type, soil type, meteorological district, climate scenario, and several groundwater characteristics (e.g. mean ground-water level, mean highest groundground-water level, mean lowest groundwater level, average spring groundwater level). Start-ing at the trunk of a regression tree, the data are recursively split into smaller parts based on simple rules like “IF soil type is sand THEN follow the left branch up the tree ELSE follow the right branch up the tree”. Each branch of the tree is split in turn until a terminal leaf is reached. This leaf contains a prediction (in our case crop growth). Instead of a single tree, random forests employ an entire ensemble of regression trees (forest of trees) to improve prediction accuracy by averaging the predictions of all individual regression trees.
2.5 Input data for deriving the meta-model
For deriving the meta-model, the SWAP-WOFOST combi-nation was run approximately 360 000 times. This number is a result of simulation runs for two crops (grassland and silage maize), 72 soil units of the Dutch soil physical database, five weather stations, current weather and four climate scenarios. As lower boundary condition for the SWAP model we used theqb(h)-relation (Kroes et al., 2009). This relation assumes
that the vertical flux (qb) is related to groundwater level (h)
according to:
qb=Aexp(Bh)+C,
whereA, B andC are coefficients. For deriving the meta-model we assume thatAcan vary between−10 to 0,B be-tween−0.10 to−0.01 and finallyCis related to the bound-ary of drainage (zd):
C= −Aexp(Babs(zd)),
wherezdcan vary between 250 to 25 cm below soil surface. Meteorological data were available from the Dutch me-teorological institute KNMI. This involves daily global ra-diation, minimum and maximum temperature, air humidity, wind speed, rainfall amounts and duration for five weather stations in the Netherlands for 30-year periods. KNMI pro-vides current weather data for the period 1981–2010 as well as projected data for 30-year periods around 2050 for dif-ferent climate scenarios (KNMI, 2014). Crop yield reduction has been simulated for two crops: grassland and silage maize. Soil profile information was obtained from the BOFEK 2012 database (Wösten et al., 2013). It contains soil physi-cal data for 72 representative soil profiles covering the whole of the Netherlands. For each combination of crop (2×),
soil profile (72×), weather station (5×), and climate
sce-nario (5×), 100 sets of boundary conditions have been drawn
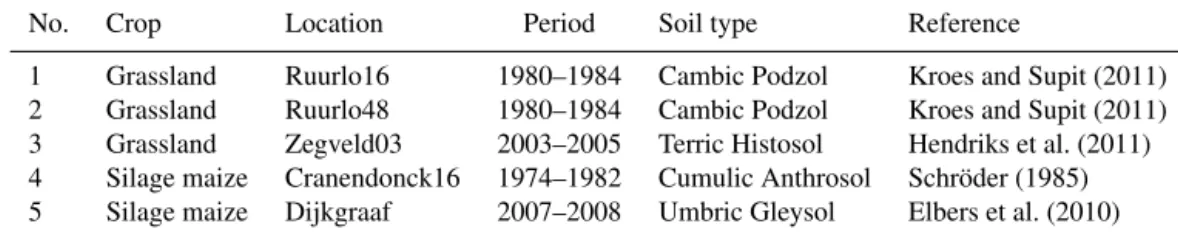
Table 1.Test sets for SWAP-WOFOST.
No. Crop Location Period Soil type Reference
1 Grassland Ruurlo16 1980–1984 Cambic Podzol Kroes and Supit (2011) 2 Grassland Ruurlo48 1980–1984 Cambic Podzol Kroes and Supit (2011) 3 Grassland Zegveld03 2003–2005 Terric Histosol Hendriks et al. (2011) 4 Silage maize Cranendonck16 1974–1982 Cumulic Anthrosol Schröder (1985) 5 Silage maize Dijkgraaf 2007–2008 Umbric Gleysol Elbers et al. (2010)
Soil physical data BOFEK
Soil water transport in the unsaturated zone is largely af-fected by the soil hydraulic characteristics (water retention curve pF and hydraulic conductivity k(h)). Such data are available for the whole of the Netherlands from the national soil physical database BOFEK (Wösten et al., 2013). This database has 72 soil profiles with a vertical soil layer schema-tisation that is characterised by 36 different soil physical re-lations for top soil and subsoil layers.
Tests were carried out using these soil characteristics with the SWAP model for these 72 soil physical units and dif-ferent types of land use using difdif-ferent input options (tab-ular input of pF- and k(h)-functions or using Mualem– Van Genuchten-parameters; Mualem, 1986; van Genuchten, 1980). This resulted in small adjustments in the numerical solutions of the SWAP model to increase calculation speed and in small changes in the database to eliminate minor er-rors. An improved version of the database was made avail-able on the website (http://www.wageningenur.nl/nl/show/ Bodemfysische-Eenhedenkaart-BOFEK2012.htm).
3 Results
3.1 Test results linked SWAP-WOFOST
The linked SWAP-WOFOST model was evaluated using five experimental data sets with observations for grassland and silage maize (Table 1). These sets were selected because the experiments had a focus on stress due to drought or wet con-ditions; other stresses, like nutrient shortage or pests and dis-eases hardly occurred at these experiments which allowed an evaluation of the SWAP-WOFOST model for water stress sit-uations. The experimental data of these five sets come from quite a range of studies, performed in different years and dif-ferent parts of the country. For all these sets simulation stud-ies have been performed before with the SWAP model and we assume calibration has taken place. The SWAP-related in-put data and parameters that were used before have also been used now. For crop growth the standard parameter sets for WOFOST were used. A detailed analysis of the hydrological conditions is given by Kroes et al. (2015); in this paragraph a summary of the crop yield results is presented because we regard crop production as the most relevant indicator for the performance of the linked SWAP-WOFOST model.
For the grassland sites the yields of the different grassland cuts were compared with the observed values (Fig. 5). The mean error between annual observed and simulated yield for the three grassland sites is 2.8, 2.7 and 0.2 t ha−1dry
mat-ter. We think that the agreement between observations and simulations is rather satisfactory. Annual simulated grass-land yields were generally higher than the observed annual yields. That is especially true for the year 1982 at the two Ruurlo experiments, where actual and observed results of the years 1980, 1981 and 1984 compare well and the re-sults of the year 1982 show the largest difference between simulated and observed. A more detailed analysis explained this overestimation as an effect of simplifications in model approaches and also the impact of the cold spring seems to be simulated not accurately enough. At the Ruurlo site only drought stress occurs; there is hardly ever excess of water at this sandy soil. At the organic soils of Zegveld both too dry and too wet conditions can occur. Especially 2003 was a dry year.
The two sites with experimental data for silage maize were used for evaluating SWAP-WOFOST by comparing the sim-ulated and observed total above ground biomass at harvest (Fig. 6). The mean error between annual observed and simu-lated yield shows an underestimation of 2.8 and 3.6 t ha−1
dry matter, respectively. We regarded the simulated yields in the different years at the Cranendonck site and the single experiment at Dijkgraaf as satisfactory given the uncertain-ties and simplifications of the model approaches. At Cranen-donck drought stress is the main factor influencing produc-tivity. At Dijkgraaf both too dry and too wet conditions may occur, but for this site we only have data for 1 year. Both stresses occurred in that year with a dry spring and relatively wet summer months. The drought stress in the extremely dry year of 1976 at Cranendonck was approached relatively well, which we regard as an indicator of the ability of the combi-nation of SWAP and WOFOST to enable the simulation of extreme events.
3.2 Examples for application of SWAP-WOFOST
condi-Figure 5.Results of simulated and observed yields of grassland: Ruurlo16 (upper panel), Ruurlo48 (middle panel), and Zegveld03 (lower panel). The green lines correspond with simulated potential yield; blue with the simulated exploitable yield; black with the simulated actual yield; and the red dots indicate the observed yield of a grassland cut. SIMmean, OBSmean and ME are annual mean values for simulated actual yield, observed yield and the difference (maximum error ME).
Figure 6.Results of simulated and observed yields of silage maize: Cranendonck 16 (upper panel) and Dijkgraaf (lower panel). The green lines correspond with the simulated potential yield; blue with the simulated exploitable yield; black with the simulated actual yield; red dots indicate the observed dry matter yield. SIMmean, OBSmean and ME are annual mean values for simulated actual yield, observed yield and the difference (maximum error ME).
tions for both current (Fig. 7a) and future climatic conditions (Fig. 7c). Based on these simulations climate average (30-year) values can be derived, which are relevant for quantify-ing the direction of changes as related to long-term changes in climate conditions or in water management. Figure 7a il-lustrates that the climate-average drought stress can be rel-atively minor, but that peaks in stress can occur in specific years, like the year 2003. SWAP-WOFOST allows to anal-yse such years in more detail, with a focus on extreme events (Fig. 7b). Due to climate change drought stress may increase significantly (Fig. 7c and d), while oxygen stress shows only a minor increase. Figure 7d also shows that even in a very dry year, an abundant rainfall event may occur in another period
of the year which also results in reduced crop growth. The different levels of application serve different needs, from pol-icy making (long-term averages) to operational water man-agement (daily values).
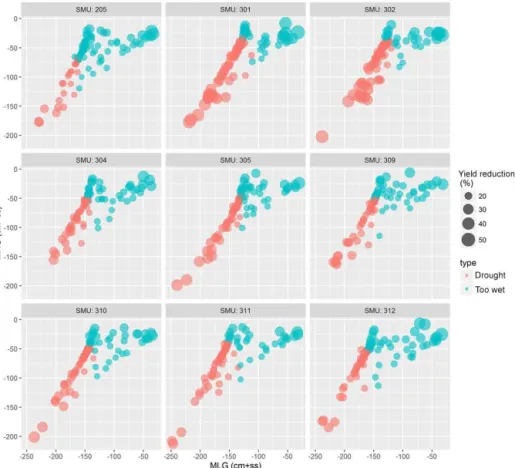
3.3 Examples of the meta-model WaterVision agriculture
Figure 7.SWAP-WOFOST simulations of transpiration reduction due to drought stress (Treddry) and oxygen stress (Tredwet) for a silage maize crop on a fictitious sandy soil. The panels show both the different causes of stress and the different time scales the model can be used for. (a)Yearly cumulative transpiration reduction due to drought stress and the climate-average (30-year) drought stress (horizontal line).(b)Potential and actual transpiration for 2003. The red polygon, representing the difference between potential and actual transpiration, demonstrates the period and level of drought stress.(c, d, a, b)But for oxygen stress instead of drought stress.
yield reduction due to drought and blue dots are the result of situations with too wet conditions for crop growth. The size of the dots indicate the average annual amount of crop yield reduction.
An important goal of the WaterVision Agriculture project is enabling the application of the meta-model to any area in the Netherlands. As an example we applied the meta-model to an area in the south of the Netherlands with mainly sandy soils. The location of this area is shown in Fig. 9. This exam-ple area is an area where drinking water is pumped up and the influenced area is considered to be almost circular. Figure 10 shows the effect on crop yield resulting from the lowering of the groundwater levels as annual average percentage (as the sum of dry and wet conditions). The differences on the map are mainly caused by differences in soil type. The changes in crop growth are largest near the drinking water well.
4 Discussion
The project WaterVision Agriculture aims at a climate-proof instrument that can determine crop yield effects as a result of drought, too wet or too saline conditions, based on process-based models. Furthermore, the instrument has to be appli-cable to various crop and water management situations as required by the end users. It can be used at field level and
for evaluating crop yield as a function of current weather and also extreme weather events as described in Sect. 3.2 and the meta-model allows a quick application on regional level showing long-term effects of hydrological measures in Sect. 3.3. With these different components of WaterVision Agriculture we have made a toolbox for different applica-tions as requested by the different end users.
Figure 8. Meta-model WaterVision Agriculture: examples for nine different soil types of the BOFEK database (SMU=Soil Mapping Unit) for grassland and the current climate in De Bilt, with the mean highest groundwater level (MHG) on theyaxis and the mean lowest groundwater level (MLG) on thexaxis. Red dots represent crop yield reduction due to drought and blue dots represent crop yield reduction as a result of too wet conditions (oxygen stress).
Figure 9.Location and topography of the Vierlingsbeek area in the Netherlands. The black triangle is the location of the drinking water well.
Author contributions. Mirjam Hack-ten Broeke is an expert on agrohydrology and soil science at Alterra and has specialised in project management. She is the project manager of the WaterVi-sion Agriculture project. Joop Kroes is an expert on soil hydrology and on the SWAP model at Alterra. He is responsible for the model combination of SWAP and WOFOST. Ruud Bartholomeus is an ex-pert in agrohydrology and climate change at KWR and is respon-sible for the valuable addition of the process-based simulation of oxygen stress. Jos van Dam is an expert on agrohydrology and soil physics at Wageningen University and shares the responsibility for the SWAP model. Allard de Wit and Iwan Supit are experts on the WOFOST model at Alterra and Iwan Supit especially in relation to grassland. Dennis Walvoort is an expert on physical geography and spatial statistics at Alterra and has contributed the meta-model to the project. Jan van Bakel is an expert on agrohydrology at De Bakelse Stroom. He helped starting up the project and has contributed to the WaterVision Agriculture tools and the modelling exercises through his long experience in agronomy and hydrology. Rob Ruijtenberg is the project manager at STOWA and is the coordinator of the end user contributions.
Acknowledgements. This project is financed by a large group of financers: STOWA (Applied Research of the Water Boards), Ministry of Infrastructure and Environment, ACSG (Advisory Commission for Damage related to Groundwater), provinces Utrecht and Zuid-Holland, ZON (Zoetwatervoorziening Oost-Nederland), Water companies Vitens and Brabant Water, VEWIN, LTO and the Ministry of Economic Affairs (project KB-14-001-046).
Edited by: J. Bouma
Reviewed by: two anonymous referees
References
Amthor, J. F.: The McCree–de Wit–Penning de Vries–Thornley res-piration paradigms: 30 Years Later, Ann. Bot., 86, 1–20, 2000. Bartholomeus, R. P., Witte, J. P. M., van Bodegom, P. M., van Dam,
J. C., and Aerts, R.: Critical soil conditions for oxygen stress to plant roots: substituting the Feddes-function by a process-based model, J. Hydrol., 360, 147–165, 2008.
Bartholomeus, R. P., Witte, J. P. M.., van Bodegom, P. M., van Dam, J. C., de Becker, P. and Aerts, R.: Process-based proxy of oxygen stress surpasses indirect ones in predicting vegetation character-istics, Ecohydrology, 5, 746–758, 2012.
Boogaard, H. L., van Diepen C. A., Rötter R. P., Cabrera, J. M. C. A. and van Laar, H. H.: WOFOST 7.1; user’s guide for the WOFOST 7.1 crop growth simulation model and WOFOST Con-trol Center 1.5. SC-DLO. Techn. Doc. 52, SC-DLO (Staring Cen-tre), Wageningen, 1998.
Breiman, L.: Random Forests, Mach. Learn., 45, 5–32, 2001. Elbers, J. A., Moors, E. J., and Jacobs, C. M. J.: Gemeten actuele
verdamping voor twaalf locaties in Nederland, STOWA rapport no. 2010-36, STOWA, Amersfoort, 2010.
FAO: Status of the World’s Soil Resources, Main report, available at: http://www.fao.org/documents/card/en/c/
c6814873-efc3-41db-b7d3-2081a10ede50/ (last access: 27 July 2016), 2015.
FAO-UNESCO: Soil Map of the World. Paris, UNESCO, Paris, France, 1980.
Feddes, R. A. and Raats, P. A. C.: Parameterizing the soil-water-plant-root system, in: Unsaturated zone modelling: progress, challenges and applications, edited by: Feddes, R. A., de Rooij, G. H. and van Dam, J. C., Kluwer Academic, Dordrecht, 95–141, 2004.
Feddes, R. A., Kowalik, P. J., and Zaradny, H.: Simulation of field water use and crop yield, PUDOC Simulation Monographs, Wa-geningen, 1978.
FutureWater, 2011. Middle-East and Northern Africa Wa-ter Outlook, Commissioned by World Bank, available at: http://www.futurewater.nl/wp-content/uploads/2011/04/Final_ Report_v11.pdf (last access: 27 July 2016), 2011.
Guisan, A. and Zimmermann, N. E.: Predictive habitat distribution models in ecology, Ecol. Model., 135, 147–186, 2000.
Hendriks, R. F. A., Jacobs, C. M. J., Duyzer, J., Moors, E. J., Kroon, P. S., Veenendaal, E. M., and Kabat, P.: Simulation of Daily Ni-trous Oxide Emissions from Managed Peat Soils. Vadose Zone J., 10, 156–168, 2011.
Hoekstra, A. Y. and Mekonnen, M. M.: The water footprint of hu-manity, P. Natl. Acad. Sci. USA, 109, 3232–3237, 2012. Iman, R. L. and Conover, W. J.: A distribution-free approach to
in-ducing rank correlation among input variables, Commun. Stat.-Simul. Comput., 11, 311–334, 1982.
Jones, A., Panagos, P., Barcelo, S., Bouraoui, F., Bosco, C., De-witte, O., Gardi, C., Erhard, M., Hervás, J., Hiederer, R., Jeffery, S., Lükewille, A., Marmo, L., Montanarella, L., Olazábal, C., Petersen, J.-E., Penizek, V., Strassburger, T., Tóth, G., van den Eeckhaut, M., van Liedekerke, M., Verheijen, F., Viestova, E., and Yigini, Y.: The state of soil in Europe, JRC Report 25186, The State of Soil in Europe, JRC, Ispra, Italy, 2012.
Keesstra, S. D., Bouma, J., Wallinga, J., Tittonell, P., Smith, P., Cerdà, A., Montanarella, L., Quinton, J. N., Pachepsky, Y., van der Putten, W. H., Bardgett, R. D., Moolenaar, S., Mol, G., Jansen, B., and Fresco, L. O.: The significance of soils and soil science towards realization of the United Nations Sustainable Development Goals, SOIL, 2, 111–128, doi:10.5194/soil-2-111-2016, 2016.
KNMI: KNMI’14: Climate Change scenarios for the 21st Cen-tury – A Netherlands perspective, Scientific Report WR2014-01, KNMI, De Bilt, the Netherlands, http://www.climatescenarios.nl (last access: 27 July 2016), 2014.
Kroes, J., Bartholomeus, R., van Dam, J., Hack-ten Broeke, M., Supit, I., Hendriks, R., de Wit, A., van der Bolt, F., Walvoort, D., Hoving, I., and van Bakel, J.: Waterwijzer Landbouw, fase 2. Modellering van het bodem-water-plantsysteem met het gekoppelde instrumentarium SWAP-WOFOST, Rapport 2015-16, STOWA, Amersfoort, 2015.
Kroes, J. G. and Supit, I.: Impact analysis of drought, water ex-cess and salinity on grass production in The Netherlands using historical and future climate data, Agr. Ecosyst. Environ., 144, 370–381, 2011.
Netherlands, available at: http://www.swap.alterra.nl (last ac-cess: 27 July 2016), 2009.
Liu, B., Asseng, S., Liu, L., Tang, L., Cao, W., and Zhu, Y.: Test-ing the responses of four wheat crop models to heat stress at anthesis and grain filling, Global Change Biol., 22, 1890–1903, doi:10.1111/gcb.13212, 2016.
Maas, E. V. and Hoffman, G. J.: Crop salt tolerance – current as-sessment, J. Irrig. Drain. Div.-ASCE, 103, 115–134, 1977. Mualem, Y.: Hydraulic conductivity of unsaturated soils: prediction
and formulas, in: Methods of soil analysis, 1. Physical and Min-eralogical Methods, Agronomy, 9, 2nd Edn., edited by: Klute, A., Am. Soc. Agron., Madison, Wisconsin, 1986.
Oster, J. D., Letey, J., Vaughan, P., Wu, L., and Qadir, M.: Com-parison of transient state models that include salinity and matric stress effects on plant yield, Agr. Water Manage., 103, 167–175, 2012.
Schapendonk, A. H. C. M., Stol, W., van Kraalingen, D. W. G., and Bouman, B. A. M.: LINGRA, a sink/source model to simu-late grassland productivity in Europe, Eur. J. Agron., 9, 87–100, doi:10.1016/S1161-0301(98)00027-6, 1998.
Schröder, J. J.: De invloed van grote giften runderdrijfmest op de groei, opbrengst en kwaliteit van snijmais en op de bodemvrucht-baarheid en waterverontreiniging; Maarheze (zandgrond) 1974– 1982, Verslag no. 31, PAGV, Lelystad, 1985.
Teixeira, E. I., Fischer, G., van Velthuizen, H., Walter, C., and Ewert, F.: Global hot-spots of heat stress on agricultural crops due to climate change, Agr. Forest Meteorol., 170, 206–215, doi:10.1016/j.agrformet.2011.09.002, 2013.
UNEP: Proceedings of the Ad-hoc Expert Group Meeting to Dis-cuss Global Soil Databases and Appraisal of GLASOD/SOTER, 24–28 February 1992, Nairobi, UNEP, 1992.
van Dam, J. C., Groenendijk, P., Hendriks, R. F. A., and Kroes J. G.: Advances of modeling water flow in variably saturated soils with SWAP, Vadose Zone J., 7, 640–653, 2008.
van Diepen, C. A., Wolf, J., and van Keulen, H.: WOFOST: a sim-ulation model of crop production, Soil Use Manage., 5, 16–24, 1999.
van Genuchten, M. T.: A closed-form equation for predicting the hydraulic properties of unsaturated soils, Soil Sci. Soc. Am. J., 44, 892–898, 1980.
van Keulen, H. and Wolf, J. (Eds.): Modelling of agricultural pro-duction: weather, soils and crops. Simulation Monographs, Pu-doc, Wageningen, the Netherlands, 1986.