ACPD
9, 4301–4333, 2009Validation of SCIAMACHY and OMI
NO2 in Israeli cities
K. F. Boersma et al.
Title Page
Abstract Introduction
Conclusions References
Tables Figures
◭ ◮
◭ ◮
Back Close
Full Screen / Esc
Printer-friendly Version
Interactive Discussion
Atmos. Chem. Phys. Discuss., 9, 4301–4333, 2009 www.atmos-chem-phys-discuss.net/9/4301/2009/ © Author(s) 2009. This work is distributed under the Creative Commons Attribution 3.0 License.
Atmospheric Chemistry and Physics Discussions
This discussion paper is/has been under review for the journalAtmospheric Chemistry and Physics (ACP). Please refer to the corresponding final paper inACPif available.
Validation of urban NO
2
concentrations
and their diurnal and seasonal variations
observed from space (SCIAMACHY and
OMI sensors) using in situ measurements
in Israeli cities
K. F. Boersma1,2, D. J. Jacob1, M. Trainic3, Y. Rudich3, I. DeSmedt4, R. Dirksen2, and H. J. Eskes2
1
Harvard University, School of Engineering and Applied Sciences, 29 Oxford Street, Cambridge, MA 02138, USA
2
ACPD
9, 4301–4333, 2009Validation of SCIAMACHY and OMI
NO2 in Israeli cities
K. F. Boersma et al.
Title Page
Abstract Introduction
Conclusions References
Tables Figures
◭ ◮
◭ ◮
Back Close
Full Screen / Esc
Printer-friendly Version
Interactive Discussion 3
Weizmann Institute, Department of Environmental Sciences, Rehovot 76100, Israel
4
Belgian Institute for Space Aeronomy, Avenue Circulaire 3, 1180, Brussels, Belgium
Received: 11 December 2008 – Accepted: 11 December 2008 – Published: 10 February 2009
Correspondence to: K. F. Boersma ([email protected])
ACPD
9, 4301–4333, 2009Validation of SCIAMACHY and OMI
NO2 in Israeli cities
K. F. Boersma et al.
Title Page
Abstract Introduction
Conclusions References
Tables Figures
◭ ◮
◭ ◮
Back Close
Full Screen / Esc
Printer-friendly Version
Interactive Discussion
Abstract
We compare a full-year (2006) record of surface air NO2 concentrations measured in
Israeli cities to coinciding retrievals of tropospheric NO2 columns from satellite
sen-sors (SCIAMACHY aboard ENVISAT and OMI aboard Aura). This provides a large statistical data set for validation of NO2 satellite measurements in urban air, where 5
validation is difficult yet crucial for using these measurements to infer NOx emissions
by inverse modeling. Assuming that NO2 is well-mixed throughout the boundary layer (BL), and using observed average seasonal boundary layer heights, near-surface NO2
concentrations are converted into BL NO2 columns. The agreement between OMI
and (13:45) BL NO2 columns (slope=0.93, n=542), and the comparable results at
10
10:00 h for SCIAMACHY, allow a validation of the seasonal, weekly, and diurnal cycles in satellite-derived NO2. OMI and BL NO2 columns show consistent seasonal cycles
(winter NO21.6–2.7×higher than summer). BL and coinciding OMI columns both show
a strong weekly cycle with 45–50% smaller NO2 columns on Saturday relative to the weekday mean, reflecting the reduced weekend activity, and validating the weekly cycle
15
observed from space. The diurnal difference between SCIAMACHY (10:00) and OMI (13:45) NO2is maximum in summer when SCIAMACHY is up to 40% higher than OMI, and minimum in winter when OMI slightly exceeds SCIAMACHY. A similar seasonal variation in the diurnal difference is found in the source region of Cairo. The surface measurements in Israel cities confirm this seasonal variation in the diurnal cycle. Using
20
simulations from a global 3-D chemical transport model (GEOS-Chem), we show that this seasonal cycle can be explained by a much stronger photochemical loss of NO2in
summer than in winter.
1 Introduction
Nitrogen oxides (NOx≡NO+NO2) are of central importance for atmospheric chemistry. 25
ACPD
9, 4301–4333, 2009Validation of SCIAMACHY and OMI
NO2 in Israeli cities
K. F. Boersma et al.
Title Page
Abstract Introduction
Conclusions References
Tables Figures
◭ ◮
◭ ◮
Back Close
Full Screen / Esc
Printer-friendly Version
Interactive Discussion
(OH) which is the main atmospheric oxidant. About 2/3 of the global source of NOxis from fossil fuel combustion (IPCC, 2007) and is concentrated in urban areas. Satellite observations of tropospheric NO2columns by solar backscatter from the GOME,
SCIA-MACHY, and OMI sensors have provided increasing information over the past decade to quantify NOx emissions and their trends at various scales (e.g. Martin et al., 2003, 5
2006; Richter et al., 2004; Konovalov et al., 2006; Wang et al., 2007; van der A et al., 2008). Validating these satellite observations is difficult, however. We show here that long-term surface NO2measurements from urban air quality monitoring networks
pro-vide valuable validation data and can test the seasonal, weekly, and diurnal variations seen from space by the SCIAMACHY and OMI sensors.
10
The atmospheric lifetime of NOx against oxidation is of the order of hours (Liang et al., 1998), resulting in large spatial and temporal variability around source areas. High concentrations are mainly restricted to the boundary layer up to 1–2 km, with rapid drop-offat higher altitudes. Drop-offis particularly sharp for NO2 because of the decrease of the NO2/NO ratio with decreasing temperature (Martin et al., 2004). Vali-15
dation of NO2column measurements from space has relied on aircraft vertical profiles
coincident with satellite overpasses to capture the full extent of the column (Heland et al., 2002; Martin et al., 2004, 2006; Bucsela et al., 2008). This is expensive and as a result validation data are few. Horizontal variability over the satellite footprint, aircraft traffic restrictions, and the need to extrapolate from the aircraft floor to the surface can
20
further lead to significant errors in comparing aircraft-derived columns to the satellite column measurements. This is particularly problematic in urban areas which are of prime interest for validation (Boersma et al., 2008b).
Surface observations of NO2 concentrations in urban areas offer an alternate
vehi-cle for satellite validation. Most developed countries have dense urban monitoring
net-25
works for NO2 because it is a regulated pollutant (Ellis, 1975; Hjelbrekke and Fjæraa, 2008). The standard monitoring instrumentation is subject to interferences from NOx
ACPD
9, 4301–4333, 2009Validation of SCIAMACHY and OMI
NO2 in Israeli cities
K. F. Boersma et al.
Title Page
Abstract Introduction
Conclusions References
Tables Figures
◭ ◮
◭ ◮
Back Close
Full Screen / Esc
Printer-friendly Version
Interactive Discussion
error. On the other hand, the high spatial and temporal density of the data greatly improve the validation statistics (Schaub et al., 2006; Ord ´o ˜nez et al., 2006; Blond et al., 2007) over what is possible from aircraft profiles. The lack of vertical information in the surface data may in fact be less of a problem than the need to extrapolate aircraft observations down to the surface.
5
2 NO2observations
2.1 SCIAMACHY tropospheric NO2columns
We use tropospheric NO2 columns retrieved from SCIAMACHY on board ESA’s
ENVISAT. This satellite (launched March 2002) orbits the Earth in a polar, sun-synchronous way in a descending node crossing the equator at approximately 10:00
lo-10
cal time. SCIAMACHY observes the atmosphere alternatingly in nadir and limb viewing modes. Tropospheric information is available from the nadir spectra only. In combina-tion with the SCIAMACHY nadir field-of-view, corresponding to a swath width of 960 km on the Earths surface, this leads to global coverage approximately once every six days. The nadir surface spatial resolution is 30×60 km2.
15
We use the SCIAMACHY NO2retrievals (v1.1) available from the Tropospheric
Emis-sion Monitoring Internet Service (http://www.temis.nl) for the year 2006. The retrieval algorithm has been described in detail in Boersma et al. (2004), and Blond et al. (2007). In brief, slant column densities are determined with Differential Optical Absorp-tion Spectroscopy (DOAS) in the 426.3–451.3 nm spectral window. The stratospheric
20
(background) slant column is estimated from data assimilation of slant columns in the global chemistry-transport model TM4 (Dentener et al., 2003). After subtraction of the stratospheric slant column, the residual tropospheric slant column is translated into a tropospheric vertical column by a tropospheric air mass factor that accounts for view-ing geometry, the NO2 and temperature profile shape, as well as the pressure and
25
ACPD
9, 4301–4333, 2009Validation of SCIAMACHY and OMI
NO2 in Israeli cities
K. F. Boersma et al.
Title Page
Abstract Introduction
Conclusions References
Tables Figures
◭ ◮
◭ ◮
Back Close
Full Screen / Esc
Printer-friendly Version
Interactive Discussion
relative to earlier versions (v1.04) because it includes cloud parameters retrieved from FRESCO+. The FRESCO+algorithm uses a more realistic physical model of the at-mosphere by accounting for single Rayleigh scattering, and this leads to higher cloud fractions and cloud pressures. These in turn result in NO2columns that are lower for
polluted situations with low clouds, leading to better agreement with independent NO2
5
validation data (Wang et al., 2008).
Errors in the slant column fitting, the stratospheric correction, and in the air mass fac-tor lead to an overall error in the SCIAMACHY tropospheric NO2columns with an ab-solute component of approximately 0.65×10¹⁵molecules cm−2(from the tropospheric
slant column) and a relative component of approximately 30% (from the tropospheric
10
air mass factor).
2.2 OMI tropospheric NO2columns
OMI onboard NASA’s EOS-Aura satellite (launched July 2004) provides tropospheric NO2 columns at approximately 13:45 local time. Together with the 10:00
measure-ments by SCIAMACHY, this provides valuable information on the diurnal cycle in
15
NO2. OMI also improves on SCIAMACHY because it observes the Earth’s
atmo-sphere continuously in nadir mode with a 114◦ field-of-view (2600 km on the Earth’s surface), thereby achieving daily global coverage. Furthermore, the nadir spatial resolution of 13×24 km2 allows for the observation of finer details, and increases
the likelihood of encountering cloud-free scenes (Krijger et al., 2007). We use the
20
DOMINO (Dutch OMI NO2) product (v1.02) available from http://www.temis.nl for the year 2006. The retrieval algorithm has been described in detail in Boersma et al. (2007), and recent updates can be found in the DOMINO Product Specification Doc-ument (http://www.temis.nl/docs/OMI NO2 HE5 1.0.2.pdf). Slant columns are deter-mined with DOAS in the 405–465 nm spectral window. As for SCIAMACHY, a
strato-25
dif-ACPD
9, 4301–4333, 2009Validation of SCIAMACHY and OMI
NO2 in Israeli cities
K. F. Boersma et al.
Title Page
Abstract Introduction
Conclusions References
Tables Figures
◭ ◮
◭ ◮
Back Close
Full Screen / Esc
Printer-friendly Version
Interactive Discussion
ferent cloud retrievals are used (FRESCO+for SCIAMACHY and O2-O2; Acarreta et al., 2004 for OMI). The a priori profile shapes are sampled from the same TM4 model, at 10:00 and 13:30 h for SCIAMACHY and OMI respectively (Boersma et al., 2008a).
OMI retrieval errors have an absolute component of approximately
1.0×10¹⁵molecules cm−2 and a relative (AMF) component of 30% (Boersma et 5
al., 2007). The spectral fitting error is smaller for SCIAMACHY than for OMI because of better SCIAMACHY signal-to-noise ratios, but OMI errors are generally much reduced by averaging over multiple days or over multiple pixels.
2.3 Surface NO2concentrations
We use here near-surface concentrations of NO2 measured every 30 min at 8 sites 10
in Israel for the whole year 2006. Figure 1 and Table 1 show the station locations. Measurements are with standard chemiluminescence instruments using molybdenum oxide converters. NO2 is catalytically converted to NO on a heated (310◦C)
molyb-denum surface and then measured as NO by chemiluminescence after reaction with ozone. The molybdenum converter also partly converts other oxidized nitrogen
com-15
pounds such as nitric acid (HNO3), alkyl nitrates, and peroxyacetyl nitrate (PAN) to NO
(see e.g. Steinbacher et al., 2007; Dunlea et al., 2007 and references therein). This will cause NO2concentrations to be overestimated, especially in photochemically aged airmasses. Steinbacher et al. (2007) have shown biases up to+50% at rural locations downwind of pollution sources in Switzerland. For urban air in Mexico City, Dunlea et
20
al. (2007) find no significant bias in the morning but increasing bias in the afternoon, presumably reflecting the diurnal formation of NOxoxidation products.
Recognizing that most NOy (with NOy defined as the sum of all reactive nitrogen
oxides; NO+NO2+HNO3+organic nitrates) is NOx within urban areas at mid-morning with little prior photochemical activity, and given the lack of evidence for
morning-25
ACPD
9, 4301–4333, 2009Validation of SCIAMACHY and OMI
NO2 in Israeli cities
K. F. Boersma et al.
Title Page
Abstract Introduction
Conclusions References
Tables Figures
◭ ◮
◭ ◮
Back Close
Full Screen / Esc
Printer-friendly Version
Interactive Discussion
1. no correction, i.e. interpreting the NO2 measurements as an upper limit for the true NO2concentrations;
2. correction based on the concurrently observed increase of O3 from 10:00 to
13:45 as an indicator for the interference∆[NOz] (with NOzdefined as NOy-NOx), assuming∆[NOz]=0.1·∆[O3] on a molar basis based on Mexico City data (Dunlea 5
et al., 2007), and with no correction if∆[O3] smaller or equal to 0.
3 Ensemble validation
Table 1 shows direct comparisons of OMI tropospheric NO2 columns to surface NO2
concentrations measured at 8 different stations in Israel at 13:30–14:00 h throughout 2006. From a reduced-major axis (RMA) regression analysis (Clarke, 1980), we find
10
the lowest slopes (0.30, 0.59×10¹⁵molecules cm−2/ppb) for the stations of Haifa and
Ashdod that are situated immediately downwind of a large port (Haifa), and within 2 km of a large power plant and refinery complex (Ashdod). The other six stations are not influenced by such nearby NOx point sources. For Afula, no summertime data were
available, which reduces the range of observed values, but other than that we did not
15
see a good reason to exclude data from Afula from our analysis. Excluding data from Haifa and Ashdod (but maintaining Afula), OMI and surface NO2 are well-correlated (r=0.63, n=542). Correcting the 13:45 h surface NO2 observations for NOz
interfer-ence as described above, leads to surface NO2 concentrations that are on average
smaller by 8%. We conclude that the effect of applying an interference correction for
20
urban NO2 in the early afternoon is modest, reducing surface-based NO2
concentra-tions by approximately 0.7 ppb.
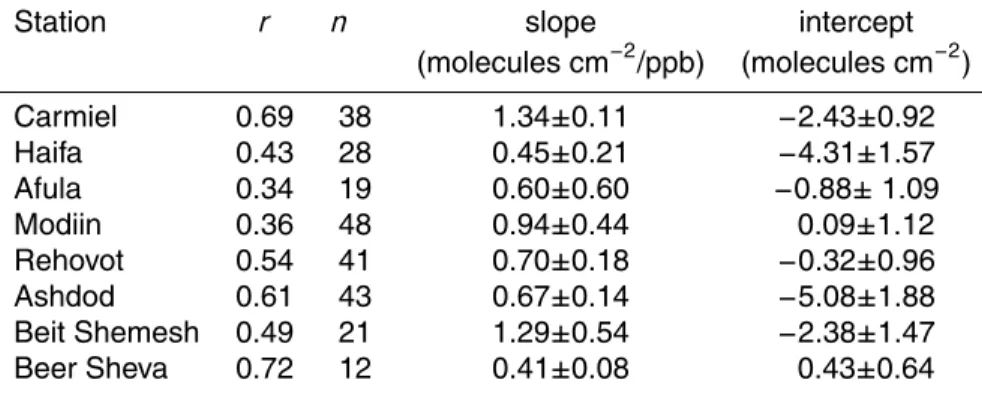
Table 2 shows comparisons of NO2 concentrations measured at 10:00 to SCIA-MACHY tropospheric NO2. For the locations of Haifa and Ashdod, correlations and
slopes are low, consistent with their situation downwind of strong point sources and
25
ACPD
9, 4301–4333, 2009Validation of SCIAMACHY and OMI
NO2 in Israeli cities
K. F. Boersma et al.
Title Page
Abstract Introduction
Conclusions References
Tables Figures
◭ ◮
◭ ◮
Back Close
Full Screen / Esc
Printer-friendly Version
Interactive Discussion
surface NO2amounts tor=0.48 (n=173). Sharpening the spatial coincidence criterion to ±0.1◦, as for OMI, improves the correlation (r=0.55) between surface and
SCIA-MACHY NO2, at the expense of the number of coincidences (n=29).
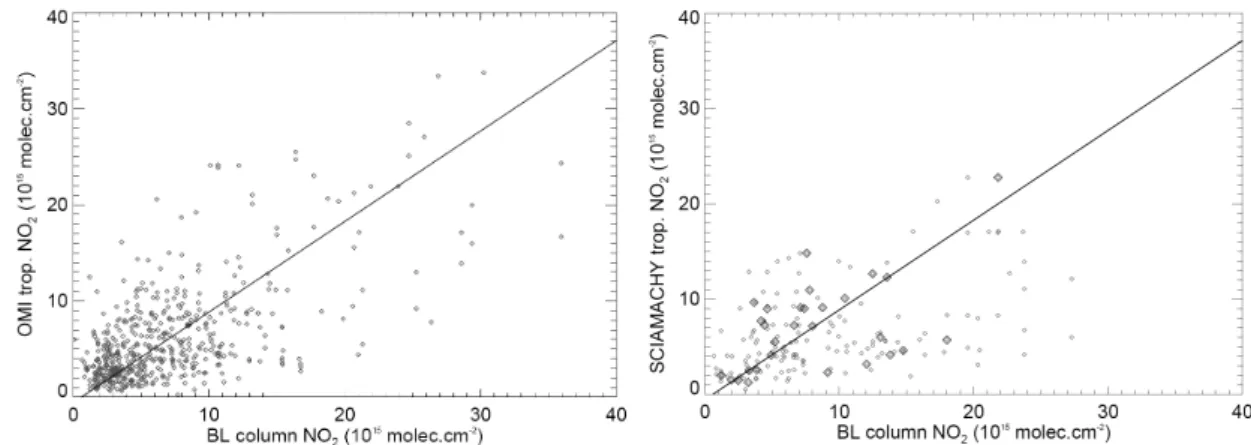
We derive BL NO2 columns from the near-surface NO2 mixing ratios by assuming vertical uniformity in the BL and negligible concentrations above. We take the
noon-5
time mixing depths for Israel from a climatology of mixing depth observations (Table 2 in Dayan et al., 1988) with noontime mixing depths of [1.12, 0.87, 0.65, 0.95] km for winter, spring, summer, and fall respectively. Mixing depths in Israel are minimum in summer due to strong subsidence, and have an uncertainty of ≈25% (Dayan et al.,
2002). Neglecting NO2 above the BL is a reliable assumption (Martin et al., 2002;
10
Boersma et al., 2008b). Figure 2 (left panel) compares tropospheric NO2 columns retrieved from OMI and SCIAMACHY with interference-corrected BL NO2columns
de-rived from near-surface measurements. BL NO2 columns show a similar correlation
with OMI (r=0.64, n=542) as the surface concentrations (r=0.63). The slope of the RMA regression is 0.93±0.06 and the intercept is −0.37×10¹⁵molecules cm−2, indi-15
cating that on average OMI does not deviate significantly from the BL NO2 columns.
Not correcting for interference gives similar agreement (r=0.67, slope 0.90±0.05) and
a slightly larger negative smaller intercept (−0.72 ×10¹⁵molecules cm−2). The right
panel of Fig. 2 shows the agreement between SCIAMACHY and BL NO2 (r=0.46, n=173). Selecting pixels within±0.1◦, as for OMI, improves the correlation (r=0.53,
20
slope=0.94) between BL and SCIAMACHY NO2columns.
4 Temporal variability
4.1 Annual cycle
Figure 3 shows the seasonal variation of NO2 over Israel in 2006 for the five stations with comparable NO2 concentrations and seasonal variations and year-round
cover-25
ACPD
9, 4301–4333, 2009Validation of SCIAMACHY and OMI
NO2 in Israeli cities
K. F. Boersma et al.
Title Page
Abstract Introduction
Conclusions References
Tables Figures
◭ ◮
◭ ◮
Back Close
Full Screen / Esc
Printer-friendly Version
Interactive Discussion
measurements including cloudy conditions. The black dashed line is for measurements coinciding with satellite data, i.e. measured under mostly-clear conditions only. Exclu-sion of cloudy scenes in the validation data subset decreases concentrations by 15% on average but does not affect the seasonal variation.
Both OMI (red squares) and boundary-layer NO2columns (black symbols) are
high-5
est in the winter months, presumably reflecting the seasonal variation of NO2 lifetime.
We see that monthly mean NO2columns from the in situ observations and from OMI
are similar within their error margins for all months. For the boundary-layer columns, error bars mainly reflect the uncertainty in the boundary-layer depths (25%, based on estimates from Dayan et al., 1988). If there is a bias in the BL-depths, it directly
10
propagates into our BL column estimates, and this could explain the large differences between BL columns and OMI in winter. For OMI, error bars indicate the standard de-viation of the mean. The seasonal cycle, expressed as the ratio of winter-to-summer mean NO2, is 2.7±0.6 in the boundary-layer NO2columns, and 1.6±0.5 in surface and
OMI NO2. 15
4.2 Weekly cycle
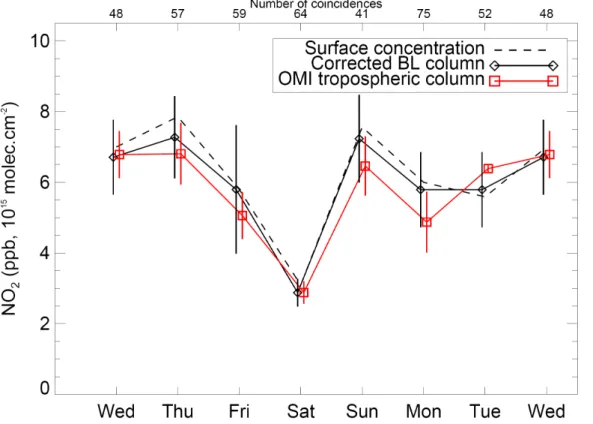
The weekly cycle of coinciding ground-based and OMI NO2is shown in Fig. 4 for five
stations in the period between March and November 2006 (Afula was rejected because no summertime data were available). Wintertime observations have been excluded be-cause in this season no coincidences were available for Saturdays. The weekly cycle
20
is due to reduced NOxemissions on Fridays and Saturdays corresponding to the week-end pattern and days of rest. We observe reductions in NO2 on Friday and Saturday
in surface NO2 concentrations (dashed line), corrected BL NO2 columns (black
dia-monds), as well as in OMI NO2columns (red squares). The reduction on Saturday is significant, 50% relative to the weekday mean. Beirle et al. (2003) observed a similar
25
Saturday NO2reduction over Israel on the regional scale from GOME. Their reduction
(30%) is smaller because the relatively large GOME pixel (320×40 km2) covers not just
ACPD
9, 4301–4333, 2009Validation of SCIAMACHY and OMI
NO2 in Israeli cities
K. F. Boersma et al.
Title Page
Abstract Introduction
Conclusions References
Tables Figures
◭ ◮
◭ ◮
Back Close
Full Screen / Esc
Printer-friendly Version
Interactive Discussion
and Jordan where sources are weaker and less likely to show a distinct weekend ef-fect. In contrast, the small-pixel OMI observations used here are representative for the urban scale and more likely to show the local weekend emission reductions.
4.3 Diurnal cycle
Figure 5 shows average NO2columns measured at the locations of the Israeli stations
5
on the same days at 10:00 and 13:45 in cloud-free conditions in the period March– November 2006. BL and satellite-retrieved NO2columns are consistent at 10:00 and
at 13:45. The geometric mean of the ratio of SCIAMACHY and OMI NO2columns over
Israeli cities is 1.22, and this tendency is quantitatively consistent with the geometric mean of 1.18 of 10:00 and 13:45 surface-based NO2columns. It is unlikely that these 10
results are due to retrieval differences, as SCIAMACHY and OMI NO2 columns have
been retrieved with a consistent algorithm (Boersma et al., 2008a), and both datasets agree well with the independent data shown in Fig. 5. The results appear consis-tent with findings of Boersma et al. (2008a) over fossil fuel source regions at northern mid-latitudes, where SCIAMACHY observed 5–40% higher NO2 than OMI in summer,
15
explained by daytime photochemical loss of NO2, dampened by the diurnal cycle of
anthropogenic NOx emissions that has a broad daytime maximum. Comparing 10:00
and 13:45 NO2observed on the same days during winter months in Israel did not show a clear diurnal cycle, and we will now investigate this further.
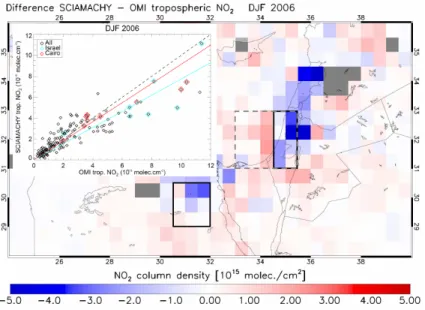
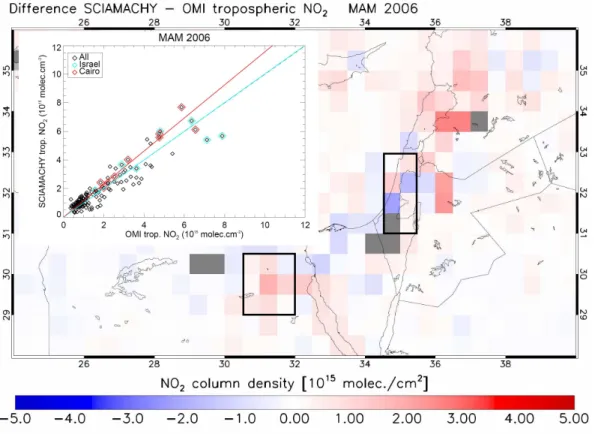
Figures 6a–d show seasonally averaged differences between SCIAMACHY and OMI
20
tropospheric NO2measured on the same day in mostly clear conditions over Israel and the surrounding regions in 2006 on a 0.5◦×0.5◦ grid. The inset shows the
correspond-ing scatter plot with the Israeli grid cells marked in light blue. For comparison to a nearby industrialized region, we also plotted the Cairo grid cells, in red. In winter (DJF 2006), when NO2 lifetimes are longest and NO2 columns largest, we see in Fig. 6a 25
that SCIAMACHY tends to observe similar or lower NO2 amounts at 10:00 than OMI
ACPD
9, 4301–4333, 2009Validation of SCIAMACHY and OMI
NO2 in Israeli cities
K. F. Boersma et al.
Title Page
Abstract Introduction
Conclusions References
Tables Figures
◭ ◮
◭ ◮
Back Close
Full Screen / Esc
Printer-friendly Version
Interactive Discussion
lines in the inset. In summer, with shorter chemical lifetimes and smaller NO2columns than in winter, we see the reverse effect in Fig. 6c with 10:00–13:45 ratios of 1.29 over Israel and 1.16 over Cairo. Spring and autumn show diurnal variations in between the winter and summer extremes. Table 3 summarizes the mean 10:00–13:45 ratios for all seasons.
5
To evaluate this apparent seasonal cycle in the diurnal cycle, we compare ratios of NO2 at 10:00 and 13:45 observed from satellites and from surface stations. We do not require spatial or temporal coincidence between satellite and surface measure-ments (as we did before), but only that both techniques measured under mostly-clear situations. The left panel of Fig. 7 shows significant 10:00–13:45 decreases in both
10
satellite and surface-based observations over Israel in summer, and no decrease, or even a slight increase, in winter months. This is consistent with simulations from the 3-D chemistry-transport model GEOS-Chem (Bey et al., 2001) for the same location and time, as shown in the right panel of Fig. 7. In summer, GEOS-Chem simulates up to 21% higher NO2columns at 10:00, compared to smaller differences in winter. That the 15
GEOS-Chem summertime ratios are smaller than observed by the two measurement techniques, is explained by the spatial extent of the GEOS-Chem grid cell (2◦
×2.5◦).
The GEOS-Chem grid cell covers not only the region of Israel where NOx sources are
strong, but also a large part of the Mediterranean Sea where these sources are weak. To bridge the gap between the simulation and the higher-resolution observations, we
20
sampled the satellite measurements according to the boundaries of the GEOS-Chem grid cell. The seasonal cycle in the diurnal cycle observed at 2◦×2.5◦ (solid red curve)
agrees much better with the GEOS-Chem simulations than the high-resolution curve (2◦×1◦, dashed line).
The diurnal variation of tropospheric NO2 columns depends on the diurnal cycle of 25
NOxemissions and chemical loss (see Eq. 3 in Boersma et al., 2008a). Over urban ar-eas, NOx emissions show a daytime maximum that mainly reflects intense vehicle use
ACPD
9, 4301–4333, 2009Validation of SCIAMACHY and OMI
NO2 in Israeli cities
K. F. Boersma et al.
Title Page
Abstract Introduction
Conclusions References
Tables Figures
◭ ◮
◭ ◮
Back Close
Full Screen / Esc
Printer-friendly Version
Interactive Discussion
the diurnal cycle of tropospheric NO2columns can therefore be understood mainly in terms of seasonally varying photochemistry.
Figure 8 shows a GEOS-Chem simulation over Israel of the diurnal variation in the NO2column and in the chemical loss rate constantk for a winter and a summer month in cloud-free conditions.kincludes the chemical loss of NOxto HNO3through the gas-5
phase reaction of NO2 with OH and the hydrolysis of N2O5 in aerosols. The
GEOS-Chem model incorporating diurnally varying NOxemissions and photochemistry simu-lates up to 5×higher values and a much more pronounced diurnal cycle forkin August
than in February 2006. In winter, the absence of a daytime maximum in NOx loss is
expected to lead to an increase of NOxover the course of the day, because emissions
10
are higher in the day than at night. The seasonal differences in k are consistent with higher OH concentrations in summer reflecting higher water vapour concentrations and more UV flux in that season (Spivakovsky et al., 2000). It is this strong daytime change ink (OH) in summer that is responsible for the distinct decrease in the NO2columns between 10:00 and 13:45 in summer. In winter, the chemical loss rate constant is
gen-15
erally too small throughout the day (low OH) to yield a net chemical loss, implying that NOx emissions may offset chemical loss during the daylight hours in that season. It is this mechanism that likely explains the observed wintertime 10:00–13:45 increases (expressed as ratios<1.0) in Fig. 7.
5 Conclusions
20
We showed that NO2 concentration data from urban monitoring networks can provide
useful validation for NO2 column measurements from space. Previous validations of
satellite retrievals relied primarily on profile measurements from aircraft, but these do not sample the lowest part of the atmosphere, where most of the NO2 resides and
strong gradients exist, and provide little statistics needed to overcome difficulties in
25
continu-ACPD
9, 4301–4333, 2009Validation of SCIAMACHY and OMI
NO2 in Israeli cities
K. F. Boersma et al.
Title Page
Abstract Introduction
Conclusions References
Tables Figures
◭ ◮
◭ ◮
Back Close
Full Screen / Esc
Printer-friendly Version
Interactive Discussion
ous datasets.
Our validation focused on urban locations in Israel in 2006. In situ measurements (10:00 and 13:45 h) of NO2 concentrations show significant correlation with collocated
SCIAMACHY and OMI tropospheric NO2 column retrievals. We converted surface
concentrations into columns representative for the boundary layer (BL) by assuming a
5
well-mixed BL, and a climatology of observed Israeli BL depths. Afternoon surface NO2
has been corrected for potential interference from oxidized nitrogen compounds (NOz).
This correction leads to 5–15% smaller NO2concentrations. The collocated 13:45 h BL and OMI NO2columns are in agreement (r=0.64,n=542, slope=0.93±0.07). A similar
agreement is apparent in 10:00 h BL and SCIAMACHY NO2 columns, provided they 10
were collocated within 0.1◦.
The observed seasonal cycles in ground-based measurements and OMI NO2 are
consistent. BL and OMI NO2columns are 1.6–2.7×higher in winter than in summer,
reflecting the strong seasonal variation in photochemistry and NO2 lifetime. OMI ob-serves a strong weekly cycle with approximately 50% smaller NO2columns on the Sat-15
urdays relative to the weekday mean. Ground-based techniques observe 46% lower NO2on Saturdays, similar as from space.
Outside the winter season, collocated satellite and ground-based measurements show higher NO2 columns at 10:00 than at 13:45. In summer, the diurnal variation is
strongest, with 10:00–13:45 ratios up to 1.4. In winter, the observed ratios are close
20
to 1.0, and there is often a (small) increase in tropospheric NO2between mid-morning and early afternoon. Simulations with the global 3-D chemical transport model GEOS-Chem are consistent with the observed seasonal variation in the 10:00 vs. 13:45 dif-ference. The simulations suggest that the high summertime and low wintertime ratios can be understood from a much stronger photochemical sink from oxidation by OH in
25
summer than in winter. In winter, the photochemical sink is sufficiently small that con-tinuous NOx emissions may offset chemical loss during the daylight hours, explaining the observed 10:00–13:45 increase in NO2.
ACPD
9, 4301–4333, 2009Validation of SCIAMACHY and OMI
NO2 in Israeli cities
K. F. Boersma et al.
Title Page
Abstract Introduction
Conclusions References
Tables Figures
◭ ◮
◭ ◮
Back Close
Full Screen / Esc
Printer-friendly Version
Interactive Discussion
confidence in top-down constraints on NOx emissions from the satellite data. But re-trievals should be improved by using forward model parameters (surface albedo’s, a priori profile shapes, and surface pressures) from data bases with horizontal reso-lutions similar to the satellite footprints. Aerosols contribute to retrieval uncertainty because they affect retrieved cloud fractions, and this complex interaction should be
5
investigated further in order to reduce retrieval errors.
Acknowledgements. This work was funded by the NASA Atmospheric Composition Modeling
and Analysis Program. The OMI project is managed by NIVR and KNMI in The Netherlands. The ground level data was provided by the Israel Ministry of Environmental Protection. Yinon Rudich acknowledges support by the Helen and Martin Kimmel Award for Innovative
Investiga-10
tion.
References
Acarreta, J. R., de Haan, J. F., and Stammes, P.: Cloud pressure retrieval using the O2-O2 absorption band at 477 nm, J. Geophys. Res., 109, D05204, doi:10.1029/2003JD003915, 2004. 4307
15
Beirle, S., Platt, U., Wenig, M., and Wagner, T.: Weekly cycle of NO2by GOME measurements: a signature of anthropogenic sources, Atmos. Chem. Phys., 3, 2225–2232, 2003,
http://www.atmos-chem-phys.net/3/2225/2003/. 4310
Bey, I., Jacob, D. J., Yantosca, R. M., Logan, J. A., Field, B. D., Fiore, A. M., Li, Q., Liu, H. Y., Mickley, L. J., and Schultz, M. G.: Global modeling of tropospheric chemistry with assimilated
20
meteorology: Model description and evaluation, J. Geophys. Res., 106, 23073–23096, 2001. 4312
Blond, N., Boersma, K. F., Eskes, H. J., van der A, R. J., Van Roozendael, M., De Smedt, I., Bergamatti, G., and Vautard, R.: Intercomparison of SCIAMACHY nitrogen dioxide ob-servations, in situ measurements and air quality modeling results over Western Europe, J.
25
Geophys. Res., 112, D10311, doi:10.1029/2006JD007277, 2007. 4305
ACPD
9, 4301–4333, 2009Validation of SCIAMACHY and OMI
NO2 in Israeli cities
K. F. Boersma et al.
Title Page
Abstract Introduction
Conclusions References
Tables Figures
◭ ◮
◭ ◮
Back Close
Full Screen / Esc
Printer-friendly Version
Interactive Discussion
Boersma, K. F., Eskes, H. J., Veefkind, J. P., Brinksma, E. J., van der A, R. J., Sneep, M., van den Oord, G. H. J., Levelt, P. F., Stammes, P., Gleason, J. F., and Bucsela, E. J.: Near-real time retrieval of tropospheric NO2from OMI, Atmos. Chem. Phys., 7, 2103–2118, 2007, http://www.atmos-chem-phys.net/7/2103/2007/. 4306, 4307
Boersma, K. F., Jacob, D. J., Eskes, H. J., Pinder, R. W., Wang, J., and van der A, R. J.:
5
Intercomparison of SCIAMACHY and OMI tropospheric NO2 columns: Observing the di-urnal evolution of chemistry and emissions from space, J. Geophys. Res., 113, D16S26, doi:10.1029/2007JD008816, 2008. 4307, 4311, 4312
Boersma, K. F., Jacob, D. J., Bucsela, E. J., Perring, A. E., Dirksen, R., van der A, R. J., Yantosca, R. M., Park, R. J., Wenig, M. O., Bertram, T. H., and Cohen, R. C.: Validation
10
of OMI tropospheric NO2 observations during INTEX-B and application to constrain NOx emissions over the eastern United States and Mexico, Atmos. Environ., 42(19), 4480–4497, doi:10.1026/j.atmosenv.2008.02.004, 2008. 4304, 4309
Bucsela, E. J., Perring, A. E., Cohen, R. C., Boersma, K. F., Celarier, E. A. Gleason, J. F., Wenig, M. O., Bertram, T. H., Wooldridge, P. J., Dirksen, R., and Veefkind, J. P.: Comparison
15
of tropospheric NO2 from in-situ aircraft measurements with near-real time and standard product data from OMI, J. Geophys. Res., 113, D16S31, doi:10.1029/2007JD008838, 2008. 4304
Clarke, M. R. B.: The reduced major axis of a bivariate sample, Biometrika, 67(2), 441–446, 1980. 4308
20
Dayan, U., Shenhav, R., and Graber, M.: The Spatial and Temporal Behavior of the Mixed Layer in Israel, J. Appl. Meteorol., 27, 1382–1394, 1988. 4309, 4310
Dayan, U., Lifshitz-Goldreich, B., and Pick, K.: Spatial and Structural Variation of the Atmo-spheric Boundary Layer during Summer in IsraelProfiler and Rawinsonde measurements, J. Appl. Meteorol., 41, 447–457, 2002. 4309
25
Dentener, F., Peters, W., Krol, M. van Weele, M., Bergamaschi, P., and Lelieveld, J.: Interannual variability and trend of CH4 lifetime as a measure of OH changes in the 1979–2003 period, J. Geophys. Res., 108(D15), 4442, doi:10.1029/2002JD002916, 2003. 4305
Dunlea, E. J., Herndon, S. C., Nelson, D. D., Volkamer, R. M., San Martini, F., Sheehy, P. M., Zahniser, M. S., Shorter, J. H., Wormhoudt, J. C., Lamb, B. K., Allwine, E. J., Gaffney, J.
30
ACPD
9, 4301–4333, 2009Validation of SCIAMACHY and OMI
NO2 in Israeli cities
K. F. Boersma et al.
Title Page
Abstract Introduction
Conclusions References
Tables Figures
◭ ◮
◭ ◮
Back Close
Full Screen / Esc
Printer-friendly Version
Interactive Discussion
2691–2704, 2007, http://www.atmos-chem-phys.net/7/2691/2007/. 4304, 4307, 4308 Ellis, E. C.: Technical assistance document for the chemiluminescence measurement of
nitro-gen dioxide, Environmental Monitoring and Support Laboratory, US Environmental Protec-tion Agency, EPA-600/4-75-003, 1975. 4304
Gerboles, M., Lagler, F., Rembges, D., and Brun, C.: Assessment of uncertainty of NO2
mea-5
surements by the chemiluminescence method and discussion of the quality objective of the NO2European Directive, J. Environ. Monitor., 5, 529–540, 2003. 4304
Heland, J., Schlager, H., Richter, A., and Burrows, J. P.: First comparison of tropospheric NO2 column densities retrieved from GOME measurements and in situ aircraft profile measure-ments, Geophys. Res. Lett., 29(20), 1983, doi:10.1029/2002GL015528, 2002. 4304
10
Hjelbrekke, A.-G. and Fjæraa, A. M.: Acidifying and eutrophying compounds and particulate matter, Data Report 2006, EMEP/CCC-Report 1/2008, Kjeller, Norwegian Institue for Air Research, 5–8, 2008. 4304
IPCC: Climate Change 2007: The Physical Science Basis. Contribution of Working Group I to the Fourth Assessment Report of the Intergovernmental Panel on Climate Change, edited
15
by: Solomon, S., Qin, D., Manning, M., Chen, Z., Marquis, M., Averyt, K. B., Tignor, M., and Miller, H. L., Cambridge University Press, Cambridge, United Kingdom and New York, NY, USA, 996 pp., 2007. 4304
Konovalov, I. B., Beekmann, M., Richter, A., and Burrows, J. P.: Inverse modelling of the spatial distribution of NOxemissions on a continental scale using satellite data, Atmos. Chem. Phys.,
20
6, 1747–1770, 2006, http://www.atmos-chem-phys.net/6/1747/2006/. 4304
Krijger, J. M., van Weele, M., Aben, I., and Frey, R.: Technical Note: The effect of sensor resolution on the number of cloud-free observations from space, Atmos. Chem. Phys., 7, 2881–2891, 2007, http://www.atmos-chem-phys.net/7/2881/2007/. 4306
Lamsal, L. N., Martin, R. V., van Donkelaar, A., Steinbacher, M., Celarier, E. A., Bucsela,
25
E., Dunlea, E. J., and Pinto, J. P.: Ground-level nitrogen dioxide concentrations inferred from the satellite-borne Ozone Monitoring Instrument, J. Geophys. Res., 113, D16308, doi:10.1029/2007JD009235, 2008. 4304
Liang, J., Horowitz, L. W., Jacob, D. J., Wang, Y., Fiore, A. M., Logan, J. A., Gardner, G. M., and Munger, J. W.: Seasonal budgets of reactive nitrogen species and ozone over the
30
United States, and export fluxes to the global atmosphere, J. Geophys. Res., 103, D11, 13435–13450, 1998. 4304
ACPD
9, 4301–4333, 2009Validation of SCIAMACHY and OMI
NO2 in Israeli cities
K. F. Boersma et al.
Title Page
Abstract Introduction
Conclusions References
Tables Figures
◭ ◮
◭ ◮
Back Close
Full Screen / Esc
Printer-friendly Version
Interactive Discussion
F., Palmer, P. I., Bey, I., Fiore, A. M., Li, Q., Yantosca, R. M., and Koelemeijer, R. B. A.: An improved retrieval of tropospheric nitrogen dioxide from GOME, J. Geophys. Res., 107(D20), 4437, doi:10.1029/2001JD001027, 2002. 4309
Martin, R. V., Jacob, D. J., Chance, K. V., Kurosu, T. P., Palmer, P. I., and Evans, M. J.: Global inventory of Nitrogen Dioxide Emissions Constrained by Space-based Observations of NO2
5
Columns, J. Geophys. Res., 108, 4537, doi:10.1029/2003/JD003453, 2003. 4304
Martin, R. V., Parrish, D. D., Ryerson, T. B., Nicks Jr., D. K., Chance, K., Kurosu, T. P., Jacob, D. J., Sturges, E. D., Fried, A., and Wert, B. P.: Evaluation of GOME satellite measurements of tropospheric NO2and HCHO using regional data from aircraft campaigns in the southeastern United States, J. Geophys. Res., 109, D24307, doi:10.1029/2004JD004869, 2004. 4304
10
Martin, R. V., Sioris, C. E., Chance, K., Ryerson, T. B., Bertram, T. H., Wooldridge, P. J., Cohen, R. C., Neuman, J. A., Swanson, A., and Flocke, F. M.: Evaluation of space-based constraints on global nitrogen oxide emissions with regional aircraft measurements over and downwind of eastern North America, J. Geophys. Res., 111, D15308, doi:10.1029/2005JD006680, 2006. 4304
15
Ord ´o ˜nez, C., Richter, A., Steinbacher, M., Zellweger, C., N ¨uss, H., Burrows, J. P., and Pr ´ev ˆot, A. S. H.: Comparison of 7 years of satellite-borne and ground-based tropospheric NO2 mea-surements around Milan, Italy, J. Geophys. Res., 111, D05310, doi:10.1029/2005JD006305, 2006. 4305
Petritoli, A., Bonasoni, P., Giovanelli, G., Ravegnani, F., Kostadinov, I., Bortoli, D., Weiss, A.,
20
Schaub, D., Richter, A., and Fortezza, F.: First comparison between ground-based and satellite-borne measurements of tropospheric nitrogen dioxide in the Po basin, J. Geophys. Res., 109, D15307, doi:10.1029/2004JD004547, 2004.
Richter, A., Eyring, V., Burrows, J. P., Bovensmann, H., Lauer, A., Sierk, B., and Crutzen, P. J.: Satellite measurements of NO2from international shipping emissions, Geophys. Res. Lett.,
25
31, L23110, doi:10.1029/2004GL020822, 2004. 4304
Schaub, D., Boersma, K. F., Kaiser, J. W., Weiss, A. K. Folini, D., Eskes, H. J., and Buch-mann, B.: Comparison of GOME tropospheric NO2columns with NO2profiles deduced from ground-based in situ measurements, Atmos. Chem. Phys., 6, 3211–3229, 2006,
http://www.atmos-chem-phys.net/6/3211/2006/. 4305
30
ACPD
9, 4301–4333, 2009Validation of SCIAMACHY and OMI
NO2 in Israeli cities
K. F. Boersma et al.
Title Page
Abstract Introduction
Conclusions References
Tables Figures
◭ ◮
◭ ◮
Back Close
Full Screen / Esc
Printer-friendly Version
Interactive Discussion
doi:10.1029/2006JD007971, 2007. 4304, 4307
Spivakovsky, C. M., Logan, J. A., Montzka, S. A., Balkanski, Y. J., Foreman-Bowler, M., Jones, D. B. A., Horowitz, L. W., Fusco, A. C., Brenninkmeijer, C. A. M., Prather, M. J., Wofsy, S. C., and McElroy, M. B.: Three-dimensional climatological distribution of tropospheric OH: Update and evaluation, J. Geophys. Res., 105(D7), 8931–8980, 2000. 4313
5
van der A, R. J., Eskes, H. J., Boersma, K. F., van Noije, T. P. C., Van Roozendael, M., De Smedt, I., Peters, D. H. M. U., and Meijer, E. W.: Trends, seasonal variability and dominant NOxsource derived from a ten year record of NO2measured from space, J. Geophys. Res., 113, D04302, doi:10.1029/2007JD009021, 2008. 4304
Wang, Y. X., McElroy, M. B., Boersma, K. F., Eskes, H. J., and Veefkind, J. P.: Traffic
Restric-10
tions Associated with the Sino-African Summit: Reductions of NOx Detected from Space, Geophys. Res. Lett., 34, L08814, doi:10.1029/2007GL029326, 2007. 4304
Wang, P., Stammes, P., van der A, R., Pinardi, G., and van Roozendael, M.: FRESCO+: an improved O2 A-band cloud retrieval algorithm for tropospheric trace gas retrievals, Atmos. Chem. Phys., 8, 6565–6576, 2008, http://www.atmos-chem-phys.net/8/6565/2008/. 4306
15
Zhang, L., Jacob, D. J., Boersma, K. F., Jaffe, D. A., Olson, J. R., Bowman, K. W., Worden, J. R., Thompson, A. M., Avery, M. A., Cohen, R. C., Dibb, J. E., Flock, F. M., Fuelberg, H. E., Huey, L. G., McMillan, W. W., Singh, H. B., and Weinheimer, A. J.: Transpacific transport of ozone pollution and the effect of recent Asian emission increases on air quality in North America: an integrated analysis using satellite, aircraft, ozonesonde, and surface observations, Atmos.
20
ACPD
9, 4301–4333, 2009Validation of SCIAMACHY and OMI
NO2 in Israeli cities
K. F. Boersma et al.
Title Page
Abstract Introduction
Conclusions References
Tables Figures
◭ ◮
◭ ◮
Back Close
Full Screen / Esc
Printer-friendly Version
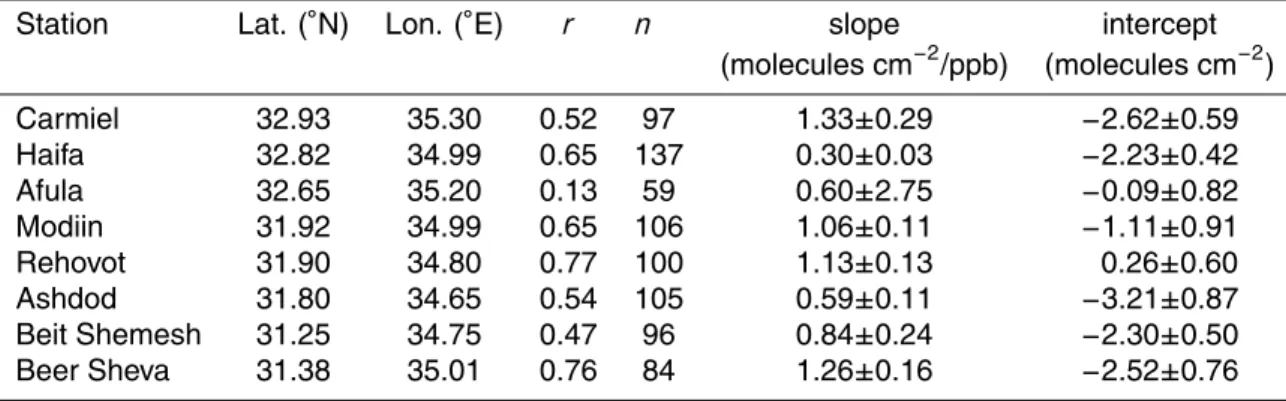
Interactive Discussion Table 1. Summary of the comparison between surface NO2 concentrations and OMI
tropo-spheric NO2columns1at 8 Israeli cities in 2006.
Station Lat. (◦N) Lon. (◦E) r n slope intercept
(molecules cm−2
/ppb) (molecules cm−2
)
Carmiel 32.93 35.30 0.52 97 1.33±0.29 −2.62±0.59
Haifa 32.82 34.99 0.65 137 0.30±0.03 −2.23±0.42
Afula 32.65 35.20 0.13 59 0.60±2.75 −0.09±0.82
Modiin 31.92 34.99 0.65 106 1.06±0.11 −1.11±0.91
Rehovot 31.90 34.80 0.77 100 1.13±0.13 0.26±0.60
Ashdod 31.80 34.65 0.54 105 0.59±0.11 −3.21±0.87
Beit Shemesh 31.25 34.75 0.47 96 0.84±0.24 −2.30±0.50
Beer Sheva 31.38 35.01 0.76 84 1.26±0.16 −2.52±0.76
1OMI tropospheric NO
2columns (v1.02) had a pixel center within±0.1◦latitude/longitude of the station location, and
were measured under mostly-clear situations (cloud radiance fraction<50%). Only OMI observations with viewing zenith angles<35◦were selected, ensuring that the satellite and surface observations coincide within 15 min. The OMI
ACPD
9, 4301–4333, 2009Validation of SCIAMACHY and OMI
NO2 in Israeli cities
K. F. Boersma et al.
Title Page
Abstract Introduction
Conclusions References
Tables Figures
◭ ◮
◭ ◮
Back Close
Full Screen / Esc
Printer-friendly Version
Interactive Discussion Table 2.Summary of the comparison between surface NO2concentrations and SCIAMACHY
tropospheric NO2columns1at 8 Israeli cities in 2006.
Station r n slope intercept
(molecules cm−2
/ppb) (molecules cm−2
)
Carmiel 0.69 38 1.34±0.11 −2.43±0.92
Haifa 0.43 28 0.45±0.21 −4.31±1.57
Afula 0.34 19 0.60±0.60 −0.88±1.09
Modiin 0.36 48 0.94±0.44 0.09±1.12
Rehovot 0.54 41 0.70±0.18 −0.32±0.96
Ashdod 0.61 43 0.67±0.14 −5.08±1.88
Beit Shemesh 0.49 21 1.29±0.54 −2.38±1.47
Beer Sheva 0.72 12 0.41±0.08 0.43±0.64
1Comparison between uncorrected surface NO
2concentrations and SCIAMACHY tropospheric NO2(v1.1) columns
for 8 Israeli stations. We selected SCIAMACHY columns with a pixel center within±0.25◦latitude/longitude of the
ACPD
9, 4301–4333, 2009Validation of SCIAMACHY and OMI
NO2 in Israeli cities
K. F. Boersma et al.
Title Page
Abstract Introduction
Conclusions References
Tables Figures
◭ ◮
◭ ◮
Back Close
Full Screen / Esc
Printer-friendly Version
Interactive Discussion Table 3.The 10:00–13:45 ratios1of tropospheric NO2columns for source regions in the Middle
East.
Region Corner coordinates winter spring summer autumn
Israel 31.0–33.0◦N, 34.5–35.5◦E 0.77 1.00 1.29 0.88 Cairo 29.0–30.5◦N, 30.5–32.0◦E 0.91 1.16 1.16 1.12
ACPD
9, 4301–4333, 2009Validation of SCIAMACHY and OMI
NO2 in Israeli cities
K. F. Boersma et al.
Title Page
Abstract Introduction
Conclusions References
Tables Figures
◭ ◮
◭ ◮
Back Close
Full Screen / Esc
Printer-friendly Version
Interactive Discussion Fig. 1. Annual mean tropospheric NO2column in 2006 from OMI (DOMINO v1.02) for
ACPD
9, 4301–4333, 2009Validation of SCIAMACHY and OMI
NO2 in Israeli cities
K. F. Boersma et al.
Title Page
Abstract Introduction
Conclusions References
Tables Figures
◭ ◮
◭ ◮
Back Close
Full Screen / Esc
Printer-friendly Version
Interactive Discussion Fig. 2. Left panel: OMI tropospheric versus interference-corrected boundary layer NO2
columns (1015molecules cm−2) at 13:30–14:00 h at 6 Israeli stations. The solid line indicates the result of a RMA regression (r=0.63, slope=0.93). OMI measurements have been taken under mostly clear conditions (cloud radiance fraction<50%) and with pixel centres within 0.1◦ of the stations. Right panel: same, but now for SCIAMACHY and boundary layer NO2columns at 10:00 h. The solid line indicates the RMA regression to SCIAMACHY (cloud radiance frac-tion<50%) observations within 0.1◦of the stations, indicated by the larger diamonds (r
ACPD
9, 4301–4333, 2009Validation of SCIAMACHY and OMI
NO2 in Israeli cities
K. F. Boersma et al.
Title Page
Abstract Introduction
Conclusions References
Tables Figures
◭ ◮
◭ ◮
Back Close
Full Screen / Esc
Printer-friendly Version
Interactive Discussion Fig. 3. Seasonal variation of NO2(2006) observed in Israel cities. The dashed-dotted line
ACPD
9, 4301–4333, 2009Validation of SCIAMACHY and OMI
NO2 in Israeli cities
K. F. Boersma et al.
Title Page
Abstract Introduction
Conclusions References
Tables Figures
◭ ◮
◭ ◮
Back Close
Full Screen / Esc
Printer-friendly Version
Interactive Discussion Fig. 4. Weekly variation of NO2 over Israeli cities, March–November 2006. The dashed line
ACPD
9, 4301–4333, 2009Validation of SCIAMACHY and OMI
NO2 in Israeli cities
K. F. Boersma et al.
Title Page
Abstract Introduction
Conclusions References
Tables Figures
◭ ◮
◭ ◮
Back Close
Full Screen / Esc
Printer-friendly Version
Interactive Discussion Fig. 5.Diurnal variation of NO2in Israeli cities in March–November 2006. The black diamonds
ACPD
9, 4301–4333, 2009Validation of SCIAMACHY and OMI
NO2 in Israeli cities
K. F. Boersma et al.
Title Page
Abstract Introduction
Conclusions References
Tables Figures
◭ ◮
◭ ◮
Back Close
Full Screen / Esc
Printer-friendly Version
Interactive Discussion Fig. 6a. Absolute difference between SCIAMACHY and OMI tropospheric NO2columns over
ACPD
9, 4301–4333, 2009Validation of SCIAMACHY and OMI
NO2 in Israeli cities
K. F. Boersma et al.
Title Page
Abstract Introduction
Conclusions References
Tables Figures
◭ ◮
◭ ◮
Back Close
Full Screen / Esc
Printer-friendly Version
ACPD
9, 4301–4333, 2009Validation of SCIAMACHY and OMI
NO2 in Israeli cities
K. F. Boersma et al.
Title Page
Abstract Introduction
Conclusions References
Tables Figures
◭ ◮
◭ ◮
Back Close
Full Screen / Esc
Printer-friendly Version
ACPD
9, 4301–4333, 2009Validation of SCIAMACHY and OMI
NO2 in Israeli cities
K. F. Boersma et al.
Title Page
Abstract Introduction
Conclusions References
Tables Figures
◭ ◮
◭ ◮
Back Close
Full Screen / Esc
Printer-friendly Version
ACPD
9, 4301–4333, 2009Validation of SCIAMACHY and OMI
NO2 in Israeli cities
K. F. Boersma et al.
Title Page
Abstract Introduction
Conclusions References
Tables Figures
◭ ◮
◭ ◮
Back Close
Full Screen / Esc
Printer-friendly Version
Interactive Discussion Fig. 7. Seasonal cycle in the diurnal cycle of tropospheric NO2 columns. Upper panel: cycle
ACPD
9, 4301–4333, 2009Validation of SCIAMACHY and OMI
NO2 in Israeli cities
K. F. Boersma et al.
Title Page
Abstract Introduction
Conclusions References
Tables Figures
◭ ◮
◭ ◮
Back Close
Full Screen / Esc
Printer-friendly Version
Interactive Discussion Fig. 8. Diurnal cycle in tropospheric NO2 columns (solid line) and NOx chemical loss rate