Subauroral red arcs as a conjugate phenomenon:
comparison of OV1-10 satellite data with numerical calculations
A. V. Pavlov
Institute of Terrestrial Magnetism, Ionosphere and Radio-Wave Propagation, Russia Academy of Science. (IZMIRAN), Troitsk, Moscow Region, 142092, Russia
Received: 14 October 1996 / Revised: 3 March 1997 / Accepted: 11 March 1997
Abstract. This study compares the OV1-10 satellite measurements of the integral airglow intensities at 630 nm in the SAR arc regions observed in the northern and southern hemisphere as a conjugate phenomenon, with the model results obtained using the time-depen-dent one-dimensional mathematical model of the Earth ionosphere and plasmasphere (the IZMIRAN model) during the geomagnetic storm of the period 15±17 February 1967. The major enhancements to the IZ-MIRAN model developed in this study are the inclusion of He ions (three major ions: O, H, and He, and three ion temperatures), the updated photochemistry and energy balance equations for ions and electrons, the diusion of NO and O2 ions and O 1D and the revised electron cooling rates arising from their colli-sions with unexcited N2;O2molecules and N2molecules at the ®rst vibrational level. The updated model includes the option to use the models of the Boltzmann or non-Boltzmann distributions of vibrationally excited molec-ular nitrogen. Deviations from the Boltzmann distribu-tion for the ®rst ®ve vibradistribu-tional levels of N2 were calculated. The calculated distribution is highly non-Boltzmann at vibrational levels v>2 and leads to a decrease in the calculated electron density and integral intensity at 630 nm in the northern and southern hemispheres in comparison with the electron density and integral intensity calculated using the Boltzmann vibrational distribution of N2. It is found that the intensity at 630 nm is very sensitive to the oxygen number densities. Good agreement between the modeled and measured intensities is obtained provided that at all altitudes of the southern hemisphere a reduction of about factor 1.35 in MSIS-86 atomic oxygen densities is included in the IZMIRAN model with the non-Boltzm-ann vibrational distribution of N2. The eect of using of the O 1D diusion results in the decrease of 4±6% in the calculated integral intensity of the northern hemi-sphere and 7±13% in the calculated integral intensity of the southern hemisphere. It is found that the modeled intensities of the southern hemisphere are more sensitive to the assumed values of the rate coecients of O 4S
ions with the vibrationally excited nitrogen molecules and quenching of O 2D by atomic oxygen than the modeled intensities of the northern hemisphere.
1 Introduction
During large magnetic storms characterized by a geo-magnetic planetary index Kp of 5 or greater, stable auroral red (SAR) arcs are observed optically on the equatorward edge of the mid-latitude ionospheric trough in both the northern and southern hemispheres on approximately the same L-shell value of the geomagnetic ®eld (Rees and Roble, 1975). A major part of ground and satellite observations that determine the properties of the SAR arcs have been obtained in the northern hemisphere. The observed SAR-arc properties in mag-netically conjugate hemispheres were discussed only by LaValle and Elliott (1972) using OV1-10 satellite data on 16 February 1967, and Reed and Blamont (1968), who determined the positions of the SAR arcs on 28±29 September 1967 using data from the satellite Ogo 4. In this paper we present the results of the ®rst calculations and studies of the SAR arc properties in magnetically conjugate hemispheres for 16±17 February 1967.
during the main phase and with the constant additional heating rate during the recovery phase of geomagnetic storm, was employed by Pavlov (1996). This approach with some modi®cation is used in our model to carry out a comprehensive study of the response of the ionosphere and the integral airglow intensities,I630, at 630 nm in the SAR arc regions to the 15±17 February 1967 geomag-netic storm.
In earlier theoretical studies, Newtonet al.(1974) and Pavlov (1989) found that deviation from a Boltzmann distribution of N2 vwas large in the SAR-arc region at vibrational energy levels v>2, and this deviation signi®cantly aected the loss rate of the O 4Sions at F2 region altitudes. The model used in this study gives an opportunity to examine the eect of a non-Boltzm-ann distribution of N2(v) on the electron densities and
temperatures in the SAR-arc regions of magnetically conjugate hemispheres with the result in the integral airglow intensities at 630 nm.
It has been suggested in a large number of modeling studies that semi-empirical models of the neutral atmo-sphere (e.g., MSIS) misrepresent true atomic oxygen and molecular nitrogen number densities and neutral tem-peratures in SAR-arc regions (Kozyraet al., 1982, 1990; Slater et al., 1987; Pavlov, 1996). In this paper we examine the sensitivity of the model results to important atmospheric parameters of the northern and southern hemispheres.
Previous calculations of O 1D number densities have assumed the formation of O 1Din the atmosphere due to production and loss reactions of O 1D, without taking into account the diusion of O 1D. An impor-tant aim of this paper is to study the role of the diusion of O 1Din the SAR arc regions.
2 Theoretical model
The mathematical model of the thermal plasma in the ionosphere and plasmasphere (the enhanced and im-proved IZMIRAN model) employed in our calculations is presented in the Appendix. This model includes the option to use models A, B, or C of the rate coecients of O 4S ions with the vibrationally excited nitrogen molecules and quenching of O 2Dby atomic oxygen described in the Appendix. In this study we employ model A and compare results with those from models B and C to evaluate the eects of the uncertainties in these rate coecients on calculated integral airglow intensities at 630 nm in the SAR-arc regions. We have no information on hmF2 and thus can use neither the method developed by Richards (1991) nor our modi®-cation of it (Pavlov and Buonsanto, 1997) to calculate an equivalent plasma drift velocity. To overcome this problem, we use the approach of Eqs. (A4±A7) de-scribed in the Appendix. In this paper we will examine the eect of the non-Boltzmann distribution of N2 v (by solving the system Eq. (A19±A20) of the Appendix) on the integral airglow intensities at 630 nm in the SAR-arc regions in comparison with the Boltzmann distribu-tion of N2 vgiven by Eq. (A23) of the Appendix.
One of the inputs for the IZMIRAN model is the additional heating rate, Prc, of the electron gas in
Eq. (A10) of the Appendix. At the present time, wave-particle interactions (Thorne and Horne, 1992; Erland-sonet al., 1993; Horne and Thorne, 1993) and Coulomb collisions between ring-current ions (Cole, 1965; Kozyra et al., 1987; Slateret al., 1987; Kozyra and Nagy, 1991; Fok et al., 1995a,b, 1993) and plasmaspheric electrons and ions are the most plausible mechanisms used to explain electron temperature enhancements and the associated SAR arcs. The present work addresses the contribution from this latter process.
The rate of energy transfer from the energetic ring-current ions to plasmaspheric electrons due to Coulomb collisions has been discussed extensively by Kozyraet al. (1987). There is no information available on the ring-current population for this storm, and we are therefore forced to assume a heating rate function. It can be found from Eq. (4) in Kozyraet al.(1987) that the value ofPrc
is proportional to NeTeÿ1=2, where Ne is the electron
number density andTeis the electron temperature of the
plasmasphere. Therefore we selected the additional heating rate as
Prc s;t f s;t C0Ne s;t Te s;tÿ1=2; 1
where f s;t 0 fors>s0 and s<ÿs0;f s;t 0 for t<t0; f s;t 1 for ÿs0<s<s0 and tt0; t is local
time; s is the distance along the magnetic ®eld line, positive in the direction north to south. The values of C0;t0;ands0 are selected so that agreement between the measured and the modeled integral air¯ow intensities at 630 nm is obtained.
3 Storm of 15±17 February 1967
The 15±17 February 1967 geomagnetic storm occurred during medium solar activity F10:7126 and 125. The period of magnetic disturbance started with a sudden commencement at 23:48 UT on 15 February. The recovery phase of this geomagnetic storm began near 14:00 UT 16 February with the index Dst ÿ130
c. The observations of the intensities (as an excess above a background nightglow level), I630, of the 630-nm oxygen emission in the SAR-arc regions were made by the OV1-10 photometer on 16 February 1967 at 16:26 UT (21:47 LT) in the northern hemisphere at geographic latitude 62.95 and geographic longitude
80 (L-shell value of the geomagnetic ®eld is 2.72,
I630645 R) and at 16:01 UT (22:15 LT) in the southern hemisphere at geographic latitude )42.37
and geographic longitude 93 L2:83;I630510 R
It seems that red arc emission is usually detected during the recovery phase of geomagnetic storms (Rees and Roble, 1975) and we believe thatt0in Eq. (1) is close to the starting time of the recovery phase. Previous work concerning the rate of energy transfer from the energetic ring-current ions to plasmaspheric electrons has as-sumed that the regionÿs0 <s<s0 was in plasmasphere above 5000 km (Pavlov, 1996). For the purposes of this paper this region is taken to be above 5000 km too and the values of C0 1480 K3=2sÿ1 and t0 13
:39 UT
(19:00 LT in the northern hemisphere at geographic latitude 62.95 and geographic longitude 80) were selected for calculations of the additional heating rate given by Eq. (1).
Figures 1±3 show the time variations of the modeled integral airglow intensities at 630 nm and the modeled
F2 peak parameters NmF2, hmF2, andTem in the SAR
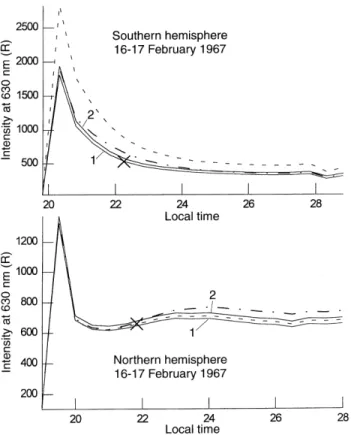
arc regions at L2:72 in the northern and southern hemispheres for the 16±17 February 1967 magnetic storm which will be explained later. Crosses shown in Fig. 1 represent the integral intensities at 630 nm in the SAR-arc regions measured by the OV1-10 photometer at 21:47 LT (northern hemisphere) and 22:15 LT (southern hemisphere) on 16 February 1967.
The excitation of atomic oxygen by thermal electrons provides the main contribution to the values of the integral intensity at 630 nm in the SAR-arc region. The rate, Pt, of O 1D formation in collision of atomic
oxygen with thermal electrons determined by Eq. (A18) of the Appendix depends onTc. Due to this dependence,
the production of O 1D increases with increasing T
e.
However, as given by Eq. (A18), the production rate decreases linearly with decreasing electron density. A
Fig. 1. The time variations of the modeled integral airglow intensities at 630 nm in the SAR-arc regions in the northern (bottom panel) and southern (top panel) hemispheres at L2:72 for the recovery phase of the 16±17 February 1967 magnetic storm.Crossesare the integral intensities at 630 nm in the SAR-arc regions measured by the OV1±10 photometer. Thesolidanddashed-dottedlines represent the integral intensities from the IZMIRAN model when the MSIS-86 atomic oxygen densities were decreased by a factor of 1.35 during the storm period in the southern hemisphere, anddashed linesare the intensities with the original MSIS-86 atomic oxygen densities. The modeled results were obtained using the Boltzmann vibrational distribution of N2 j(dashed-dotted lines) and the non-Boltzmann populations of the
®rst ®ve vibrational levels by solving the N2 j1ÿ ÿ5
time-dependent continuity equations (solidanddotted lines). Thesolid line1 and the solidand dotted lines show results when the diusion of O 1Dwas included in the IZMIRAN model, and thesolid line2 shows those without the eects of the diusion of O 1DonO 1D: The model A of the rate coecients of O 4S ions with the vibrationally excited nitrogen molecules and quenching of O 2Dby atomic oxygen was used in the IZMIRAN model
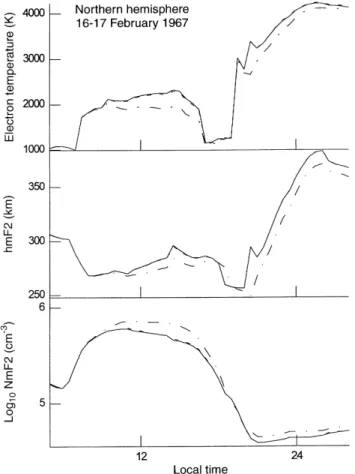
Fig. 2. The time variations of the modeled NmF2 (bottom panel), hmF2 (middle panel), and the electron temperature (top panel) at the F2 peak altitude in the SAR-arc region at L2:72 the southern hemisphere for the 16±17 February 1967 magnetic storm. Thesolid and dashed-dottedlines are hmF2 and NmF2 from the IZMIRAN model when the MSIS-86 atomic oxygen densities were decreased by a factor of 1.35 during the storm period in the southern hemisphere, and dashedlines are hmF2 and NmF2 with the original MSIS-86 atomic oxygen densities. The modeled results were obtained using the Boltzmann vibrational distribution of N2 j (dashed-dotted lines)
and the non-Boltzmann populations of the ®rst ®ve vibrational levels by solving the N2 j1±5 time-dependent continuity and energy
equations (A19, A20) (solid and dotted lines) and the model A of the rate coecients of O 4
decrease inNe, causes an increase inTe(the electron-ion
cooling rate of the thermal electrons is proportional to Ne2) and an increase inTecauses an decrease inNe (as a
result of the reactions of vibrationally excited nitrogen molecules N2 j1±5with O 4Sions shown in Table 1 in the Appendix). Therefore, the resulting dependence of Pt (and, hence, the volume emission rate, V630; and
I630) onNeandTeappears to be very complex. The main
causes of the variations of the integral intensity at 630 nm in the SAR-arc region are the variations in Ne and
Tein the region close to and above the F2 region, which
are determined by the variations in the modeled F2 peak altitude, hmF2, and density, NmF2, and the modeled electron temperature, Tem, at the F2 peak
altitude.
4 The role of non-Boltzmann distribution of vibrationally excited molecular nitrogen
The vibrational distribution of N2 at levels does not follow a Boltzmann distribution in the F region of the ionosphere (Newton et al., 1974; Torr and Torr, 1982; Pavlov, 1988, 1989; Pavlov and Namgaladze, 1988; Pavlov and Buonsanto, 1997). These deviations can aect the recombination rate of O 4S ions and the
heating rate of electrons which in¯uence the electron temperature and density and the integral airglow intensities at 630 nm in the SAR-arc regions.
The calculated fractional deviation of the N2 vibra-tional populations from a Boltzmann one, nj=njB, the
vibrational temperature, Tv of N2 j, and the neutral temperature,Tn, at the F2 peak altitude are presented in
Fig. 4 (southern hemisphere) and Fig. 5 (northern hemisphere). The present study suggests that the calcu-lated distribution is highly non-Boltzmann at vibration-al levels j>2: The deviations from the Boltzmann distribution are not signi®cant at the ®rst and second vibrational levels of N2. Decreases in nj=njB and an
increase in Tv are seen at the recovery phase, after the
beginning of the increase in Te due to the additional
heating rate of electrons. Unlike the northern hemi-sphere, the nighttime minimum values of nj=njB j1±2and the nighttime maximum value of Tv are
realized neart0at 20.19±20.49 LT on 16 February in the southern hemisphere. In the northern hemisphere the deviations nj=njB(j2±5) and the vibrational
temper-Fig. 3. The time variations of the modeled F2 peak parameters in the SAR-arc region at L2:72 the northern hemisphere for 15±17 February 1967 magnetic storm. Top: Te. Middle: hmF2. Bottom: NmF2. The curves are the same as in Fig. 1 (thedashed linesare very close to the solid lines and are not seen in the Fig. 2)
Fig. 4. The time variations of the vibrational and neutral tempera-tures and populations of the ®rst ®ve vibrational levels of N2 jin
ature have their minimum values at 19:00 LT on 16 February. From the diurnal variations of the calculated vibrational (solid line) and neutral (dashed line) tem-peratures shown in Figs. 4 and 5, it follows thatTv<Tn
in the atmosphere during the night without the addi-tional heating rate of electrons where the production frequency of N2 j is low [details are given by Pavlov (1994)]. This means that for these periods the popula-tions of N2 j are less than the populations for a Boltzmann distribution with temperature Tn: In the
SAR-arc regionsTvis larger thanTndue to the enhanced
thermal excitation of N2 as a result of high thermal electron temperatures at F2-region altitudes, but this dierence betweenTv andTn is not more than 712 K in
the either hemisphere.
The modeled results shown in Figs. 1±3 were ob-tained from the IZMIRAN model using the Boltzmann vibrational distribution of N2 j (dashed-dotted lines) by solving the time-dependent energy equation, Eq. (A20), for the vibrational quanta of N2 jand the non-Boltzmann populations of the ®rst ®ve vibrational levels of N2 j (solid and dotted lines) by solving the N2 j1±5 time-dependent continuity and energy equations, Eqs. (A19±A20).
Figure 1 shows that the use of the non-Boltzmann vibrational distribution of N2 and the choice of C01480 K3=2 sÿ1 in Eq. (1) brings the measured and modeled integral intensity at 630 nm into agreement only in the northern hemisphere. It seems likely that the intensity discrepancy between the measured and modeled I630 of the southern hemisphere (the disagreement between the dotted lines and the cross at the top panel of Fig. 1) is caused by inaccuracies in key inputs such as the composition and temperature of the neutral atmo-sphere (the MSIS-86 model does not accurately predict the neutral atmosphere during a magnetic storm). We found that the integral intensity at 630 nm of the SAR arc region is much more sensitive to the variations in the oxygen number densities than the number densities of N2, O2and the neutral temperature. Solid lines in Fig. 1 show the model results when the MSIS-86 neutral atomic oxygen density of the southern hemisphere was decreased by the factor of 1.35 at all altitudes during the geomag-netic storm period. No adjustments were made to the [O] values before a sudden storm commencement at 23:48 UT on 15 February. This MSIS-86 correction is enough to reproduce very well the observedI630on 16 February. It can be seen from the comparison between the solid line (marked 1) and the dashed-dotted lines of Fig. 1 and those of Figs. 2 and 3, that in the SAR-arc regions the non-Boltzmann distribution assumption leads to the decrease in the calculated NmF2 up to a factor of 1.2± 1.4 and brings about reductions by factors of 1.1±1.2 in the integral intensity at 630 nm in comparison with NmF2 and the integral intensity calculated using the Boltzmann vibrational distribution of N2.
From our calculations it follows that the use of the Boltzmann vibrational distribution of N2 gives good agreement between measured and modeled I630 of the northern hemisphere if we choose the value of C01450 K3=2sÿ1 in Eq. (1). However, in order to reproduce the observed I630 of the southern hemisphere it is necessary to decrease by a factor of 1.55 the MSIS-86 neutral atomic oxygen density in the southern hemisphere at all altitudes during the geomagnetic storm period. Therefore, the use of the non-Boltzmann distribution assumption improves the agreement be-tween the data and the theoretical results giving lower the ratio of the southern-hemisphere intensity to the northern-hemisphere intensity in comparison with the Boltzmann distribution assumption.
5 Eects of the O 1Ddiusion and the uncertainities in the rate coecients of O 4Sand O 2Dions on the integral intensity at 630 nm
We use one of the important changes of the IZMIRAN model given in the Appendix to take into account the eect of the O 1Ddiusion on the volume emission and the integral intensity at 630 nm. To model these eects on O1 D, the diusion term in the O 1D continuity Eq. (A24) of the IZMIRAN model was added.
Figure 6 shows calculated altitude pro®les of volume emission rate at 630 nm for the 16 February 1971
Fig. 5. The time variations of the vibrational and neutral tempera-tures and populations of the ®rst ®ve vibrational levels of N2 in
magnetic storm within the SAR-arc regions at L2:72 in the northern (left panel) and southern (right panel) hemispheres at 21:47 LT and 22:15 LT on 16 February 1967 when the measurements of I630 were made by the OV1-10 photometer. In Figs. 1 and 6 the solid lines marked by 1 show the results when we use in the IZMIRAN model the O 1Dcontinuity Eq. (A24) with the diusion term, whereas the solid lines marked 2 were obtained without the diusion of O 1D. It can been seen from the comparison of lines 1 and 2 that the eect of including the O 1Ddiusion results in a decrease of 4±6% in the calculated integral intensity of the northern hemisphere and of 7±13% in the calculated integral intensity of the southern hemisphere. These changes in the integral intensities are caused by volume emission rate changes. Figure 6 shows that the eect of using the O 1Ddiusion in the IZMIRAN model results in a 20± 26-km decrease in the modeled peak altitude of the volume emission rate.
The updated IZMIRAN model includes the option to use models A, B, or C of the rate coecients of O 4S
ions with the vibrationally excited nitrogen molecules and quenching of O 3Dby atomic oxygen described in the Appendix. The results shown in Figs. 1±6 were obtained using model A. Figure 7 shows the time variations of the modeled integral airglow intensities at 630 nm from models A (solid lines), B (dashed lines), and C (dashed-dotted lines) in the SAR-arc regions at L2:72 in the northern (bottom panel) and southern (top panel) hemispheres for the 16±17 February 1967 magnetic storm. Crosses shown in Fig. 7 represent the integral intensities at 630 nm in the SAR-arc regions measured by the OVI-10 photometer. The used values of C0, t0, and s0 in Eq. (1) were the same as for results shown in Figs. 1±6 and the MSIS-86 neutral atomic oxygen density of the southern hemisphere was dec-reased by the factor of 1.35 in models A, B, and C at all altitudes during the geomagnetic storm period.
The modeled Ne, Te, and I630 are sensitive to the
assumed values of the rate coecients of O 4S ions with the vibrationally excited nitrogen molecules and
Fig. 6. Computed altitude pro®les of volume emission rate at 630 nm for 16 February 1971 magnetic storm within the SAR arc regions at L2:72 in the northern (left panel) and southern (right panel) hemi-spheres at 2147 and 2215 LT. The curves are the same as in Fig. 1
Fig. 7. The time variations of the modeled integral intensities at 630 nm in the SAR-arc regions in the northern (bottom panel) and southern (top panel) hemispheres at L2:72 for the recovery phase of the 16±17 February 1967 magnetic storm.Crossesrepresent the integral intensities at 630 nm in the SAR-arc regions measured by the OV1±10 photometer at 21:47 LT (northern hemisphere) and 22:15 LT (southern hemisphere) on 16 February 1967. Thesolid, dashedand dashed-dottedlines are the calculated integral intensities from model A, B, and C of the rate coecients of O 4S ions with the vibrationally excited nitrogen molecules and quenching of O 2Dby atomic oxygen described in the Appendix. The modeled results were obtained using the non-Boltzmann populations of the ®rst ®ve vibrational levels by solving the N2 j1±5 time-dependent
quenching of O 2D by atomic oxygen. The modeled Neare larger in model B than in model A, and in model
C than in model B in the SAR-arc regions (at altitudes close and above the F2 region). As a result, the modeled I630 increases in the SAR-arc regions by 1±15% (north-ern hemisphere) and 10±21% (south(north-ern hemisphere) in model B, and by a factor 1.1±1.4 (northern hemisphere) and 1.2±1.65 (southern hemisphere) in model C, in comparison with model A.
6 Conclusions
This paper presented a comparison between measured and calculated integral airglow intensities at 630 nm in the SAR-arc regions of the northern and southern hemispheres, corresponding to the time-period of the 15±17 February 1967 magnetic storm. The model used is an enhanced and updated version of the IZMIRAN model that has been steadily developed over the years. This time-dependent mathematical model of the Earth's ionosphere and plasmasphere includes interhemispheric coupling, the H, O 4S, He, O 2D, O 2P, NO, O2, and N2 ions, electrons, photoelectrons, the electron and ion temperatures, vibrationally excited nitrogen molecules, the components of thermospheric wind, O 1D atoms and the MSIS-86 neutral atmosphere model. The major enhancements to the IZMIRAN model added for this study are the inclusion of the He ions (three major ions: O, H, and He and three ion temperature), the updated photochemistry and energy balance equations for ions and electrons, the diusion of NO and O2 ions and O 1D and the revised electron cooling rates arising from their collisions with unexcited N2;O2 molecules and N2 molecules at the the ®rst vibrational level. The updated model includes the option to use the models of the Boltzmann or non-Boltzmann distributions of vibrationally excited molecular nitrogen. In order to model the electron temperature, the additional heating rate of the electron gas providing the heat ¯ux to the SAR-arc region was added in the energy balance equation at the altitude above 5000 km during the recovery phase of the geomagnetic storm.
The deviations from the Boltzmann distribution for the ®rst ®ve vibrational levels of N2were calculated. The present study suggests that the calculated distribution is highly non-Boltzmann at the vibrational levelsj>2 and the deviations from the Boltzmann distribution are not signi®cant at the ®rst and second vibrational levels of N2. It was found that the non-Boltzmann distribution assumption leads to the decrease in the calculated NmF2 up to a factor of 1.2±1.4 and brings about factors of 1.1± 1.2 reductions in the integral intensity at 630 nm in comparison with NmF2 and the integral intensity calculated using the Boltzmann vibrational distribution of N2. The MSIS-86 oxygen number densities of the southern hemisphere were decreased by a factor of 1.35 at all altitudes for the storm period 15±17 February in order to decrease the modeled integral intensity to match observations better. The preceding results indi-cate that the use of the non-Boltzmann distribution
assumption improves the agreement between the data and the theoretical results decreasing the ratio of the calculated southern-hemisphere intensity to the north-ern-hemisphere intensity.
The enhanced IZMIRAN model used for this study takes into account the eect of the O 1D diusion on the volume emission and the integral intensity at 630 nm. We found that in the SAR-arc region the inclusion O 1D diusion results in a 20±26-km de-crease in the modeled peak altitude of volume emission rate, in a decrease of 4±6% in the calculated integral intensity of the northern hemisphere and 7±13% in the calculated integral intensity of the southern hemisphere. The modeled intensities of the southern hemisphere are more sensitive to the assumed values of the rate coecients of O 4S ions with the vibrationally excited nitrogen molecules and quenching of O 2D
by atomic oxygen than the modeled intensities of the northern hemisphere.
Acknowledgements. The research described in this publication was supported by grant 96-05-64031 from the Russian Foundation of the Fundamental Researches.
Topical Editor D. Alcayde thanks A. Nagy and D. Slaver for their help in evaluating this paper.
Appendix IZMIRAN model description
The model used is an enhanced and updated version of one that we have steadily developed over the years (Pavlov, 1991, 1994, 1996; Pavlov and Buonsanto, 1997). In the model, coupled time-dependent equations of continuity, momentum, and energy balance for O 4S;H, and He ions, and electrons are solved along a centered-dipole magnetic ®eld line for the concentrations, ®eld-aligned diusion velocities, and temperatures of ions and electrons from a base altitude (160 km) in the northern hemisphere through the plasmasphere to the same base altitude in the southern hemisphere. In the northern and southern hemispheres the model solves time-dependent continuity equations for O 2D;O 2P;NO;O2;N2, vibrationally excited molecular nitrogen, N2 v, at the ®rst ®ve vibrational levels v1±5, and the momentum equations for the horizontal components of thermospheric wind within the altitude range 120±700 km and the time-dependent continuity equation for O 1Din the region between 120 and 1500 km in altitude.
Ion continuity equations
The ion continuity equations for the three major ions, O 4S;H, and He and for the minor ions, O 2D;O 2P;NO;O2, and N2 are given by
@ @tNjB
@ @sCiNjB
ÿ1Q
jDQjPjÿLj; A1
where Nj is the ion concentration,Bis the geomagnetic
®eld,tis the local time,sis the distance along the magnetic ®eld line, positive in the direction north to south,PjandLj
production rates of ions by photoionization and due to photoelectrons,CjVjW;Vjis the ®eld-aligned
diu-sion velocity,Wis the ®eld-aligned wind-induced plasma drift velocity. In our model we neglect theCjeects on the
O 2D;O 2P, and N2 ion concentrations.
In the present model, the solar EUV ¯uxes, U/ k, are obtained from the EUVAC model (Richards et al., 1994) or EUV94X model (Tobiska, 1993, 1994). The reactions of photoionization and the ionization due to photoelectrons of the neutral species, N2;O2;O, and He
are included in the model. We use Eqs. (A3) and (A5) in Pavlov (1994) to calculate Qj and DQj. The revised
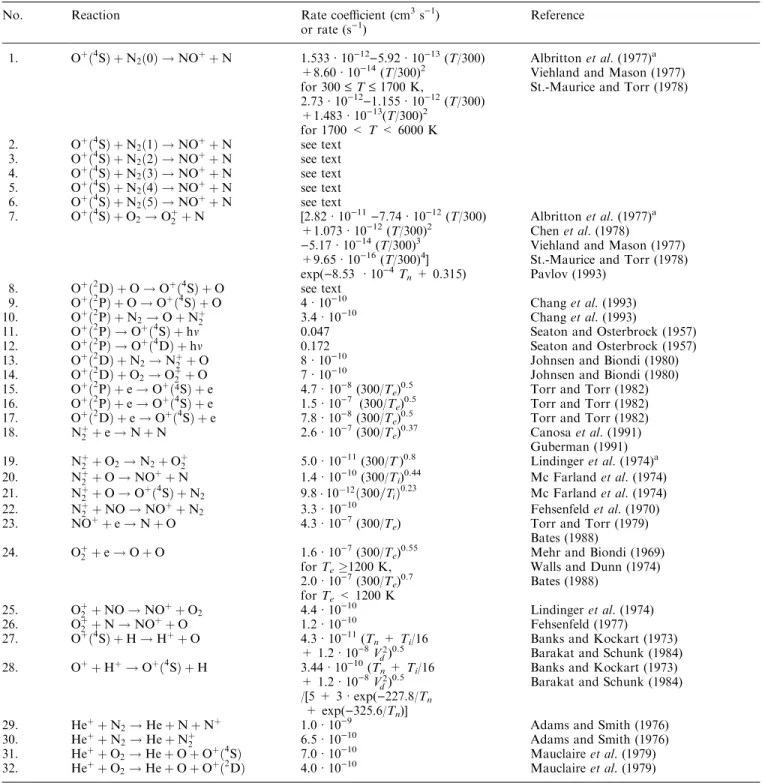
photoionization and photoabsorption cross sections are taken from Richardset al.(1994); these authors did not publish the photoionization cross section for He, and for these we have used values from Torr and Torr (1982). The Chapman function approximation is taken from Smith and Smith (1972). The model results are sensitive in the key rate coecientsK2±K6, andK8of the reactions 2±6 and 8 presented in Table 1.
Table 1. Chemistry of ions (aThe eective temperature
T miTnmnTi= mimn mimnVd23k mimnÿ1 where Vdis plasma drift
velocity)
No. Reaction Rate coecient (cm3s)1)
or rate (s)1)
Reference
1. O 4S N2 0 !NON 1.533á10)12)5.92á10)13(T/300) Albrittonet al.(1977)a
+8.60á10)14(T/300)2 Viehland and Mason (1977) for 300£T£1700 K, St.-Maurice and Torr (1978)
2.73á10)12)1.155á10)12(T/300) +1.483á10)13(T/300)2
for 1700 <T< 6000 K
2. O 4S N2 1 !NON see text
3. O 4S N2 2 !NON see text
4. O 4S N2 3 !NON see text
5. O 4S N2 4 !NON see text
6. O 4S N2 5 !NON see text
7. O 4S O2!O2 N [2.82á10)11)7.74á10)12(T/300) Albrittonet al.(1977)a +1.073á10)12(T/300)2 Chenet al.(1978)
)5.17á10)14(T/300)3 Viehland and Mason (1977) +9.65á10)16(T/300)4] St.-Maurice and Torr (1978) exp()8.53 á10)4Tn+ 0.315) Pavlov (1993)
8. O 2D O!O 4S O see text 9. O 2
P O!O 4
S O 4á10)10 Changet al.(1993)
10. O 2P N2!ON2 3.4á10)10 Changet al.(1993)
11. O 2P !O 4S hm 0.047 Seaton and Osterbrock (1957)
12. O 2P !O 4D hm 0.172 Seaton and Osterbrock (1957)
13. O 2D N2!N2 O 8á10)10 Johnsen and Biondi (1980)
14. O 2D O2!O2 O 7á10)10 Johnsen and Biondi (1980)
15. O 2P e!O 4S e 4.7
á10)8(300/Te)0.5 Torr and Torr (1982)
16. O 2P e!O 4S e 1.5á10)7 (300/Te)0.5 Torr and Torr (1982)
17. O 2D e!O 4S e 7.8á10)8(300/Te)0.5 Torr and Torr (1982)
18. N2 e!NN 2.6á10)7(300/Te)0.37 Canosaet al.(1991)
Guberman (1991) 19. N2 O2!N2O2 5.0á10)11(300/T)0.8 Lindingeret al.(1974)a 20. N2 O!NON 1.4á10)10(300/Ti)0.44 Mc Farlandet al.(1974)
21. N2 O!O 4
S N2 9:810ÿ12 300=Ti0:23 Mc Farlandet al.(1974)
22. N2 NO!NON2 3.3á10)10 Fehsenfeldet al.(1970)
23. NOe!NO 4.3á10)7(300/Te) Torr and Torr (1979)
Bates (1988)
24. O2 e!OO 1.6á10)7(300/Te)0.55 Mehr and Biondi (1969)
forTe1200 K, Walls and Dunn (1974)
2.0á10)7(300/Te)0.7 Bates (1988)
forTe< 1200 K
25. O2 NO!NOO2 4.4á10)10 Lindingeret al.(1974)
26. O2 N!NOO 1.2á10)10 Fehsenfeld (1977)
27. O 4S H!HO 4.3
á10)11(Tn+Ti/16 Banks and Kockart (1973)
+ 1.2á10)8Vd2) 0.5
Barakat and Schunk (1984) 28. OH!O 4S H 3.44á10)10(Tn+Ti/16 Banks and Kockart (1973)
+ 1.2á10)8Vd2) 0.5
Barakat and Schunk (1984) /[5 + 3áexp()227.8/Tn
+ exp()325.6/Tn)]
29. HeN2!HeNN 1.0á10)9 Adams and Smith (1976)
30. HeN2!HeN2 6.5á10)
10
Adams and Smith (1976)
31. HeO
2!HeOO 4S 7.0á10)10 Mauclaireet al.(1979) 32. HeO2!HeOO
2
The recombination rate coecients of O 4S ions with N2 v>0 were measured by Schmeltekopf et al. (1968) and Ferguson et al. (1984) forTnTi300 K:
Van Zandt and O'Malley (1973) determined the depen-dence of these rate coecients on the neutral temper-ature by using the results of Schmeltekopf et al.(1968) and a simple theoretical model of these reactions. Pavlov (1988) enlarged the use of this approach by taking into account the dependence of these rate coecients on the eective temperature, and changed the rate coecient of O 4S ions with N2(0) given by Van Zandt and O'Malley (1973) to the rate coecientK1 of Table 1.
The rate coecient for the quenching of O 2D by atomic oxygen has not been measured and was assumed to be 10ÿ10cm3sÿ1 (Oppenheimeret al.,1977; Fox and Dalgarno, 1985) and 510ÿ12cm3sÿ1 (Abdou et al., 1984). These rate coecients were obtained from agree-ment between the measured and model densities of N2 and the dierent points of view were discussed by Torr and Torr (1982), Abdou et al.(1984), Ferguson (1984), and Fox and Dalgarno (1985).
Our model of the thermal plasma in the ionosphere and plasmasphere includes the option to use three sets for models of these rate coecients. In model A the rate coecient Ks10ÿ10cm3sÿ1 and the rate coecients K2±K6 are determined by the equations given by Pavlov (1988) and Pavlov and Namgaladze (1988). This approach was used in the IZMIRAN model (Pavlov, 1994, 1996; Pavlov and Buonsanto, 1997). Model B uses K85:10ÿ12 cm3sÿ1 and the recombination rate coef-®cients of O 4S ions with N2 v>0 measured by Schmeltekopf et al. (1968) for TnTi300K: K2
1:310ÿ12cm3sÿ1, K35:010ÿ11cm3sÿ1; K4 1:2 10ÿ10cm3sÿ1; K52:6 10ÿ10cm3sÿ1; K6 3:610ÿ10
cm3sÿ1: In model C the rate coecient K
8 5:0 10ÿ12cm3sÿ1 and the ratios of the recombination rate coecients of O 4S ions with N2 v>0 to the rate coecients of O 4S ions with N2(0) are the same as measured by Schmeltekopf et al. (1968) for TnTi300K: K2 T=K1 T 1; K3 T=K1 T 38; K4 T=K1 T 85; K5 T=K1 T 220; K6 T=K1 T
270:The model C assumes that the temperature depen-dence of these reactions rates are the same as for unexcited N2, i.e., are as given by St. Maurice and Torr (1978). This approach was used in the FILP model (Torret al.,1990)
Transport formulation
The momentum equations for determination of the ion ®eld-aligned velocities were formulated by Conrad and Schunk (1979). In updated ``low-speed'' model the nonlinear acceleration terms and stress tensor diver-gences are neglected and the ion diusion velocities are calculated by solving the system equations
X
j
mij 1ÿDij VjÿVi ÿViX
n
min 1ÿDin A2
@
@spiNiN
ÿ1
e @
@sPemi Ni gpici
@ @slnTi
mi Niÿ1;
where Ne is the electron concentration, pekNeTe;
PikNiTi;kis Boltzmann's coecient,Teis the electron
temperature, Ti is the i-th ion temperature, mi denotes
the mass of the ith ion, mij and min are the collision
frequencies for momentum transfer between ions and between ion and neutral, the thermal diusion coe-cientsci and the correction factorsDijandDin are given
by Conrad and Schunk (1979), gsinI
g0 Lÿ2sinÿ4hÿ1:5X2L REsin4h; LrRÿE1sinÿ 2
h is the McIlwain parameter, X7:310ÿ5sÿ1; g0980 cm sÿ2;rdenotes radial distance from the Earth's center,
h is the geomagnetic colatitude, Iis the magnetic ®eld dip angle, sinI 2 cosh 13 cos2hÿ0:5.
The wind-induced plasma drift velocity
WdUhcosI; A3
where Uh is the component of thermospheric wind in spherical polar coordinates r;h;/;/is the geomagne-tic longitude.
For determination of the value of Uh it is necessary to solve the system of momentum Eqs. (A13 , A14) given by Pavlov (1994). The large uncertainities in the calculated Uh lead to large errors in the modeled electron densities and peak height altitude, hmF2, of the F2-layer (Richards, 1991; Pavlov, 1994). This problem was largely overcome when Richards (1991) developed a technique for deriving equivalent neutral winds from the observed hmF2. Ideally, the observed hmF2 should be available for several hours before the time of the comparison, but very often only a limited set of hmF2 measurements is available or we have not got the observed hmF2 and thus cannot use the method developed by Richards (1991) or our modi®cation of this method (Pavlov and Buonsanto, 1997) to calculate an equivalent plasma drift velocity. To overcome this problem, we can try to use hmF2IRIgiven by the IRI-90 model (Bilitza, 1990) to calculate an equivalent plasma drift velocity, WIRI, for some hypothetical undisturbed conditions with the same solar and time conditions as during the studied conditions:
WIRI tDt [hmF2IRI tDt
ÿhmF2 tb tÿ1WIRI t; A4
b t 1:7610ÿ5Tn TiTeÿ10:46
Tnmin2=3L Oÿ1=3; A5
where hmF2(t) andWIRI tare the calculated heights of the F2 layer and the equivalent drift velocity of the plasma at timet,L Ois the recombination rate of the O 4Sions, the values of Tn;Te;Ti;min; and L O are
given at 300-km altitude (the dependence of b on altitude is small at the F-region altitudes because of
b t fO2Lÿ1g1=3).
After that we calculate the wind-induced plasma drift velocities
WqUh (quiet) cosI; WmUh (modeled) cosI;
where Uh (quiet) and Uh (modeled) are the horizontal components of the thermospheric wind for hypothetical quiet and real studied conditions obtained by solving the two momentum Eqs. (A13, A14) of Pavlov (1994) for these conditions.
Finally, in the northern and southern hemispheres the plasma drift velocities in the ion continuity equa-tions are given by Pavlov (1996) as
Wd WmÿWqWIRI: A7
Such an approach allows us to avoid some serious errors in the calculations of electron density during magnetic storms (Pavlov and Buonsanto, 1997). During quiet conditions the modeled hmF2 are very close to hmF2IRI. If we have the observed peak height alti-tude, hmF2exp, of the F2-layer in the northern or southern hemispheres then the algorithm developed by Richards (1991) with our modi®cation (Pavlov and Buonsanto, 1997) is used to calculate Wd for this
hemisphere
Wd tDt hmF2exp tDt ÿhmF tb tÿ1Wd t; A8
where hmf tandWd tare the calculated heights of the
F2 layer and the equivalent drift velocity of the plasma at timet;b tis determined by Eq. (A5).
Energy balance equations for ions and electrons
The energy balance equations for ions and electrons
1:5@
@tTiB kNi
ÿ1 @
@ski B
ÿ1 @
@sTiÿTiB
@ @sCiB
ÿ1
ÿ1:5Ci @
@sTimie TeÿTi
3mi X
j
mij mimjÿ1 TjÿTi (
TnÿTi X
n
min mimnÿ1 )
mikÿ1Vd2 X
n
min mn mimnÿ1; A9
1:5kNe @ @tTeB
@ @skeB
ÿ1 @
@sTe
PePrcÿ X
l
Lel; A10
where Vd2W2 cE?Bÿ12f1xÿi2 P
n
min2gÿ1; xi is
the ion cyclotron frequency, E? is the perpendicular
component of the electric ®eld with respect to the geomagnetic ®eld,cis the speed of light,kiandkeare the
thermal conductivities of ions and electrons, Lel is the
electron cooling rate in the process ``l'',Peis the heating
rate of the electron gas by photoelectrons; to calculate Pe(s) along a centered-dipole magnetic ®eld line the
numerical method of Krinberg and Tachilin (1984) for the determination of the photoelectron ¯uxes within a
plasmaspheric ®eld tube was used on the same ®eld line grid that is used in solving for the densities and temperatures; Prc is the additional heating rate of the
electron gas due to Coulomb collisions between ring-current ions and plasmaspheric electrons and wave-electron interactions.
To calculate the electron thermal conductivity coef-®cient we use the new mixture rule given by Pavlov (1996). The expressions used for ki, mei, mij, andLel are
given by Bailey and Sellec (1990). For the electron cooling rate, Lel N2, arising from their collisions with N2 molecules, with the excitation of vibrational levels v1±5 of N2(0) and v2±5 of N2(1), and the N
2 de-excitation eect, the revised expression was used
Lel N2 E1X 5
v1
vI0vfN2 0 ÿ N2 vexp vE1Teÿ1g
E1X 5
v2
vÿ1I1vfN2 1 ÿ N2 vexp vÿ1E1Teÿ1g;
A11
where
I0vNef8k Te p meÿ1g0:5 Z1
0
r0v xxexp ÿxdx;
A12
I1vNef8k Te p meÿ1g0:5 Z1
0
r1v xxexp ÿxdx;
A13
and where xE kTeÿ1 , E is electron energy E13353 K is the energy of the ®rst level of N2 given by Radzig and Smirnov (1980), r0v E are the partial cross sections for excitation of N2 0 by electrons,
r1v E are the partial cross sections for excitation of
N2(l) by electrons.
The results presented in this paper were obtained using r01 E complied by Itikawa et al. (1986) for the region of electron energy from 0.3 to 1.8 eV. We used
r0v E recommended by Schulz (1976) for E>1:8 eV
with the normalization factor of 0.7 given by Haddad (1984) and the absolute value of r01 E 4:4510ÿ16 cm2atE2 eV:The partial cross sections for excitation of N2 (1) to N2 v>1by electrons calculated by Dube and Herzenberg (1979) forv2±4 were adjusted to give the best ®t of the calculatedr01 Ealso from Dube and Herzenberg (1979), to the measuredr01 E. The values of r1v E calculated by Chen (1964) for v5 were modi®ed by taking into account the new values ofr0v E.
For the electron cooling rate, Le1 O2, arising from collisions of electrons with unexcited O2molecules with the excitation of vibrational levelsv1±4 of O2 (0) and the O2 de-excitation eect revised expression was used Lel O2 E10Ne
X4
v1
vJvfO2 0 ÿ O2 vexp vE10Tÿ 1
e g;
where Jv f8kTe p meÿ1g0:5 R1
0 X0v xxexp ÿxdx; x E kTeÿ1;E is an energy of electrons,E012239 K is the energy of the ®rst level of O2 given by Radzig and Smirnov (1980), X0v E are partial cross sections for excitation of O2 0by electron impact.
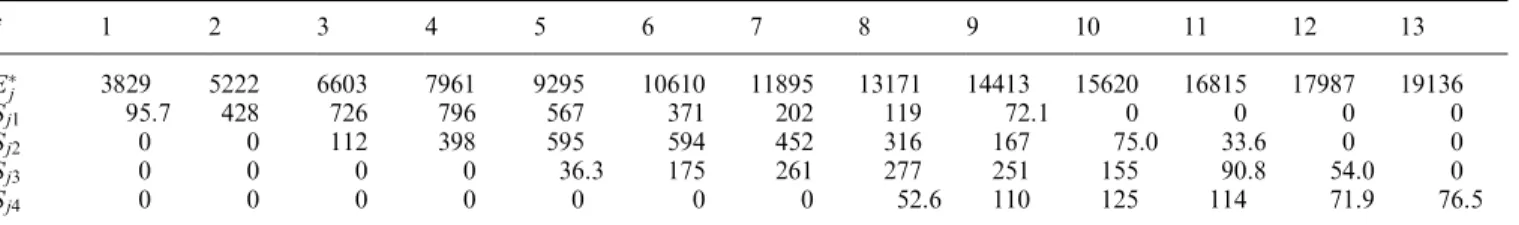
The vibrational-excitation cross sections of O2(0), as a function of impact energy, exhibit very sharp and narrow spikes (Schulz, 1976). The use of the measured integral vibrational-excitation cross sections in these narrow spikes given by Schulz (1976) leads to the new electron cooling rate due to O2:
Lel O2 1:6110ÿ4NeTeÿ1:5 X4
v1
fO2 0 ÿ O2 v
exp vE01Teÿ1gX
13
j1
Sjv exp ÿEjTÿ
1
e ; A15
where the values ofSjvandEj are given in Table 2, the
units ofO2 0;O2 vandNeare cmÿ3, the units ofTe
are K, the units of Lel O2are K cmÿ3sÿ1.
To calculate the number densities of O2 v we use a Boltzmann distribution with the vibrational temperature Tv O2 Tn
O2 v O2 0exp ÿvE10Tnÿ1 A16
From Eq. (A16) it may similarly be shown that the sum of the vibrationally unexcited and excited molecular oxygen concentrations O2 O2 0 f1ÿexp
ÿE01Tÿ1
n g. There is no possibility to dierentiate the
vibrationally unexcited O2from the vibrationally excited O2 during the mass-spectrometer measurements of the neutral species in the atmosphere, and we therefore believe that the MSIS-86 neutral model (Hedin, 1987) used in our model calculates the value of O2. The dierence between O2 and O2 0 is not negligible during solar maximum. For example O2=O2 0
1:29 forTn1500 K.
We use the revised cooling rate in collision of O 3P
with thermal electrons
Lel O 1D E0Pt; A17
where the rate of O 1Dformation in collision of O 3P
with thermal electrons is calculated as (Pavlov, 1990, 1996)
PtCNefO ÿ1:8O 1D exp XgX0:5
1a1X ÿa2X2 b1b2X X2ÿ1exp ÿX; A18
X E0Teÿ1;E0 22861 K;C2:7210ÿ8cm3 sÿ1;a1
7:803510ÿ2; a2 3:453410ÿ3; b11:6882; b2
3:331; the units of [O], O 1D, and Ne are cmÿ3 , the
units of Te are K, the units of Lel O 1D are K
cmÿ3 sÿ1.
The loss rate of the O 4S ions and Lel N2 are functions of number densities, nj, of vibrationally
excited molecular nitrogen N2 j. The model includes the option to use the models of the Boltzmann and non-Boltzmann distributions of vibrationally excited molec-ular nitrogen.
Continuity and energy equations for the vibrationally excited nitrogen molecules
Pavlov (1988, 1989) treated the vibrationally excited nitrogen molecules as a set of harmonic and anharmonic oscillator energy levels. The Pavlov (1989) study sug-gests that the eect of anharmonicity on nj is small at
the energy levels j1±5. Therefore our model uses the system of equations given by Pavlov (1988) and Pavlov and Namgaladze (1988) to determinenj j1±5using
the harmonic oscillator energy level approximation, the vibrational-vibrational and vibrational-translational en-ergy exchange of N2 j, the diusion of N2 j in the mixture of N2 0, O2, and O, the production rates, Qj,
of N2 jas follows:
@ @tnj
@ @zFj N
2 f j1nj1ÿ j1Hjnj
jHnjÿ1gsÿ1
vt f j1 1anj1 ÿ j1aj 1anjjanjÿ1gsÿvv1Qj;
A19
@ @taÿ
1 n
@ @zDn
@ @za
1 n
X
j
jQjÿ aÿ
H
1ÿH
sÿvt1
ÿaKmCO2; A20
where Fj N2 ÿD@
@znjnj
1
H
1
Tn
@
@zTn; n P
j
nj; a
1
n P
j
jnj;Hexp ÿE1Tÿ1
n ;sÿvt1 fK 1
vt O K
2 vt O2g
1ÿH;sÿ1
vv Kvvn;H kTn m gÿ1; D is the diusion
coecient of the vibrationally excited nitrogen mole-cules,mdenotes the mass of N2, g is the acceleration due to gravity, E13353 K, the rate coecients of the vibrational-translational energy exchange N2 j1±O is measured by McNeal et al. (1974) and can be approximated as Kvt 11:0710ÿ10 exp ÿ69:9Tnÿ1=3
cm3sÿ1by use of the theory of this energy exchange, the rate coecients of the vibrational-translational energy
Table 2. Coecients for calculations of the electron cooling rate due to O2
j 1 2 3 4 5 6 7 8 9 10 11 12 13
E
j 3829 5222 6603 7961 9295 10610 11895 13171 14413 15620 16815 17987 19136
Sj1 95.7 428 726 796 567 371 202 119 72.1 0 0 0 0
Sj2 0 0 112 398 595 594 452 316 167 75.0 33.6 0 0
Sj3 0 0 0 0 36.3 175 261 277 251 155 90.8 54.0 0
exchange N2 j1±O2is given by Gilmoreet al.(1969) as Kvt 23:610ÿ12T0:5
n exp ÿ110Tnÿ1=3 cm3sÿ1, for
the vibrational-vibrational energy exchange ofN2 j1
with CO2 Taylor (1974) presented Km1:710ÿ6
exp ÿ175Tnÿ1=3 6:210ÿ14 exp ÿ15:13 Tÿ1=3
n cm3
sÿ1, the rate coecients of the vibrational-vibrational energy exchange of N2 j1 with N2 j0 is
mea-sured by Suchkov and Schebeko (1981) as
Kvv5:210ÿ10Tnÿ3=2cm3 sÿ1:
It is required to know the value ofn6to calculate the value of n5 from Eqs. (A19, A20), and the condition n60 was assumed. The diusion coecients of vibra-tionally excited molecules are not sensitive to the number of energy level (Fujimoto et al.,1976) and we can use
DYfO D N2;Oÿ1 N2 D N2;N2ÿ1
O2 D N2;O2ÿ1gÿ1; A21 where Y O N2 O2; the binary diusion coef-®cients of the unexcited N2 molecules (Pavlov, 1981; Pavlov and Namgaladze, 1988) D N2;O 9:691016
Tn0:774Yÿ1;D N2;N2 9:761016 Tn0:69 Yÿ1;D N2; O2 8:291016Tn0:724Yÿ1; the units of O;O2 and
N2are cmÿ3 and the units ofDare cmÿ3sÿ1. The production rates of N2 jare given as
QjI0jfn0ÿnj exp jE1Teÿ1g
I1jfn1ÿnj exp jÿ1E1Teÿ1g Qj1Qj2; A22 where the ®rst two terms describe the thermal electron excitation of N2 0 and N2 1 and the deexcitation of N2 j, the values ofI0j and I1j are determined by Eqs.
(A12 and A13), Qj1and Qj2are the N2 jproduction rates in the reactions O 1Dwith N2 0and N 4Swith NO.
The rate coecients, cj, of the reactions O 1D N2 0 !ON2 j are not measured. Streit et al. (1976) reported that the measured rate coecient
cP
jcj. Tully (1974) developed a classic collision
complex model to describe production of N2 jin these reactions. This theoretical approach de®nes cRE
0 K EdE, whereE is the critical energy of the potential surface intersection of N2O with separated O 3P
N2;K E is a partial rate constat for formation of N2 j vibrational energy betweenE andEdE calcu-lated by Tully (1974) for E 1:18 and 1.97 eV.
The predicted value ofcgiven by Tully (1974) agrees with the experimental results of Streit et al. (1976). Although there is considerable uncertainty in the theo-retical results, they suggest that the amount of energy channeled into N2 vibration can be an average of 30 10% of the 1.97-eV exothermicity of quenching. This is in excellent agreement with the measurements of Slanger and Black (1974) who concluded that an average of 33
10% of the 1.97-eV electronic energy of O 1Dconverts into N2 vibrational energy.
Using K E we calculate the branching ratios as cj
c
REj
Ejÿ1K(E)dE
RE
0 K EdE
ÿ1
, whereEjis the energy
of thej-th vibrational level of N2 j. Our model use the values of cj
c0:293; 0.253, 0.212, 0.159, 0.083 for j1±5 and cj
c0 for j>5, the measured rate
coei-cient cgiven by Streit et al. (1976) and the production rate of N2 j in the reaction O 1D with N2 0 as Qj1 cjO
1
Dn0. For these values of cj
c an average of 36% of the 1.97-eV electronic energy of O 1Dconverts into N2 vibrational energy, in excellent agreement with the measurements of Slanger and Black (1974).
The vibrationally excited nitrogen molecules may be also produced in the reactions N 4Swith NO with the rate Qj2ejbN 4SNO, whereb3:410ÿ11cm3sÿ1
(Lee et al., 1978), ej is the probability vibrational
distribution given by Phillips and Schi (1962).
Solving the system Eqs. (A19), (A20) the model can calculate the number densities of vibrational excited molecular nitrogen determining the real non-Boltzmann distribution of N2 j:The model includes the option to use the model of the Boltzmann distributions of vibrationally excited molecular nitrogen
njnjBn0Ba 1aÿ1jn0Bexp ÿjE1Tvÿ1 ; A23
whereTvis the vibrational temperature and the value of
a is calculated from Eq. (A20). In this case from Eq. (A23) it may be similarly be shown that the sum of the vibrationally unexcited and excited molecular nitro-gen concentrations N2 nn0B 1a. There is no
possibility to dierentiate the vibrationally unexcited N2 from the vibrationally excited N2 during the mass-spectrometer measurements of the neutral species in the atmosphere, and therefore we believe that the MSIS-86 model calculates the value of N2. The dierence between N2 and n0B is not negligible during solar
maximum conditions. For example N2=n0B1:12 for
Tv1500 K.
Continuity equation forO 1D
We calculateO 1Dfrom the continuity equation using the chemical reactions of formation and loss of O 1D
presented in Table 3, the production of O 1D in the photodissociation reaction of oxygen molecules, the O 1D formation in collision of O 3P with thermal electrons and photoelectrons, and the diusion of O 1D
in the mixture of N2 0, O2, and O:
@ @tO
1
D @ @zF O
1
D QdPphPtK1O2Ne ÿ fK2N2 K3O2 K4O
K5K6K7gO 1D;
A24
where F O 1D ÿD O 1D @ @zO
1
D O 1D h
1
H
1
Tn
@ @zTn
i
; Qd O2Pkrd kU/ k expÿs k;
H kTn m gÿ1, D is the diusion coecient of O 1D;m denotes the mass of O;s k is the optical depth at wavelength k;rd k is the generally accepted photodissociation cross section of O2 with the produc-tion of O 1D(Solomonet al., 1988),Ptis determined by
collision of O 3Pwith photoelectrons, the value ofPphis
calculated by using the semi-empirical formula (Pavlov, 1990; Konikov and Pavlov, 1991), Ki i1±6 are the
rate coecients of the chemical reactions of Table 3. We believe that the diusion coecient of O 1D is the same as the diusion coecient of O 3P in the mixture of N2; O2, and O 3P:
DYf[O](D(O,O))ÿ1 N2 D(O,N2ÿ 1
O2 D(O,O2ÿ 1
gÿ1; A25
where Y O N2 O2, the binary diusion coef-®cients (Pavlov, 1981), D O,N2 D O,O2 9:69 1016Tn0:774Yÿ1, the self-diusion coecient of O is the function of the oxygen viscosity coecient (Ferziger and Kaper, 1972) and can be calculated as D O,O
1:941017T0:69
n Yÿ1, the units of [O], O2and N2 are cmÿ3 and the units ofDare cm2sÿ1.
Important characteristics of airglow that are calcu-lated by the model are the volume emission rate at 630 nm and the integral intensity:
V630K5O 1D;I630
Z1
0
V630 zdz: A26
Model inputs
The inputs for the model are a neutral atmosphere, the solar EUV ¯uxes, the perpendicular electric ®elds, and the additional heating rate of the electron gas due to Coulomb collisions between ring-current ions and plasmaspheric electrons and wave-electron interactions. The solar EUV ¯uxes are obtained from the EUVAC model (Richards et al., 1994) or EUV94X model (Tobiska, 1993, 1994). To specify the neutral tempera-ture and the number densities of N2;O2, O, and N we utilize the MSIS-86 model (Hedin, 1987) using the 3-h Ap index as an indicator of the geomagnetic activity. To
calculate the density of NO the same scheme of the processes of formation and loss of NO as in Iwagami and Ogawa (1987) is used, so it is not presented here: The ratio of CO2 to O2 N2 O can be taken as 310ÿ4 at 120 km (Banks and Kockarts, 1973). Above 120 km the model uses CO2 z CO2 z0
expfÿ zÿz0Hÿ1g, wherez0120 km; H kTn m gÿ1;
mdenotes the mass of CO2.
Lower and upper boundary conditions
The lower boundary 160 km is set for determination of
O 4S;H;He, ®eld-aligned diusion velocities, and temperatures of ions and electrons from Eqs. (A1, A2, A9, A10) in the northern and southern hemispheres. At this base altitude the diusion processes of O 4S;H;He ions and the processes of transfer of thermal energy of electrons and ions were neglected. At the lower boundary (120 km) the viscosity terms in the momentum equations, the diusion processes of O2 and NO ions, O 1D, vibrationally excited molecules and vibrational quanta are neglected in the northern and southern hemispheres. The upper boundary conditions are assumed asVi0 for O2 and NOions (see Eq. A2),
@
@za0;Fj N
2 0;@@rUh 0, and @@rU/0 at 700-km
altitude and F O 1D 0 at 1500-km altitude in the both hemispheres.
References
Abdou, W. A., D. G. Torr, P. G. Richards, M. R. Torr, and E. L. Breig,Results of a comprehensive study of the photochemistry of N2 in the ionosphere,J. Geophys. Res.,89,9069±9079, 1984. Adams, N. G., and D. Smith,Product ion distribution for some
ion-molecule reactions,J. Phys. B.,9,1439±1442, 1976.
Albritton, D. L., I. Dotan, W. Lindinger, W. Mc Farland, J. Tellinghuisen, and F. C. Fehsenfeld, Eects of ion speed distributions in ¯ow-drift tube studies of ion-neutral reactions, J. Chem. Phys.,66,410±421, 1977.
Bailey, G. J., and R. Sellec,A mathematical model of the Earth's plasmasphere and its applications in a study of He atL3, Ann. Geophysicae,8,171±190, 1990.
Banks, P. M., and G. Kockarts, Aeronomy, Academic Press New York, London, 1973.
Barakat, A. R., and R. W. Schunk,Ocharge exchange in the polar wind,J. Geophys. Res.,89,9835±9839, 1984.
Bates, D. R.,Recombination in the normal E and F layers of the ionosphere,Planet. Space Sci.,36,55±63, 1988.
Bilitza, D., Progress report on IRI status, Adv. Space Res., 10,
(11)3±(11)5, 1990.
Canoza, A., J. C. Gomet, B. R. Rowe, and J. L. Queelec,Flowing afterglow Langmuir probe measurement of the N2 v0
dissociative recombination rate coecient,J. Chem. Phys.,94,
7159±7163, 1991.
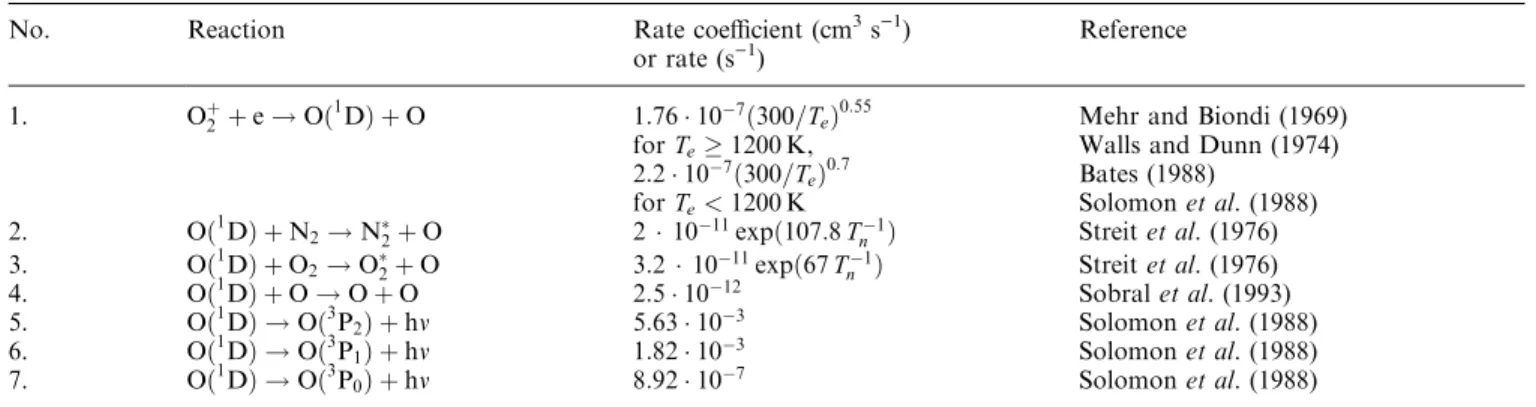
Table 3.The chemical processes of formation and loss of O(1D)
No. Reaction Rate coecient (cm3s)1)
or rate (s)1)
Reference
1. O2 e!O 1D O 1:7610ÿ7 300=T
e0:55 Mehr and Biondi (1969)
forTe1200 K, Walls and Dunn (1974)
2:210ÿ7 300=
Te0:7 Bates (1988)
forTe<1200 K Solomonet al.(1988) 2. O 1D N2!N2O 2 10ÿ11exp 107:8Tnÿ1 Streitet al.(1976) 3. O 1D O2!O2O 3:2 10ÿ11exp 67Tnÿ1 Streitet al.(1976)
4. O 1
D O!OO 2:510ÿ12 Sobralet al.(1993)
5. O 1D !O 3P2 hm 5:6310ÿ3 Solomonet al.(1988)
6. O 1D !O 3P1 hm 1:8210ÿ3 Solomonet al. (1988)
Chang, T., P. G. Richards, and D. G. Torr, Reevaluation of the O 2P reaction rate coecients derived from Atmosphere Explorer C observation, J. Geophys. Res., 98, 15589±15597, 1993.
Chen, J. C. Y., Theory of subexcitation electron scattering by molecules II. Excitation and de-excitation of molecular vibra-tion,J. Chem. Phys.,40,3513±3520, 1964.
Chen, A., R. Johnsen, and M. A. Biondi, Measurements of the ON2 and OO2 reactions rates from 300 to 900 K, Chem. Phys.,69,2688±2691, 1978.
Cole, K. D.,Stable auroral red arcs, sinks for energy of Dst main phase,J. Geophys. Res.,70,1689±1706, 1965.
Conrad, J. P., and R. W. Schunk,Diusion and heat ¯ow equations with allowance for large temperature dierences between interacting spacies,J. Geophys. Res.,84,811±822, 1979.
Cornwall, J. M., F. V. Coroniti, and R. M. Thorne,Uni®ed theory of sar-arc formation at the plasmapause,J. Geophys. Res.,76,
4428±4445, 1971.
Dube, L., and A. Herzenberg, Absolute cross sections from the ``boomerang model'' for resonant electron-molecule scattering, Phys. Rev. A,20,194±213, 1979.
Erlandson, R. E., T. L. Aggson, W. R. Hogey, and J. A. Slavin,
Simultaneous observations of subauroral electron temperature enhancements and electromagnetic ion cyclotron waves, Geo-phys. Res. Lett.,20,1723±1726, 1993.
Fehsenfeld, F. C., The reaction of O2 with atomic nitrogen and
NOH
2O and NO2 with atomic oxygen,Planet. Space Sci.,25,
195±200, 1977.
Fehsenfeld, F. C., D. B. Dunkin, and E. E. Ferguson, Rate constants for the reaction of CO2 with O;O2and NO; N2 with
O and NO; and O2 with NO, Planet. Space Sci.,18, 1267±
1269, 1970.
Ferguson, E. E., Comment on ``The eect on thermospheric chemistry of a resonant charge-exchange reaction involving vibrationally excited N ions with atomic oxygen'' by W. A. Abdouet al.,J. Geophys. Res.,89,399±400, 1984.
Ferguson, E. E., N. G. Adams, D. Smith, and E. Alge, Rate coecients at 300 K for the vibrational energy transfer reactions from N2 v1 to O2 v0 and NO
v0, J.
Chem. Phys.,80,6095±6098, 1984.
Ferziger, J. H., and G. H. Kaper,Mathematical theory of transport processes in gases, North-Holland Amsterdam, London, 1972.
Fok, M.-C., J. U. Kozyra, A. F. Nagy, C. E. Rasmussen, and G. V. Khazanov,Decay of equatorial ring current ions and associated aeronomical consequences,J. Geophys. Res.,98,19381±19393, 1993.
Fok, M.-C., P. D. Graven, T. E. Moore, and P. G. Richards,Ring current-plasmasphere coupling through Coulomb collisions, in Cross-scale coupling in space plasma Eds. J. L. Horwitz, N. Singh, and J. L. Burch,geophys Monogr. Ser.,93,Washington, pp. 161±171, 1995a.
Fok, M.-C., T. E. Moore, J. U. Kozyra, G. C. Ho, and D. C. Hamilton, Three-dimensional ring current decay model, J. Geophys. Res.,100,9619±9632, 1995b.
Fox, J. L. and A. Dalgarno,The vibrational distribution of N
2 in
the terrestrial ionosphere,J. Geophys. Res.,90,7557±7567, 1985.
Fujimoto, G., A. Nitzan, and E. Weitz,Diusion of vibrationally excited molecules,Chem. Phys.,15,217±225, 1976.
Gilmore, F. R., E. Bauer, and J. W. McGowan,A review of atomic and molecular excitation mechanisms in nonequilibrium gases up to 20000 K,J. Quant. Spectrosc. Radiat. Transfer,9,157± 183, 1969
Guberman, S. L.,Dissociative recombination of the ground state of N2,Geophys. Res. Lett.,18,1051±1054, 1991.
Haddad, G. N.,Cross-sections for electron scattering in nitrogen, Austr. J. Phys.,37,484±494, 1984.
Hedin, A. E.,MSIS-86 thermospheric model,J. Geophys. Res.,92,
4649±4662, 1987.
Horne, R. B., and R. M. Thorne,On the preferred source location for the convective ampli®cation of ion cyclotron waves, J. Geophys. Res.,98,9233±9247, 1993.
Itikawa, Y., M. Hayashi, A. Ichimura, K. Onda, K. Sakimoto, T. Takayanagi, M. Nakamura, H. Nishimura, and T. Takayanagi,
Cross sections for collisions of electrons and photons with nitrogen molecules,J. Phys. Chem. Ref. Data,15,985±1010, 1986.
Iwagami, N., and T. Ogawa,Thermospheric NO pro®lies observed at the diminishing phase of solar cycle 21,Planet. Space Sci.,35,
191±198, 1987.
Johnsen, R., and M. A. Biondi, Laboratory measurements of the O 2D N2 and O 2D O2 reaction rate coecients and
their ionospheric implications,Geophys. Res. Lett.,7,401±403, 1980.
Konikov, Y. V., and A. V. Pavlov,On airglow at 630 nm wavelength in the SAR-arcs region,Ann. Geophysicae,9,540±454, 1991.
Krinberg, I. A., and A. V. Tachilin,Ionosphere and plasmasphere(in Russian), Nauka, Moscow, 1984.
Kozyra, J. U., and A. F. Nagy,Ring current decay ± coupling of ring current energy into the thermosphere/ionosphere system,J. Geomagn. Geoelectr.,43,285±297, 1991.
Kozyra, J. U., T. E. Gravence, A. F. Nagy, M. O. Chandler, L. H. Brace, N. C. Maynard, D. W. Slater, B. A. Emery, and S. D. Shawhan, Characteristics of a stable auroral red arc events, Geophys. Res. Lett.,9,973±976, 1982.
Kozyra, J. U., E. G. Shelley, R. H. Comfort, L. H. Brace, T. E. Gravens, and A. F. Nagy, The role of ring current O in the formation of stable auroral red arcs,J. Geophys. Res.,92,7487± 7502, 1987.
Kozyra, J. U., C. E. Valladares, H. C. Carlson, M. J. Buonsanto, and D. W. Slater,A theoretical study of the seasonal and solar cycle variations of stable auroral red arcs,J. Geophys. Res.,95,
12219±12234, 1990.
LaValle, S. R., and D. D. Elliott,Observations of SAR arcs from OV1±10,J. Geophys. Res.,77,1802±1809, 1972.
Lee, J. H., J. V. Michael, W. A. Payne, and L. J. Stief,Absolute rate of the reaction of N 4Swith NO from 190±400 K with DF-RF and FP-DF-RF techniques,J. Chem. Phys.,69,3069±3073, 1978.
Lindinger, W., F. C. Fehsenfeld, A. L. Schmeltekopf, and E. E. Ferguson, Temperature dependence of some ionospheric ion-neutral reactions from 300±900 K,J. Geophys. Res.,82,4753± 4756, 1974.
Mauclaire, G., R. Derai, S. Fenistein, R. Matx, and R. Johnsen,
Thermal energy charge transfer from Heto O2: kinetic energy,
nature, and reactivity of the Oproduct ions, J. Chem. Phys.,
70,4023±4026, 1979.
McFarland, M., D. L. Albritton, F. C. Fehsenfeld, E. E. Ferguson, and A. L. Schmeltekopf,Energy dependence and branching ratio of the N2 O reaction,J. Geophys. Res.,79,2925±2926, 1974. McNeal, R. G., M. E. Whitson, and G. R. Cook, Temperature dependence of the quenching of vibrationally excited nitrogen by atomic oxygen,J. Geophys. Res.,79,1527±1531, 1974.
Mehr, F. J., and M. A. Biondi,Electron temperature dependence of recombination of O2 and N2 ions with electrons,Phys. Rev., 181,264±269, 1969.
Newton, G. P., J. C. G. Walker, and P. H. E. Meijer,Vibrationally excited nitrogen in stable auroral red arcs and its eect on ionospheric recombination, J. Geophys. Res., 79, 3807±3818, 1974.
Oppenheimer, M., E. R. Constantinides, K. Kirby-Docken, G. A. Victor, and A. Dalgarno, Ion photochemistry of the thermo-sphere from Atmothermo-sphere Explorer C measurements,J. Geophys. Res.,82,5485±5492, 1977.
Pavlov, A. V., The binary molecular diusion coecients of the neutral components of the upper atmospheres of Earth, Mars, and Venus, (in Russian)Space Res.,19,82±86, 1981.
Pavlov, A. V., The role of vibrationally excited nitrogen in the ionosphere,Pure Appl. Geophys.,127,529±544, 1988.
Pavlov, A. V.,About the role of vibrationally excited nitrogen in the sabauroral red arc region (in Russian),Geomagn. Aeron.,29,
948±953, 1989.
Pavlov, A. V.,Interpretation of incoherent radio wave scatter data at Millstone Hill during high solar activity conditions, (in Russian), Geomagn. Aeron.,31,664±668, 1991.
Pavlov, A. V., The role of vibrationally excited nitrogen in the formation of the mid-latitude ionisation trough,Ann. Geophys-icae,11,479±484, 1993.
Pavlov, A. V., The role of vibrationally excited nitrogen in the formation of the mid-latitude ionospheric storms, Ann. Geo-physicae,12,554±564, 1994.
Pavlov, A. V.,Mechanisms of the electron density depletion in the SAR arc region,Ann. Geophysicae,14,211±221, 1996.
Pavlov, A. V., and M. J. Buonsanto,Comparison of model electron densities and temperatures with Millstone Hill observations during undisturbed periods and the geomagnetic storms of 16± 23 March and 6±12 April 1990,Ann Geophysicae,15,327±344, 1997.
Pavlov, A. V., and A. A. Namgaladze, Vibrationally excited nitrogen in the upper atmosphere. Review paper (in Russian), Geomagn Aeron.,28,705±721, 1988.
Phillips, L. F., and H. I. Schi,Mass-spectrometric studies of atom reactions II. Vibrationally excited N2formed by the reaction of
N atoms with NO,J. Chem. Phys.,36,3283±3286, 1962.
Radzig, A. A., and B. V. Smirnov,The reference book in atomic and molecular physics(in Russian), Atomizdat, Moscow, 1980.
Reed, E. I., and J. E. Blamont, Ogo 4 observations of the September 1967 M-arc,EOS Trans. AGU,49,731, 1968.
Rees M. H., and R. G. Roble, Observations and theory of the formation of stable auroral red arcs,Rev. Geophys. Space Phys.,
13,201±242, 1975.
Richards, P. G.,An improved algorithm for determining neutral winds from the height of the F2 peak electron density, J. Geophys. Res.,96,17839±17846, 1991.
Richards, P. G., J. A. Fennelly, and D. G. Torr,EUVAC: A solar EUV ¯ux model for aeronomical calculations,J. Geophys. Res.,
99,8981±8992, 1994. (Correction in J. Geophys. Res.,99,13283, 1994.)
Seaton, M. J., and D. W. Osterbrock, Relative OII intensities in gaseous nebulae,Astrophys. J.,125,66±83, 1957.
Schmeltekopf, A. L., E. E. Ferguson, and F. C. Fehsenfeld,
Afterglow studies of the reactions He, He 23S, and Owith
vibrationally excited N2,J. Chem. Phys.,48,2966±2973, 1968. Schulz, G. J.,A review of vibrational excitation of molecules by electron impact at low energies, inPrinciples of laser plasmas, Ed. G. Berke®, Interscience, New York, pp. 33±76, 1976.
Slanger, T. G., and G. Black, Electronic-to-vibrational energy transfer eciency in the O 1D±N2 and O 1D-CO systems,J. Chem. Phys.,60,468±477, 1974.
Slater, D. W., C. Gurgiolo, J. U. Kozyra, E. W. Kleckner, and J. D. Winningham,A possible energy source to power stable auroral red arcs: precipitating electrons, J. Geophys. Res., 92, 4543± 4552, 1987.
Smith, F. L., and C. Smith,Numerical evaluation of Chapman's c grazing incidence integral ch(X,xi),J. Geophys. Res.,77,3592± 3597, 1972.
Sobral, J. H. A., H. Takahashi, M. A. Abdu, P. Muralikrishna, Y. Sahai, C. J. Zamlutti, E. R. de Paula, and P. P. Batista,
Determination of the quenching rate of the O 1D by O 3P from rocket-borne optical (630 nm) and electron density data, J. Geophys. Res.,98,7791±7798, 1993.
Solomon, S. C., P. B. Hays, and V. J. Abreu,The auroral 6300 A emission: observations and modelling, J. Geophys. Res., 93,
9867±9882, 1988.
St.-Maurice, J.-P., and D. G. Torr,Nonthermal rate coecients in the ionosphere: the reaction of O with N2, O2 and NO, J. Geophys. Res.,83,969±977, 1978.
Streit, G. E., C. J. Howard, A. L. Schmeltekopf, J. A. Davidson, and H. I. Schi, Temperature dependence of O 1Drate constants for reactions with O2, N2, CO2, O3, and H2O,J. Chem. Phys., 65,4761±4764, 1976.
Suchkov, A. F., and Ju. I. Schebeko,The kinetic of the vibrational exchange in the nonequilibrium nitrogen (in Russian), Chem. High Energ.15,279±283, 1981.
Taylor, R. L., Energy transfer processes in the stratosphere,Can. J. Chem.,52,1436±1451, 1974.
Thorne, R. M., and R. B. Horne, The contribution of ion-cyclotron waves to electron heating and SAR-arc excitation near the storm-time plasmapause, Geophys. Res. Lett., 19, 417±420, 1992.
Tobiska, W. K.,The empirical solar EUV irradiance model EUV94 (abstract),EOS Trans. AGU,74(43),490, 1993.
Tobiska, W. K.,Modeled soft X-ray solar irradiance,Solar Phys.,
152,207±215, 1994.
Torr, M. R., and D. G. Torr,Recombination of NOin the mid-latitude trough and the polar ionization hole,J. Geophys. Res.,
84,4316±4320, 1979.
Torr, M. R., and D. G. Torr,The role of metastable species in the thermosphere,Rev. Geophys. Space Phys.,20, 91±144, 1982.
Torr, M. R., D. G. Torr, P. G. Richards, and S. P. Yung, Mid-and low-altitude model of thermospheric emissions. 1. O 2P 7320 A and N2 2P3371 A,J. Geophys. Res.,95,21147±21168,
1990.
Tully, J. C.,Collision complex model for spin forbidden reactions: quenching of O 1Dby N2,J. Chem. Phys.,61,61±68, 1974. Van Zandt, T. E., and T. F. O' Malley, Rate coecient for the
reaction of Owith vibrationally excited N2,J. Geophys. Res., 78,6818±6820, 1973.
Viehland, L. A., and E. A. Mason,Statistical-mechanical theory of gaseous ion-molecule reaction in an electrostatic ®eld,J. Chem. Phys.,66,422±434, 1977.
Walls, F. L., and G. H. Dunn,Measurement of total cross sections for electron recombination with NOand O2 using ion storage