A number of researchers are studying re-gional specifications of Russia from a variety of different perspectives. Economic geography has developed its own methods of approaching the study of territories, and looks, in particular, at geographical distribution of labour. In this article, we use the framework provided by this discipline to describe the changes in the econ-omy of the Russian North-West in the first dec-ade of the 21st century. We combine publicly available data to propose new methods of evaluation of regional economic efficiency. We also identify and describe new trends of North-West development that have not yet been re-flected upon by the researchers in the field. We conclude that, having overcome the crisis of the 1990s, the economy of the Russian North-West displays an overall positive trend of com-ing back to the territorial structures of the be-ginning of the 20th century.
Key words: North-West, productive forces, regional development, fixed capital as-sets, investments, income, standard of living
The first decade of the 21st century was a very interesting period of time. The country was finally calming down after the stormy 1990s, and has now finally changed its development strategy from ‘stabilization’ to ‘modernization’. The beginning of the 21st century was also the time for many enterprises to recover and increase their production output, the ef-fort somewhat constrained by the global financial crisis of 2008.
Nonetheless, in the period from 2000 to 2010, oil production increased from 324 mln tons to 505 mln tons (1.56 times); coal production — from 258 to 317 mln tons (by 1.22 times). Natural gas excavation was not doing so well, dis-playing a very modest growth: from 584 bln cubic meters in 2000 to 591 bln in 2010. Outside fuel and power industry, food production enjoyed the most dy-namic development. Poultry meat output, THE TERRITORIAL
STRUCTURE OF
PRODUCTIVE FORCES OF
RUSSIAN NORTH-WEST IN
THE 2000—2010s
V. L. Martynov
I. Ye. Sazonova
*
Herzen State Pedagogical University of Russia
48 Moyka embankment, St. Petersburg 191186, Russia
Received 26 August 2011
82
for example, increased by 5.7 times, from 477,000 tons in 2000 to 2.739 mln tons in 2010. The production of consumer goods also grew. Thus, the produc-tion of footwear tripled, from 32.9 mln pairs a year in 2000 to 97.1 mln in 2010. Weaving factories were also quite efficient, increasing their output from 2439 mln sq m of fabric to 3199 mln sq m a year. There was a significant rise in the production of cars: in 2000 the industry produced 969 thousand cars a year, while in 2010 this number reached 1.209 mln. Naturally, there was also an increase in freight traffic activity. Rail carried 1373 bln kmt in 2000 and 2010.6 bln kmt in 2010.
Not every industry, however, reported increase. The production of heavy machinery definitely declined, and it was the output of metal-cutting ma-chines that experienced the most dramatic drop: from 74,171 units in 1990, to 8,885 units in 2000, to meager 2,002 units in 2010. Yet we should note that this does not represent the general trend for the beginning of the 21st century [2; 8]. We should also point out that processing industries and non-production sectors of economy developed more rapidly than extraction in-dustries.
It is obvious that the differences in development pace and specialization both reflect and form regional differences between the federal districts. The Russian North-West, or North-West Federal District (North-West and Northern Economic Districts plus the Kaliningrad region), is an economi-cally, geographically and demographically diverse set of regions. Its two dis-tinct areas are North-West Economic District (located in the Baltic Sea ba-sin) and Northern Economic District (located in the Arctic Ocean baba-sin). These areas of NWFD are also sometimes referred to as ‘Southern’ West Economic District and the Kaliningrad region) and ‘Northern’ (North-ern Economic District).
There is no need to conduct an elaborated study to conclude that the re-gions constituting the Russian North-West are vastly diverse. But just how big these differences are, and how we can describe the main development trends in present day economy of those regions are two questions that still remain unanswered by the modern scholarship on the topic. Yet it is crucial to know these answers to be able to forecast the spatial population structure changes at both macroregional and regional levels. The current practice of economic forecasting utilizes far too many layman methods and, as a result, local programmes of strategic regional development read like science fiction novels, and have similar relation to reality. While drawing up such documents it has become customary to ignore the research conducted by various serious scientists, particularly those working in the field of economic geography.
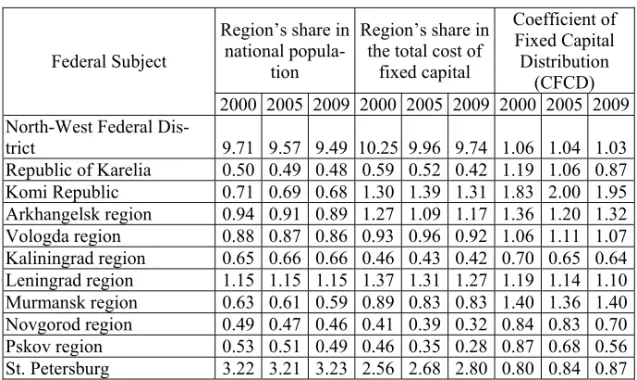
To determine the importance of the region in the context of national economy, we can analyse the volume of regional fixed capital assets instead of industrial output. It can be assumed that the cost of fixed capital is a cost estimate for means of production, which is one of the two main components of the productive forces (the other being the people who populate a region and make it possible to use the means of production). The coefficient calcu-lated (not unlike the coefficient of specialization) as the ratio of a region’s share in national fixed capital to the region’s share in national population, can be called the coefficient of fixed capital distribution (CFCD). We have summarized our calculations in Table 1.
Table 1
Coefficient of Fixed Capital Distribution
Region’s share in national
popula-tion
Region’s share in the total cost of
fixed capital
Coefficient of Fixed Capital Distribution
(CFCD) Federal Subject
2000 2005 2009 2000 2005 2009 2000 2005 2009 North-West Federal
Dis-trict 9.71 9.57 9.49 10.25 9.96 9.74 1.06 1.04 1.03
Republic of Karelia 0.50 0.49 0.48 0.59 0.52 0.42 1.19 1.06 0.87 Komi Republic 0.71 0.69 0.68 1.30 1.39 1.31 1.83 2.00 1.95 Arkhangelsk region 0.94 0.91 0.89 1.27 1.09 1.17 1.36 1.20 1.32 Vologda region 0.88 0.87 0.86 0.93 0.96 0.92 1.06 1.11 1.07 Kaliningrad region 0.65 0.66 0.66 0.46 0.43 0.42 0.70 0.65 0.64 Leningrad region 1.15 1.15 1.15 1.37 1.31 1.27 1.19 1.14 1.10 Murmansk region 0.63 0.61 0.59 0.89 0.83 0.83 1.40 1.36 1.40 Novgorod region 0.49 0.47 0.46 0.41 0.39 0.32 0.84 0.83 0.70 Pskov region 0.53 0.51 0.49 0.46 0.35 0.28 0.87 0.68 0.56 St. Petersburg 3.22 3.21 3.23 2.56 2.68 2.80 0.80 0.84 0.87
Note: Numbers are rounded to the nearest hundredth of a per cent, calculated using data from [8].
re-84
gional CFCD almost does not change, but it does show a very slight drop. The region, too, has had its share of new plants, but they either utilize already exist-ing means of production, or their capital/output ratio is not high. Some of the old production plants are disappearing, too.
In the Northern regions of the North-West the situation is more diverse. In Republic of Karelia and in Arkhangelsk region, both of which have almost ex-hausted their natural resources, CFCD is going down. In the Komi Republic, which has been actively exploring new excavation sites (like that bauxite de-posit in the Timan range), CFCD is growing. Murmansk region has always re-lied on its transportation complex and logistics, so its CFCD has hardly shown any changes at all.
However, it is not only the volume of the fixed capital assets that is im-portant for economic forecasting, but also their efficiency. To evaluate the latter, we will use the coefficient of fixed capital efficiency (CFCE) that is calculated as a ratio of the region’s share in national GDP to this region’s share in national fixed capital assets. The results of the calculations are summarized in Table 2.
For the majority of the federal districts, the pattern of change in the effi-ciency of fixed capital usage is wavelike: the data clearly shows a decline from 2000 until 2005, and then a steady growth. This is explained by the slow development of new fixed capital assets in the start of the century. In 2000, the development of new enterprises intensified, this triggered the re-newal of fixed capital assets, and, as a consequence, the growth of regional GDP. However, each North-West region developed their new enterprises at their own pace. The south of the North-West Federal District is generally better in efficient use of its fixed assets than the north, and their economy develops faster, since, for the last 10 years, the national value added output industry in general has been doing much better than excavation.
Table 2
Coefficient of Fixed Capital Efficiency
Regional Share in National GDP
Regional Share in the National Fixed Capital
Assets
Coefficient of Fixed Capital Efficiency
(CFCE) Federal Subject
2000 2005 2009 2000 2005 2009 2000 2005 2009 North-West Federal
Dis-trict 9.78 8.33 8.78 10.25 9.96 9.74 0.96 0.84 0.90
Republic of Karelia 0.45 0.36 0.27 0.59 0.52 0.42 0.77 0.69 0.65 Komi Republic 1.15 0.79 0.78 1.30 1.39 1.31 0.88 0.57 0.59 Arkhangelsk region 0.93 0.77 0.83 1.27 1.09 1.17 0.73 0.71 0.71 Vologda region 1.09 0.90 0.55 0.93 0.96 0.92 1.17 0.93 0.60 Kaliningrad region 0.42 0.38 0.44 0.46 0.43 0.42 0.91 0.88 1.04 Leningrad region 0.95 0.95 1.10 1.37 1.31 1.27 0.69 0.72 0.86 Murmansk region 0.93 0.61 0.52 0.89 0.83 0.83 1.05 0.74 0.63 Novgorod region 0.33 0.30 0.30 0.41 0.39 0.32 0.82 0.75 0.95 Pskov region 0.27 0.19 0.19 0.46 0.35 0.28 0.59 0.54 0.69 St. Petersburg 3.27 3.08 3.80 2.56 2.68 2.80 1.28 1.15 1.35
During the period from 2000 to 2009 the economy of St. Petersburg had the best efficiency rates. It is most probably be explained by the highest con-centration on fixed capital assets on a small area (about 1,400 sq km, of which 800 is the urban area). The availability of large underdeveloped grounds suitable for new industrial construction projects (some development works have already started to the north and south of the city) will create an even better economic efficiency situation in the foreseeable future.
Apart from St. Petersburg, only two regions had CFCE higher than 1 — Murmansk and Vologda, yet by 2009 both started lagging behind, Vologda region especially so. The steep decline, already apparent in 2009, was the di-rect result of the economic and financial crisis of 2008, which had hit the re-gion’s chief enterprise, Severstal. Murmansk and other northern regions also demonstrated a fall in CFCE, albeit more gradual and permanent.
At the same time, the economic efficiency of the southern regions of the West grew. The Kaliningrad region, for example, was the only North-West federal subject whose economic efficiency coefficient was less than 1 in the beginning of our period (2000) and grew to more than 1 by 2009. The positive development was caused by appearance of the enterprises that en-sured this region’s leading role in manufacturing new types of electronic equipment. Yet CFCE also increased in those regions that took more time to build up and strengthen their capital assets, such as Novgorod or Pskov re-gions, as an example.
For us, it was also interesting to compare and contrast the two coeffi-cients, and look at both distribution and efficiency of fixed capital assets at the same time (see Table 3).
Table 3
Comparison between theCoefficient of Fixed Capital Distribution (CFCD) and the Coefficient of Fixed Capital Efficiency (CFCE)
Coefficient of Fixed Capi-tal Distribution (CFCD)
Coefficient of Fixed Capi-tal Efficiency (CFCE) Federal Subject
2000 2005 2009 2000 2005 2009 North-West Federal
Dis-trict 1.06 1.04 1.03 0.96 084 0.90
Republic of Karelia 1.19 1.06 0.87 0.77 0.69 0.65
Komi Republic 1.83 2.00 1.95 0.88 0.57 0.59
Arkhangelsk region 1.36 1.20 1.32 0.73 0.71 0.71
Vologda region 1.06 1.11 1.07 1.17 0.93 0.60
Kaliningrad region 0.70 0.65 0.64 0.91 0.88 1.04
Leningrad region 1.19 1.14 1.10 0.69 0.72 0.86
Murmansk region 1.40 1.36 1.40 1.05 0.74 0.63
Novgorod region 0.84 0.83 0.70 0.82 0.75 0.95
Pskov region 0.87 0.68 0.56 0.59 0.54 0.69
86
The northernmost regions (Komi Republic, Murmansk and Arkhangelsk regions) seem to have the highest distribution coefficients, yet the efficiency coefficients for the same regions are either quite low or declining. Komi Re-public is a very clear example of the trend: in 2009 the reRe-public had the highest and most steadily growing CFCD among all Russian North-West, and the lowest CFCE. In the southern regions the situation is reversed, with their CFCD lower than their CFCE. In 2009 Kaliningrad region had the ratio of coefficients, with its CFCE 1.62 higher than its CFCD, closely followed by St. Petersburg, where CFCE was 1.55 times higher than CFCD and Nov-gorod region with CFCE higher than CFCD by 1.35 times, and Pskov region with CFCE higher than CFCD by 1.23.
In other words, the north needs more input for the same economic out-come than the south. Take the ‘Arctic Drive’ that our country started in the 1920s, for example. It gave a lot of resources to the state, but it took a lot, too. That is why, after the artificial support to the northern regions was ceased in the beginning of the 1990s, the north experienced a mass outward migration of people. One can assume that if we divert the investment now used to support and develop the north into facilitating the development of the south, the economic effect will be more visible.
Regional development is not limited to the utilization of fixed capital as-sets. The coefficients discussed above do reflect the state and dynamics of the production means, but it is the standard of living that is another impor-tant factor in the development of a region, if not the most imporimpor-tant. The population of a region both produces and consumes industrial output, and, along with the means of production, is the second integral part of productive forces. It is important to compare the income and spending rates of the popu-lation. To evaluate the income rate, one can use the average wage index per worker, to evaluate the spending — the cost of the market basket. The basket is unified for all of Russia and includes 83 items of goods and services (30 types of foodstuffs, 41 types of consumer goods, 12 types of ser-vices) [7]. To get the standard of living index, we propose to use the wage efficiency coefficient, which is calculated with the following equation:
WEC = (MWReg / MWRus) / (MBReg / MBRus),
where WEC is wage efficiency coefficient, MWReg — average monthly wage in a region, MWRus — national average monthly wage; MBReg — cost of the market basket in a region, MBRus — average national cost of the market basket.
We have summarized the results of our calculations in Table 4.
Soviet Union, the average wage in the north was much higher than the nation’s average due to special coefficients and regional bonuses, while prices were mostly the same. Regional bonuses and coefficients are still there, but the prices have “caught up” with the salaries.
Table 4
Wage Efficiency Coefficient
Average wage in a region to na-tional average
Market basket cost in a region to average national cost of the
market basket
Wage effi-ciency
coeffi-cient Federal Subject
2001 2005 2010 2001 2005 2010 2001 2005 2010 North-West Federal
Dis-trict 1.13 1.11 1.12 1.03 1.04 1.06 1.10 1.06 1.06
Republic of Karelia 1.05 1.02 0.94 0.96 0.95 1.03 1.02 0.98 0.91 Republic of Komi 1.6 1.4 1.2 1.07 1.16 1.18 1.55 1.30 1.03 Arkhangelsk region 1.14 1.15 1.05 0.98 1.05 1.13 1.11 1.11 0.93
Incl. Nenets Autonomous
District 2.85 2.69 2.23 1.50 1.65 1.59 2.77 2.58 1.41 Vologda region 1.08 1.03 0.88 0.92 0.96 1.01 1.05 0.99 0.86 Kaliningrad region 0.80 0.79 0.88 1.02 1.07 1.04 0.77 0.76 0.85 Leningrad region 1.01 1.00 1.00 0.97 1.00 1.03 0.98 0.96 0.97 Murmansk region 1.66 1.46 1.36 1.31 1.33 1.27 1.61 1.40 1.07 Novgorod region 0.76 0.81 0.78 0.93 0.90 0.92 0.74 0.78 0.85 Pskov region 0.64 0.67 0.67 0.85 0.86 0.91 0.62 0.64 0.73
Note: Numbers are rounded to the nearest hundredth of a per cent, calculated using data from [1; 5; 6].
In the first decade of the 21st century southern regions of the NWFD, cated in the Baltic Sea basin, developed faster than the northern regions, lo-cated in the Arctic Ocean basin. This signifies a return to special development trends of pre-revolutionary Russia. At that time, the Baltic Sea basin was home to 2 of the country’s five industrial regions, St. Petersburg region and Baltic region (including Riga, which is no longer the part of the Russian state). In the Soviet times, the southern regions were losing importance, while the northern, resource-rich areas were gaining it just as fast, since resource-based self-sufficiency was one of the key strategic aims of the Soviet economic model.
lo-88
cation, favourable climate, labour resources and high starting level of infra-structural development. It will not take much to increase their economic effi-ciency — a statement supported by our detailed analysis of the development trends of 2000—2010.
References
1. Gde v Rossii luchshe zhit'. Osnovnye pokazateli social'no-jekonomicheskogo polozhenija subektov Rossijskoj Federacii v 2010 g. [Where better to live in Russia. The main indicators of socio-economic status of the Russian Federation in 2010], Rossijskaja gazeta, 2011, no. 5430, 16 March 2011.
2. Informacija o social'no-jekonomicheskom polozhenii Rossii, janvar' — dekabr' 2010 g. [Information on the socio-economic situation in Russia, January — December 2010], 2011, Moscow, Federal State Statistics.
3. Nacional'nye scheta Rossii v 1994—2001 godah [National Accounts of Rus-sia, 1994—2001], 2002, Moscow, Federal State Statistics.
4. Nacional'nye scheta Rossii v 2003—2010 godah [National Accounts of Rus-sia, 2003—2010], 2011, Moscow, Federal State Statistics.
5. Regiony Rossii. Social'no-jekonomicheskie pokazateli. 2003 [Regions of Rus-sia. Socio-economic indicators. 2003], 2003, Moscow, Federal State Statistics.
6. Regiony Rossii. Social'no-jekonomicheskie pokazateli. 2007 [Regions of Rus-sia. Socio-economic indicators. 2007], 2007, Moscow, Federal State Statistics.
7. Regiony Rossii. Social'no-jekonomicheskie pokazateli. 2010 [Regions of Rus-sia. Socio-economic indicators. 2010], 2010, Moscow, Federal State Statistics.
8. Rossijskij statisticheskij ezhegodnik 2010 [Russian Statistical Yearbook 2010], 2011, Moscow, Federal State Statistics.
About the authors
Prof. Vasily L. Martynov, Department of Economic Geography, Herzen
State Pedagogical University of Russia. E-mail: lwowich@land. ru
Dr Irina Ye. Sazonova, associate professor, Department of Economic