Determinants of Trade Credit: A Preliminary Analysis on
Construction Sector
Nicoleta Bărbuţă-Mişu
“Dunărea de Jos” University of Galati, Romania
Fitim Deari
South East European University, Republic of Macedonia
This paper introduces a preliminary analysis of the correlations between trade credit and some selected measures of financial performance for a sample of firms acting in the construction sector. The examined period covers - . The sample derived from Amadeus database contains firms that have sold and bought on credit. Results showed that larger firms offered and used more credit than counterparties. Firms offered and used in same time credit, but not in same level. Firms with higher return on assets and profit margin used and offered less credit from suppliers, respectively to clients. Moreover, more liquid firms used less trade payables.
Keywords: trade receivables, trade payables, profitability, firm size, pairwise
correlation.
JEL Classification: G , G .
1. Introduction
)n economies with well-developed financial institutions, firms have many opportunities of funding investment projects and operational activity. Usually, firms choose funding sources with the lowest cost and projects by that yield the highest returns. But, for firms in poorly developed financial markets, the borrowing to the bank is not always a solution due to the creditworthiness conditions. Thus trade credit is an alternative source of funds. )ndustries with higher dependence on trade credit financing exhibit higher rates of growth in countries with weaker financial institutions, and most of the effect reported comes from growth in the size of pre-existing firms, consistent with barriers to trade credit access among young firms Fisman and Love, .
)n the countries with poorly developed financial institutions, non-state owned firms use more trade credit compared to state owned firms. This higher usage is primarily for financing their prosperous growth opportunities rather than transactional purposes Ge and Qiu, . Also, poorly performing state-owned enterprises are more likely to redistribute credit to firms with less privileged access to loans via trade credit Cull et al., .
Firms with direct access to capital markets both extend more and receive less trade credit during a recession Kohler et al., . Studying the behaviour of trade credit around the time of financial crises, Love et al. found an increase in trade credit at the peak of financial crises, followed by a subsequent collapse of trade credit right after crisis events. Coulibaly et al. explored the extent to which financial conditions contributed to the decline in firms' sales during global financial crisis and found that financial conditions adversely affected sales during the crisis and also, the use of trade credit played an important role in the relative performance of firms.
The concept of trade credit explains relationships between the firm, its customers and suppliers. Petersen and Rajan described three main theories which explain trade credit. The first theory is financing advantage theories of trade credit, the supplier having an advantage over traditional lenders in investigating the creditworthiness of clients and a better ability to monitor and force repayment of credit. They mention three sources of cost advantages: advantage in information acquisition, advantage in controlling the buyer, and advantage in salvaging value from existing assets.
reduces the effective price to low-quality borrowers. )f this is the most price elastic segment of the market, then trade credit is an effective means of price discrimination. The third theory of transactions costs operational motives is explained by the reduction costs of paying bills through the use of trade credit. Usually, both financial and commercial motives explain the credit behaviour of firms and suppliers act as financial intermediaries in favour of firms with a limited access to bank credit
Delannay and Weill, .
A deep review of trade credit literature, from micro and macroeconomic perspectives, was achieved by Seifert et al. . They focused on motives of the studies, countries, characteristics of the sample, different methodology used as equilibrium models, panel-data regressions, optimization model and survey and the findings.
Testing the existence of a trade credit channel of transmission of monetary policy, Guariglia and Mateut found that both the credit and trade credit channels operate in the UK, and that the latter channel tends to weaken the former. Yang found that during tight monetary periods, trade credit operates mainly as a substitute for bank borrowing, while during looser monetary episodes even when the economy is weak, trade credit and bank loans are dominated by a complementary effect.
Trade credit is the separation between delivery of goods and services and their payments to suppliers Brennan et al., . Trade credit is not controlled by authorities because of its specific nature of not belonging to bank sectors Nieuwkerk, . Also, there is no a fixed level of accounts receivable and payable that firm should has, this level being affected by many factors: market structure, stages of business cycles, customers' creditworthiness, suppliers' willingness to price discriminate, and information asymmetry between suppliers and customers Altunok, .
Some important findings were achieved by panel-data regressions: trade credit offers control benefits in the early stages of a venture (uyghebaert, , trade credit can be a substitute for loans for firms that were shut out of formal credit markets Cull et al., ; trade credit can be both a substitute for and a complement to bank credit Chant and Walker, ; Yang, , trade credit is a complement to bank credit Ono, , firms end up using a mix of trade credit and bank loans trade Yang, , credit reduces treasury uncertainties Brennan et al., etc. When lending becomes less severe, the allocation of lending became more efficient, and the amount of trade credit extended by private firms declined Cull et al., . But, firms with better access to credit offer more trade credit
Petersen and Rajan, .
Small firms increase trade credit, a substitute credit, indicating a strong loan demand; trade credit is widely used by the small firms suffering the loan decline; the reasons large firms use trade credit are financial in nature Nilsen, . Larger firms, with better access to alternative internal and external financing and with a lower cost, use less credit from suppliers Garcia-Teruel and Martinez-Solano, ; Li, , while firms with greater capacity to obtain resources from the capital markets, and more cheaply, grant more trade credit to their customers in accordance with discrimination theory.
Li observed that older firms grant less trade credit and resort more to trade credit; smaller firms grant more credit to customers as a way of marketing strategy to increase sales and build long-term relationship with customers; larger firms resort more financing to suppliers as their good reputation and large economic scales. )t is observed that firms with high capacity of generating internal cash, offer less trade credit to customers and borrow less from suppliers.
Moreover, firms react by increasing the credit they grant in an attempt to stem falling sales and larger firms, with greater growth opportunities and greater investment in current assets, receive more finance from their suppliers Garcia-Teruel and Martinez-Solano, .
The effect of financial deepening on the relationship between trade credit and cash holdings show that firms in regions with higher levels of financial deepening hold less cash for payables while substituting more receivables for cash and a more highly developed financial sector helps firms to better use trade credit as a short-term financing instrument Wu et al., .
Firms use the trade credit channel to manage growth and firms that are more vulnerable to financial market imperfections, and therefore more likely to be financially constrained, rely more on the trade credit channel to manage growth Ferrando and Mulier, . Also, firms prefer to delay collection from their customers then demand long-term trade credit from their suppliers and firms that present high levels of days-of-sales outstanding and a high probability of insolvency use more trade credit Bastos and Pindado, , these relations being enhanced during a financial crisis.
firms with high growth resort less financing from suppliers, because they have capability of obtaining external financing including short-term financing debt and long-term debt Li, .
The profitable private firms are more likely to extend trade credit than unprofitable ones Cull et al., . Firms with high trade credit located in producer countries have stock returns that are strongly predictable based on the returns of their associated customer countries Albuquerque et al.,
.
(ighly profitable firms both give and receive less trade credit. Firms with greater access to bank credit offer less trade credit to their customers. On the other hand, firms with higher bank loans receive more trade credit. (oldings of liquid assets have a positive influence on both accounts receivable and accounts payable Vaidya, .
Bougheas et al. achieved a model that identifies the response of accounts payable and accounts receivable to changes in the cost of inventories, profitability, risk and liquidity and they found that this influence operates through a production channel. Albuquerque et al. developed an asset pricing model in which firms in different countries are connected by trade credit links that offers stronger predictability during periods of high credit constraints and low uninformed trading volume. The aim of this paper is to realize a preliminary analysis on firms acting in the construction sector in order to identify possible correlations of trade credit. The paper contributes to the managerial approach of trade credit and is organized as follows. Section presents the description of variables and data used in the analysis. Section reflects a brief summary statistics and is followed by the pairwise correlations analysis in section , and final conclusions in the Section .
2. Variables and data description
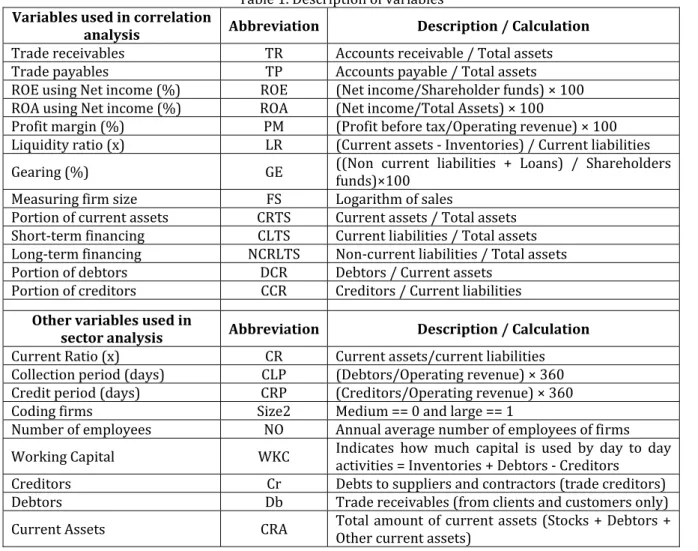
For our analysis we selected indicators of trade credit and financial performance reflected by profitability, liquidity, gearing, financing, activity and firm size Table . Also, the Table describes the methodology of measuring variables used in sector and correlation analysis.
Table . Description of variables
Variables used in correlation
analysis Abbreviation Description / Calculation
Trade receivables TR Accounts receivable / Total assets Trade payables TP Accounts payable / Total assets ROE using Net income % ROE Net income/Shareholder funds × ROA using Net income % ROA Net income/Total Assets ×
Profit margin % PM Profit before tax/Operating revenue ×
Liquidity ratio x LR Current assets - )nventories / Current liabilities Gearing % GE funds ×Non current liabilities + Loans / Shareholders Measuring firm size FS Logarithm of sales
Portion of current assets CRTS Current assets / Total assets Short-term financing CLTS Current liabilities / Total assets Long-term financing NCRLTS Non-current liabilities / Total assets Portion of debtors DCR Debtors / Current assets
Portion of creditors CCR Creditors / Current liabilities
Other variables used in
sector analysis Abbreviation Description / Calculation
Current Ratio x CR Current assets/current liabilities Collection period days CLP Debtors/Operating revenue × Credit period days CRP Creditors/Operating revenue × Coding firms Size Medium == and large ==
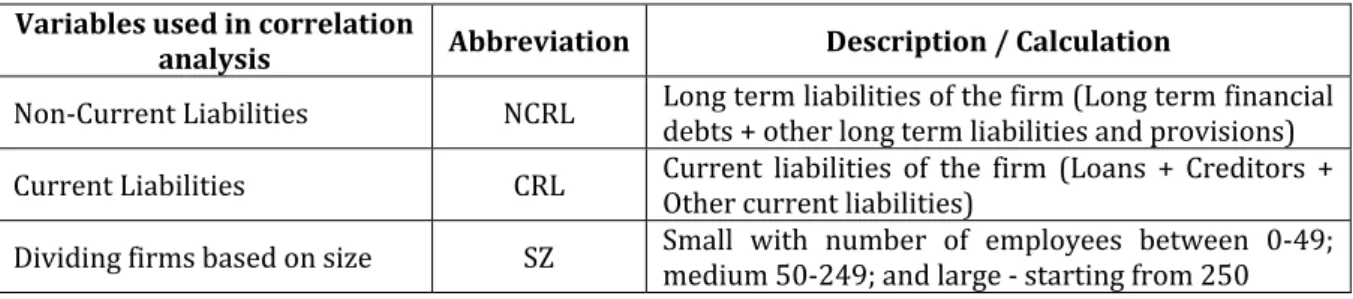
Variables used in correlation
analysis Abbreviation Description / Calculation
Non-Current Liabilities NCRL Long term liabilities of the firm Long term financial debts + other long term liabilities and provisions
Current Liabilities CRL Current liabilities of the firm Loans + Creditors + Other current liabilities
Dividing firms based on size SZ Small with number of employees between - ; medium - ; and large - starting from
Source: Bureau van Dijk database (Amadeus database). Abbreviations made by the authors.
The variables were selected by authors, taking into account own considerations and the most used variables in the literature. Related to trade credit measures TR and TP , Grave examined trade receivables divided by total assets and trade payables divided by total assets; Alatalo uses trade credit provided trade receivables per sales , trade credit obtained trade credit payables per cost of goods sold and net trade credit difference between trade receivables and payables scaled by sales ; Ge and Qiu as a dependent variable use accounts payable/total assets, accounts payable/sales, accounts payable - accounts receivable /total assets, accounts payable - accounts receivable / sales.
)n our study, we examined trade credit using measures as Accounts receivable / Total assets and Accounts payable / Total assets. For the rest measures of financial performance we used formulas well-known in the financial literature, as can be viewed in table .
Data used in our study were exported from Amadeus database, a commercial electronic database provided by Bureau van Dijk. There were selected firms acting in construction sector buildings, bridges and tunnels, other civil engineering projects, roads and railways, underground railways , between and , from countries: Belgium, Germany, France and Netherlands Western European countries ; and Romania, Bulgaria, Poland and (ungary Eastern European countries . The selection of the firms was done using the following criteria: number of employees between and in the year ; sales higher than , thousand Euros for the year and non-negative values to the collection period and credit period; the firms have reported data to the interval analysed, and resulted firms with totally , observations.
Further, data were corrected by some routine checks and were eliminated observations with inconclusive values. After the adjustments totally , observations remained for the analyses. The case study was used as a research method in the study. Data are organized in the form of unbalanced panel-data because the sample contains firms acting in the construction sector where in the period analysed - was registered a high fluctuation of firms because of founding and liquidation of many firms. Analyses are performed using Stata software package.
3. Summary statistics analysis
)n this section we performed a short analysis of the data used. Related to how firms’ observations are distributed per country, it can be noticed that Romania . % , France . % , Bulgaria . % and Belgium . % are countries with more observations, while rest with less . % together , the lower number of observation being registered by (ungary with . % Table .
Table . Distribution of firms’ observations on country and NACE code
NACE code Country Firm
4100 4110 4120 4210 4211 4212 4213 4291 4299
BE BG DE FR (U NL PL
RO ,
Total , ,
The frequencies per country and NACE Table show us that majority of observations come from NACE code . % and . % . Many of the observations for firms with NACE code come from Romania . % . Majority of observations come from unconsolidated independent firms . % . Again majority of observations come from Romania . % , followed by France . % , Bulgaria . % , etc.
)nitially firms were divided in three categories: small, medium and large. A small firm is considered if number of employees is between - ; a medium - ; and a large if number of employees is , or higher. The sample composition denotes that majority of selected firms are medium % , followed then by large firms % . Due to lack of information for number of employees some firms couldn’t be classified and they are presented as blank . % . For these reasons further analyses are focused just on medium and large firms.
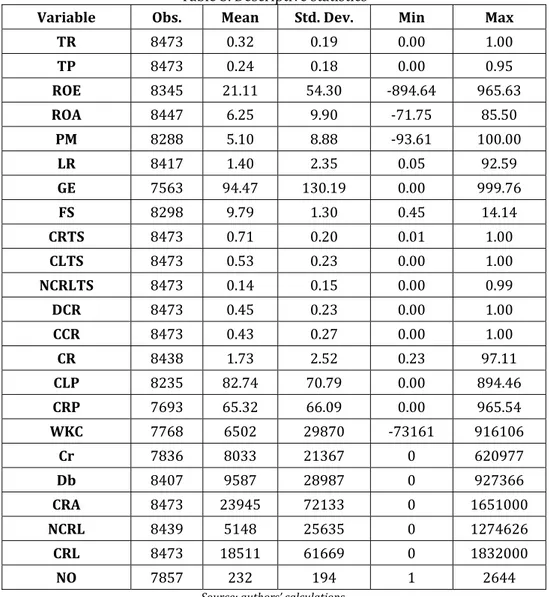
Descriptive statistics presented in the table include: number of observations, mean, standard deviation, minimum and maximum. Examined firms have at least one to maximum employees over the period analysed, the mean being employees. On average examined firms have % trade receivables, whereas trade payables are % to total assets. That means studied firms for the examined period have sold more than have bought on credit. This is confirmed also with collection period that is around days whereas credit period is days.
Table . Descriptive statistics
Variable Obs. Mean Std. Dev. Min Max
TR . . . .
TP . . . .
ROE . . - . .
ROA . . - . .
PM . . - . .
LR . . . .
GE . . . .
FS . . . .
CRTS . . . .
CLTS . . . .
NCRLTS . . . .
DCR . . . .
CCR . . . .
CR . . . .
CLP . . . .
CRP . . . .
WKC
-Cr
Db
CRA
NCRL
CRL
NO
Source: authors’ calculations.
This situation shows a high capacity to cover current liabilities by accounts receivable, financial short-term investments and cash and cash equivalent.
On average, working capital has a positive value, that show inventories and debtors are higher than creditors on short-term. Firms on average are profitable; the profitability is measured by return on equity . % , return on assets . % and profit margin . % . On average, we can talk about a real profitability, taking into account that the profitability measures are higher than European Union countries inflation rates, in the period - , the inflation rate of EU countries being lower than % for more see Eurostat data .
Accounts receivable to current assets on average are % whereas accounts payable to current liabilities are %. Current assets to total assets are on average %. This in turn means that % are long-term assets. Current liabilities respectively non-current liabilities to total assets are %, respectively %. This mean that total assets are financed more with current rather than non-current liabilities. But, overall total assets are financed % by liabilities that it means the rest part % is financed by capital. Gearing on average is . %. The high percentage of gearing indicates that shareholder funds in comparison with non-current liabilities and loans are enough lower.
4. Correlations analysis
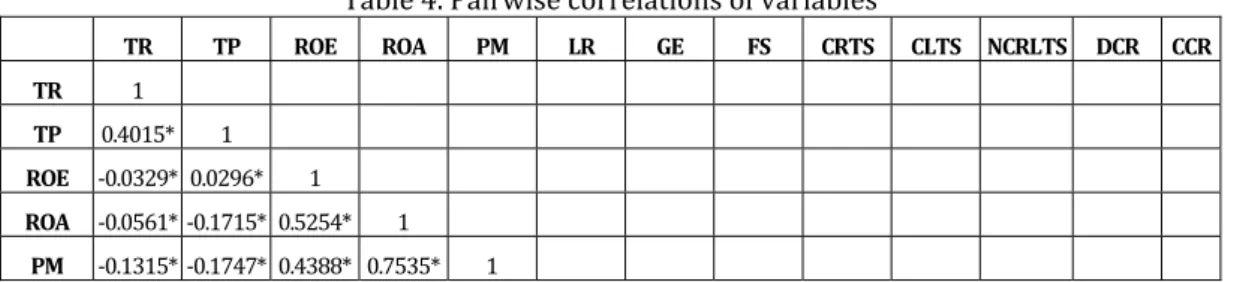
The analysis is continued for detecting correlations between variables selected. Thus, Table shows pairwise correlation results for all countries for selected variables.
As result shows between TR and TP and CRTS there is a significant fairly positive correlation. )t means that firms have sold and bought on credit, but not in the same level. A significant positive correlation is between TR and DCR. Since, TR is short-term asset that means an increase of TR inevitably increases current assets or portion of debtors to current assets.
There is a slightly significant positive correlation between TR and CLTS and CCR that shows to a lesser extent trade receivables increase when increase the share of current liabilities to total assets and the share of creditors in total current liabilities. This means that firms with higher TR have higher current liabilities to total assets ratio and creditors to current liabilities ratio. A slightly significant negative correlation was found between TR and NCRLTS that shows firms with higher TR used less non-current liabilities to total assets ratio. )n turn, this means that TR is financed more with current rather than non-current liabilities.
A very weak significant negative correlation is between TR and PM, GE, ROA and ROE while between TR and FS is a very weak significant positive relationship that means these variables not influence so much the level of trade receivables. Only PM has the coefficient - . and may show that firms with higher trade receivables are less profitable and used less gearing than counterparties. Also, an insignificant correlation was found between TR and LR.
Larger firms have offered to clients more trade credit than counterparties firms. On the other hand, larger firms have bought more on credit from suppliers than counterparties. Firm’s size is more correlated with TP than TR, but both correlations are weak.
Our results show that firms used trade credit instead of other financial debts but not in a high measure. We found a significant positive relationship between TP and CCR that show an increase of trade payable when the share of creditors to current liabilities increase. A fairly significant positive correlation is between TP and CLTS and CRTS that show an increase in trade payable determine an increase in the share of current liabilities and respectively current assets to total assets. With other words, when firms use more trade payable may sell more on credit to the customers.
A slightly significant positive correlation was found between TP and FS while a slightly significant negative relationship was found between TP and NCRLTS that show the increase in trade payable not increase so much firm’s sales while the increase in trade payables not decrease largely the share of non-current liabilities to total assets.
Table . Pairwise correlations of variables
TR TP ROE ROA PM LR GE FS CRTS CLTS NCRLTS DCR CCR
TR
TP . *
ROE - . * . *
ROA - . * - . * . *
TR TP ROE ROA PM LR GE FS CRTS CLTS NCRLTS DCR CCR
LR - . - . * - . . * . *
GE - . * . - . * - . * - . * - . *
FS . * . * . * - . * - . * - . * . *
CRTS . * . * . * . - . . * . . *
CLTS . * . * . * - . * - . * - . * . * . * . *
NCRLTS - . * - . * - . * - . * - . * . * . * . * - . * - . *
DCR . * . * - . * - . * - . * - . * - . * . - . * . * - . *
CCR . * . * - . * - . * - . * - . - . * . * . * . * - . * . *
* Significance level %
TR – trade receivables; TP – trade payables; ROE – return on equity; ROA – return on assets; PM – profit margin; LR – liquidity ratio; GE – gearing; FS – firm’s size; CRTS – current assets to total assets; CLTS – current liabilities to total assets; NCRLTS – non-current liabilities to total assets; DCR – debtors to current assets; CCR – creditors to current liabilities.
Source: authors’ calculations.
Our analysis shows a very weak significant negative relationship between TP and PM, ROA and LR while a very weak significant positive relationship was found between TP and DCR and ROE. These shows when firms increase the use of trade payable, increase in a small extent the use of trade receivable, firms that increase the use of trade payable are less profitable and liquid as show ROA,PM and LR. An insignificant correlation we found between TP and GE.
Since, TP is current liability that means an increase in TP inevitably increases portion to current liabilities and hence to total assets. But, also is evidenced that firms with higher TP have higher current assets to total assets and debtors to current liabilities ratio. Results are signalling the fairly positive relationship that exist between TR, TP, their portions to respectively current assets and liabilities, and finally to total assets.
ROE is fairly positive correlated with ROA and PM that means return on equity increase when firms register an increase in operational profitability. Very weak significant positive correlations were found between ROE and CLTS, CRTS and FS, while very weak significant negative correlations we found between ROE and DCR, GE, NCRLTS and CCR.
(ence, firms with higher ROE used less gearing, non-current liabilities to total assets and have lower debtors to current assets, respectively creditors to current liabilities ratio. On the other hand, larger firms have higher ROE, lower ROA, PM and LR, and used less more gearing.
ROA is significantly positive correlated with PM that shows both indicators reflect the operational profitability of firms. There is a slightly significant negative correlation between ROA and GE and CLTS that means return on assets increase when firms use less debt. Very weak significant negative correlations were found between ROA and NCRLTS, FS, CCR and DCR, while very weak significant positive correlations we found between ROA and LR. But, we have also evidence that shows that firms with higher ROA are liquid too. Moreover, firms with higher ROA used less GE, current and non-current liabilities to total assets; and have lower debtors to current assets, respectively creditors to current liabilities.
PM is very weak negative correlated with CLTS, GE, DCR, NCRLTS and CCR and very weak positive correlated with LR. These show that firms with higher PM are more liquid. Moreover, firms with higher PM used less gearing, current and non-current liabilities to total assets; and have lower debtors to current assets, respectively creditors to current liabilities. For both ROA and PM, our results show an insignificant correlation with CRTS, as well as for ROE with LR, LR with CCR, GE with CRTS and FS with DCR.
LR has a slightly negative significant correlation with CLTS which show that more liquid firms used less current liabilities. There is a very weak significant negative correlation between LR and FS, GE and DCR while there is a very weak significant positive correlation between LR and NCRLTS and CRTS. Thus, more liquid firms used less gearing, have higher current assets to total assets and non-current liabilities to total assets. Moreover, more liquid firms have lower non-current liabilities to total assets, and lower debtors to current assets.
which show that firms that used more gearing have lower debtors to current assets, respectively creditors to current liabilities.
FS is slightly significant positive correlated with CRTS and CLTS, and very weak with CCR and NCRLTS. This means that larger firms have higher current assets, current and non-current liabilities to total assets, and higher creditors to current liabilities ratios. CRTS is fairly positive correlated with CLTS, and slightly with CCR that show that firms use more current assets when use more current liabilities, especially trade payables. CRTS is slightly negative correlated with NCRLTS, and very weak with DCR that show that firms use more current assets when use less long-term debts and trade receivables.
CLTS is fairly negative correlated with NCRLTS, and very weak positive correlated with DCR and CCR that show firms use more current liabilities when use less long-term debts and use more trade receivables and payables. NCRLTS is very weak negative correlated with DCR and CCR that show also, firms use more long-term debts when use less trade receivables and payables. DCR is very weak positive correlated with CCR that show firms use more trade receivables when use more trade payables.
Trade credit as a concept is not isolated from other financial and economic measures. (ence, knowing some others indicators is welcomed and better interpretations can be given. Results show that selected firms have more short-term than long-term assets, i.e. % versus %. On the other hand, assets are financed % by short-term liabilities, % long-term percent and rest part of course is capital. So, firms are financed more with debt rather than capital.
5. Conclusions
Considering the features of sample selected, the characteristics of the countries studied, of the constructions sector, and world economy evolution with its influence in the economy of the countries in the period analysed, the results of our study suggest that: firms with higher trade receivables are less profitable whereas Cull et al. found that the profitable private firms are more likely to extend trade credit than unprofitable ones; larger firms have provided and obtained more trade credit than medium firms; more profitable firms have used less gearing; firms with higher profit margin are more liquid; more liquid firms have used less gearing; there are no significant differences for trade receivables and payables between medium and larger firms.
Related to the effects of financial performance indicators, we can conclude by the study that TR and TP are correlated by the same factors and approximately in the same direction. Results denoted that selected firms on average sold more than bought on credit. Profitable firms offered less credit, while more liquid firms used less credit from suppliers. Firms with higher current assets and current liabilities to total assets ratios offered and used in same time more credit than counterparties.
The preliminary analysis performed helps us to continue the study of the construction sector, using more advanced methodology in the next researches on trade credit and financial performance of firms.
Acknowledgements
This study had been possible thanks to the project MoRAS, developed by Dunarea de Jos” University of Galaţi, funded by the SOP )EC, SM)S-CNSR - , no. / . . , that made possible the acquisition of the Amadeus Database provided by Bureau van Dijk Electronics, used for data extraction.
References
1. Albuquerque, R., Ramadorai, T., Watugala, S.W. (2015). “Trade credit and cross-country predictable firm
returns”, Journal of Financial Economics, Vol. 115, Issue 3, pp. 592–613, DOI:10.1016/j.jfineco.2014.10.007
2. Alatalo, R. (2010). “Trade credit use during a financial crisis: evidence from the U.K. of a non-existing trade credit
channel”, Aalto University, School of Economics.
3. Altunok, F. (2011). “Determinants of trade credit contract terms”, North Carolina State University.
4. Bastos, R., Pindado, J. (2013). “Trade credit during a financial crisis: A panel data analysis”, Journal of Business
Research, Vol. 66, Issue 5, pp. 614–620, DOI:10.1016/j.jbusres.2012.03.015
5. Bougheas, S., Mateut, S., Mizen, P. (2009). “Corporate trade credit and inventories: New evidence of a trade-off
from accounts payable and receivable”, Journal of Banking and Finance, Vol. 33, Issue 2, pp. 300–307. DOI:10.1016/j.jbankfin.2008.07.019
6. Brennan, M.J., Maksimovic, V., Zechner, J. (1988). “Vendor financing”, Journal of Finance, Vol. 43, Issue 5, pp.
1127–1141.
7. Chant, E.M., Walker D.A. (1988). “Small business demand for trade credit”, Applied Economics, Vol. 20, pp. 861–
8. Coulibaly, B., Sapriza, H., Zlate, A. (2013). “Financial frictions, trade credit, and the 2008–09 global financial crisis”, International Review of Economics & Finance, Vol. 26, pp. 25–38, DOI:10.1016/j.iref.2012.08.006
9. Cull, R., Colin Xu, L., Zhu, T. (2009). “Formal finance and trade credit during China's transition”, Journal of
Financial Intermediation, Vol. 18, Issue 2, pp. 173–192, DOI:10.1016/j.jfi.2008.08.004
10. Delannay, A.F., Weill, L. (2004). “The determinants of trade credit in transition countries”, Economics of
Planning, Vol. 37, Issue 3-4, pp. 173-193.
11. Ferrando, A., Mulier, K. (2013). “Do firms use the trade credit channel to manage growth?”, Journal of Banking
and Finance, Vol. 37, Issue 8, pp. 3035–3046. DOI:10.1016/j.jbankfin.2013.02.013
12. Fisman, R., Love, I. (2003). “Trade credit, financial intermediary development and industry growth”, Journal of
Finance, Vol. 58, pp. 353–374.
13. Garcia-Teruel, P. J., Martinez-Solano, P. (2010). “A dynamic perspective on the determinants of accounts
payable”, Review of Quantitative Finance and Accounting, Vol. 34, Issue 4, pp. 439-457.
14. Ge, Y, Qiu, J. (2007). “Financial development, bank discrimination and trade credit”, Journal of Banking and
Finance, Vol. 31, Issue 2, pp. 513–530, DOI:10.1016/j.jbankfin.2006.07.009
15. Grave, Th. (2011). “Trade credit as a shock absorber?: The effects of the financial crisis on the use of trade credit
by Dutch manufacturing firms”. University of Twente.
16. Guariglia, A., Mateut, S. (2006). “Credit channel, trade credit channel, and inventory investment: Evidence from a
panel of UK firms”, Journal of Banking and Finance, Vol. 30, Issue 10, pp. 2835–2856, DOI:10.1016/j.jbankfin.2005.11.002
17. Huyghebaert, N. (2006). “On the determinants and dynamics of trade credit use: empirical evidence from
business start-ups”, Journal of Business Finance and Accounting, Vol. 33, Issue 1&2, pp. 305–328.
18. Kohler, M., Britton, E., Yates, T. (2000). “Trade credit and the monetary transmission mechanism”, Bank of
England, London.
19. Li, X. (2011). “Determinants of Trade Credit: A Study of Listed Firms in the Netherlands”, Master Thesis in
Business Administration, School of Management and Governance University of Twente, The Netherlands, http://essay.utwente.nl/62672/1/Determinants_of_trade_credit_0922_final.pdf.
20. Love, I., Preve, L.A., Sarria-Allende, V. (2007), “Trade credit and bank credit: Evidence from recent financial
crises”, Journal of Financial Economics, Vol. 83, Issue 2, pp. 453–469, DOI:10.1016/j.jfineco.2005.11.002.
21. Nieuwkerk, M. van (1979). „Domestic and foreign trade credit in the Netherlands”. Journal of Banking and
Finance, Vol. 3, Issue 1, pp. 83-105.
22. Nilsen, J.H. (2002). “Trade credit and the bank lending channel”. Journal of Money, Credit, and Banking, Vol. 34,
pp. 226–253, DOI: 10.1353/mcb.2002.0032.
23. Ono, M. (2001). “Determinants of trade credit in the Japanese manufacturing sector”, Journal of the Japanese and
International Economies, Vol. 15, pp. 160–177.
24. Petersen, M.A., Rajan, R.G. (2007). “Trade Credit: Theories and Evidence”, Review of Financial Studies, Vol. 10,
Issue 3, pp. 661-669.
25. Seifert, D., Seifert, R.W., Protopappa-Sieke, M. (2013). “A review of trade credit literature: Opportunities for
research in Operations”, European Journal of Operational Research, Vol. 231, Issue 2, pp. 245–256, DOI:10.1016/j.ejor.2013.03.016.
26. Vaidya, R.R. (2011). „The Determinants of Trade Credit: Evidence from Indian Manufacturing Firms”, Modern
Economy, Vol. 2, pp. 707-716.
27. Vintilă, G. (2000). Gestiunea financiară a întreprinderii, Didacticăşi Pedagogică Publishing House, Bucharest,
2000.
28. Wu, W., Rui, O.M., Wu, C. (2012). “Trade credit, cash holdings, and financial deepening: Evidence from a
transitional economy”, Journal of Banking and Finance, Vol. 36, Issue 11, pp. 2868–2883, DOI:10.1016/j.jbankfin.2011.04.009.
29. Yang, X. (2011). “Trade credit versus bank credit: Evidence from corporate inventory financing”, The Quarterly
Review of Economics and Finance, Vol. 51, Issue 4, pp. 419–434, DOI:10.1016/j.qref.2011.07.001.
30. *** Euro Area Inflation Rate, available at http://www.tradingeconomics.com/euro-area/inflation-cpi, accessed