Breakpoints (GIPFEL), a New Method to Detect
Translocations in Leukemia
Elisa Fueller1., Daniel Schaefer2., Ute Fischer2
, Pina F. I. Krell2, Martin Stanulla3, Arndt Borkhardt2*, Robert K. Slany1*
1Department of Genetics, Friedrich Alexander University, Erlangen, Germany,2Department of Pediatric Oncology, Hematology and Clinical Immunology, University Children’s Hospital, Medical Faculty, Heinrich Heine University, Du¨sseldorf, Germany,3Department of Pediatric Hematology and Oncology, Hannover Medical School, Hannover, Germany
Abstract
Here we present a novel method ‘‘Genomic inverse PCR for exploration of ligated breakpoints’’ (GIPFEL) that allows the sensitive detection of recurrent chromosomal translocations. This technique utilizes limited amounts of DNA as starting material and relies on PCR based quantification of unique DNA sequences that are created by circular ligation of restricted genomic DNA from translocation bearing cells. Because the complete potential breakpoint region is interrogated, a prior knowledge of the individual, specific interchromosomal fusion site is not required. We validated GIPFEL for the five most common gene fusions associated with childhood leukemia (MLL-AF4, MLL-AF9, MLL-ENL, ETV6-RUNX1, and TCF3-PBX1). A workflow of restriction digest, purification, ligation, removal of linear fragments and precipitation enriching for circular DNA was developed. GIPFEL allowed detection of translocation specific signature sequences down to a 1024dilution which is
close to the theoretical limit. In a blinded proof-of-principle study utilizing DNA from cell lines and 144 children with B-precursor-ALL associated translocations this method was 100% specific with no false positive results. Sensitivity was 83%, 65%, and 24% for t(4;11), t(9;11) and t(11;19) respectively. Translocation t(12;21) was correctly detected in 64% and t(1;19) in 39% of the cases. In contrast to other methods, the characteristics of GIPFEL make it particularly attractive for prospective studies.
Citation:Fueller E, Schaefer D, Fischer U, Krell PFI, Stanulla M, et al. (2014) Genomic Inverse PCR for Exploration of Ligated Breakpoints (GIPFEL), a New Method to Detect Translocations in Leukemia. PLoS ONE 9(8): e104419. doi:10.1371/journal.pone.0104419
Editor:Jo¨rn Lausen, Georg Speyer Haus, Germany
ReceivedApril 22, 2014;AcceptedJuly 9, 2014;PublishedAugust 19, 2014
Copyright:ß2014 Fueller et al. This is an open-access article distributed under the terms of the Creative Commons Attribution License, which permits unrestricted use, distribution, and reproduction in any medium, provided the original author and source are credited.
Data Availability:The authors confirm that all data underlying the findings are fully available without restriction. All relevant data are within the paper and its Supporting Information files.
Funding:This research was funded by a grant of the German Ministry for Radiation Protection (Bundesministerium fu¨r Strahlenschutz, BfS) grant number 3612S70019. The funders had no role in study design, data collection and analysis, decision to publish, or preparation of the manuscript.
Competing Interests:The authors have declared that no competing interests exist. * Email: arndt.borkhardt@med.uni-duesseldorf.de (AB); robert.slany@fau.de (RKS)
.These authors contributed equally to this work.
Introduction
The realization that certain subtypes of leukemia are invariably associated with recurrent genomic abnormalities was a seminal discovery in leukemia research. This was first recognized in conjunction with chronic myeloid leukemia and the paradigmatic Philadelphia chromosome [1]. Nowadays we know that this is a widespread phenomenon. The determination of genotype has become essential for diagnosis, stratification, treatment planning and prognosis of hematological malignancies. Particularly in infant and childhood leukemia almost half of all diagnosed cases are characterized by the persistent appearance of distinctive chromo-somal translocations [2].
Because of the importance of these genetic markers for clinical management a series of methods has been devised that allows the detection of the underlying genetic lesion. Cytogenetics and fluorescent in situ hybridization (FISH) are generally applied to demonstrate the presence and overall structure of genomic alterations. However, both approaches require mitotic cells,
To avoid these pitfalls, we devised a novel method that can detect chromosomal translocations at the DNA level creating constant, predictable, and quantifiable amplicons. This technique, that we called GIPFEL (genomic inverse PCR for exploration of ligated breakpoints) utilizes the fact that genomic breakpoints are usually confined to defined chromosomal regions. Restriction digest of genomic DNA followed by circularization of resulting fragments will divide even large breakpoint regions into a manageable number of DNA circles. Only cells with translocations will create a ‘‘signature’’ circle that is uniquely characteristic for the nature of the underlying genomic aberration (figure 1). These circles can be quantified by real-time PCR because the sequence of the corresponding ligation joint can be derived from the known genomic sequence and the respective location of the restriction sites within the breakpoint region. Hence corresponding ampli-cons of suitable size for real-time PCR can be designed. Positive amplification results do not only reveal the presence of a translocation but they also give topical information of the approximate localization of the genomic break. By selecting appropriate restriction enzymes even large breakpoint regions can be covered with relatively few primer/PCR reactions. Here we demonstrate proof-of-principle experiments testing GIPFEL on the five most frequent translocations in childhood leukemia t(4;11), t(9;11), t(11;19), t(12;21), and t(1;19).
Materials and Methods
Circularization of genomic DNA
Genomic DNA from clinical repositories was provided pre-purified. Samples were collected with written informed consent and all institutional and national guidelines for employing human material in research were observed. Patients were enrolled in
multicenter trial AIEOP-BFM ALL 2000 on treatment of childhood ALL. Diagnosis, characterization and treatment of ALL were performed as previously described [7,8]. The trial was approved by the institutional review board of Hannover Medical School, Hannover, Germany. Written informed consent for the use of specimen for research was obtained from all study individuals, parents or legal guardians and approved by the institutional review board.
All enzymes used in the procedure were obtained from New England Biolabs (Frankfurt/Main, Germany) and used with the appropriate buffers recommended by the manufacturer. For cell lines and buffy coats DNA was prepared from 1 to 56106 cells with the QIAampDNA Blood Mini Kit exactly according to the instructions of the manufacturer (Qiagen, Hilden, Germany).
If available, e.g. from cell lines, GIPFEL started with 2.5mg of DNA corresponding to approximately 3.86105 genome equiva-lents (calculating with 6.6 pg DNA per cell). For detection of translocations in repository DNA, the nucleic acids were either pre-amplified with REPLI-g Ultra Fast Mini Kit according to the manufacturer’s (Qiagen) instructions or, when probing for MLL translocations, only 1mg stored DNA was used directly. The DNA was incubated either with 200 units BamHI-HF (for MLL translocations) or with 200 units of SacI-HF or MfeI-HF for detection of t(12;21) and t(1;19), respectively. Reactions were set up in 100ml volume using the buffer recommended by the manufacturer and digests were performed for 2 h.
Restriction fragments were isolated by addition of 500ml buffer PB (Qiagen) to the digestion reaction and a subsequent purification on QIAquick gel extraction columns (Qiagen) according to the instructions of the manufacturer. To improve recovery of longer fragments elution was done with 50ml of deionized water pre-warmed to 60uC and columns were incubated for 5 minutes at 60uC before final centrifugation.
Religation was performed for 2 h at 24uC in a 100ml reaction using the total column eluate and 2ml (800 units) of T4-DNA ligase and the appropriate buffer. After ligation linear DNA fragments were digested by addition of 1ml (100 units) of exonuclease III and incubation for 30 min at 37uC with a subsequent 5 min heat inactivation at 95uC.
Enriched circular DNA was concentrated by standard alcohol precipitation.
Primer design and semi-nested real time PCR
In silico predictions were done deriving the sequences of all possible ligation junctions that would be created from religation of a genomic fragment carrying a chromosomal breakpoint. Primers spanning ligation sites were designed to generate amplicons suitable for real time PCR (see table 1 and table S1) (https://eu. idtdna.com/analyzer/Applications/OligoAnalyzer/) [9]. To re-strict the number of PCRs necessary to include the complete breakpoint region sometimes closely spaced (,1 kb) restriction sites were covered only by a single primer.
All PCR reactions were performed with BrilliantII SYBR green PCR Master Mix from Agilent Technologies (St. Clara, CA, USA) in standard 25ml reactions using a final primer concentration of 100 nM. For first round PCR 5ml of circularized DNA corresponding to approximately 1.96105 genome equivalents served as template. Cycle conditions were 10 min initial denatur-ation, followed by 22 cycles of 15 s 95uC, 30 s 64uC, 30 s 72uC for MLL translocations. Translocation t(12;21) and t(1;19) samples were pre-amplified with 25 cycles.
Oneml of primary PCR product was used as input for each secondary PCR. Reactions were monitored on an optical cycler Figure 1. Basic principle of GIPFEL. Upon restriction digest and
circularization of genomic DNA only genomic DNA from translocation bearing cells will form circles that join DNA of two different chromosomes. The junction is predetermined by the location of the genomic breakpoint. By probing for all possible ligation junctions with PCR the presence of a translocation can be ascertained.
doi:10.1371/journal.pone.0104419.g001
DNA Based Detection of Translocations
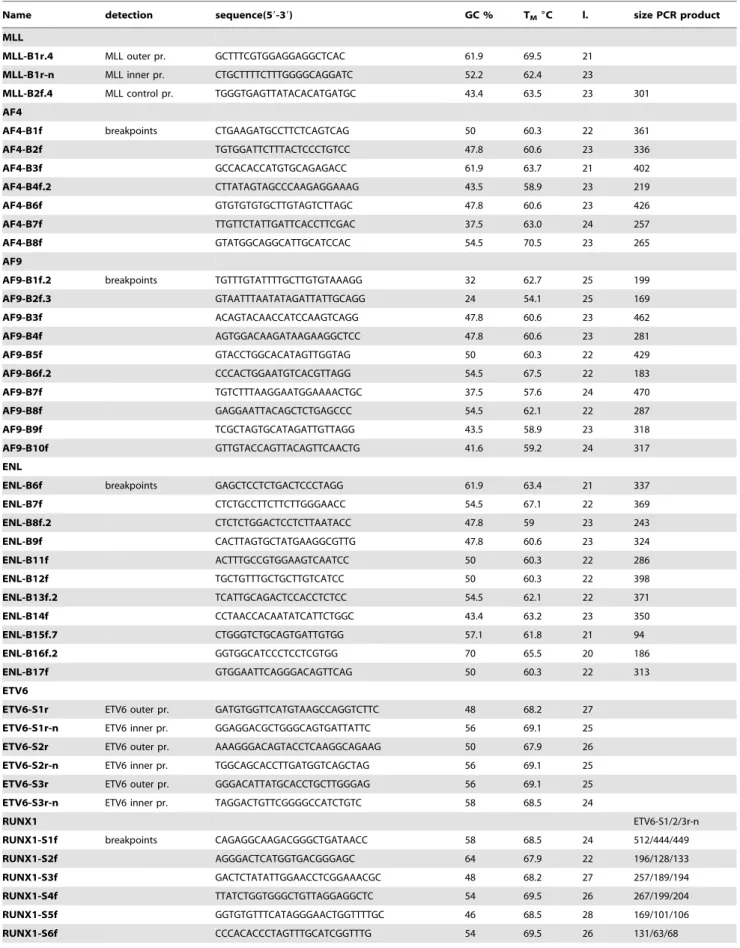
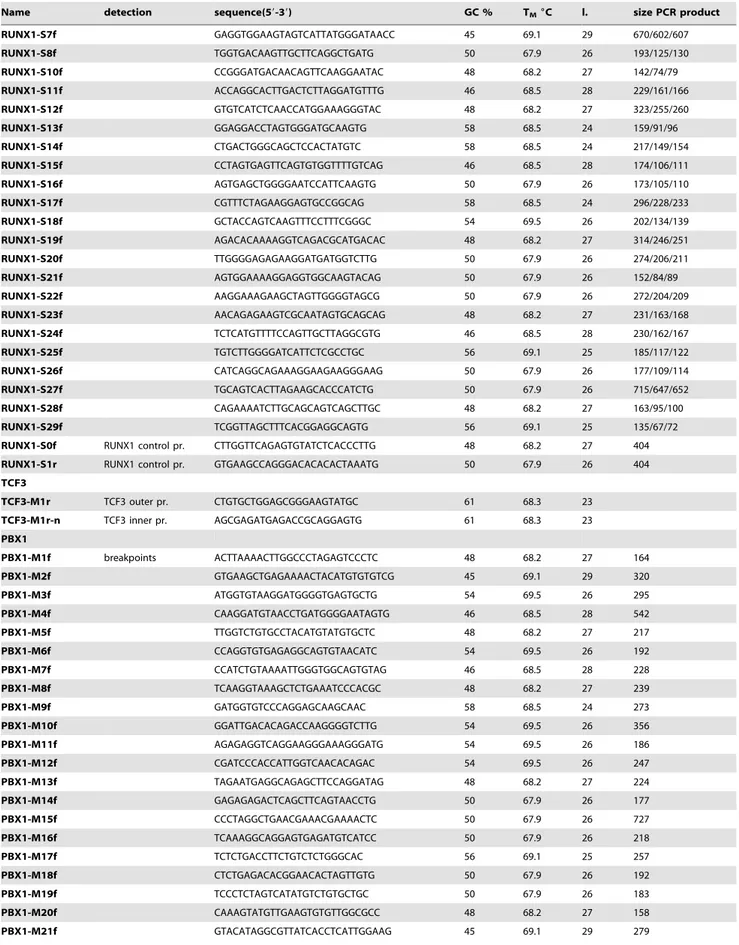
Table 1.Primers used for GIPFEL.
Name detection sequence(59-39) GC % TM6C l. size PCR product
MLL
MLL-B1r.4 MLL outer pr. GCTTTCGTGGAGGAGGCTCAC 61.9 69.5 21
MLL-B1r-n MLL inner pr. CTGCTTTTCTTTGGGGCAGGATC 52.2 62.4 23
MLL-B2f.4 MLL control pr. TGGGTGAGTTATACACATGATGC 43.4 63.5 23 301
AF4
AF4-B1f breakpoints CTGAAGATGCCTTCTCAGTCAG 50 60.3 22 361
AF4-B2f TGTGGATTCTTTACTCCCTGTCC 47.8 60.6 23 336
AF4-B3f GCCACACCATGTGCAGAGACC 61.9 63.7 21 402
AF4-B4f.2 CTTATAGTAGCCCAAGAGGAAAG 43.5 58.9 23 219
AF4-B6f GTGTGTGTGCTTGTAGTCTTAGC 47.8 60.6 23 426
AF4-B7f TTGTTCTATTGATTCACCTTCGAC 37.5 63.0 24 257
AF4-B8f GTATGGCAGGCATTGCATCCAC 54.5 70.5 23 265
AF9
AF9-B1f.2 breakpoints TGTTTGTATTTTGCTTGTGTAAAGG 32 62.7 25 199
AF9-B2f.3 GTAATTTAATATAGATTATTGCAGG 24 54.1 25 169
AF9-B3f ACAGTACAACCATCCAAGTCAGG 47.8 60.6 23 462
AF9-B4f AGTGGACAAGATAAGAAGGCTCC 47.8 60.6 23 281
AF9-B5f GTACCTGGCACATAGTTGGTAG 50 60.3 22 429
AF9-B6f.2 CCCACTGGAATGTCACGTTAGG 54.5 67.5 22 183
AF9-B7f TGTCTTTAAGGAATGGAAAACTGC 37.5 57.6 24 470
AF9-B8f GAGGAATTACAGCTCTGAGCCC 54.5 62.1 22 287
AF9-B9f TCGCTAGTGCATAGATTGTTAGG 43.5 58.9 23 318
AF9-B10f GTTGTACCAGTTACAGTTCAACTG 41.6 59.2 24 317
ENL
ENL-B6f breakpoints GAGCTCCTCTGACTCCCTAGG 61.9 63.4 21 337
ENL-B7f CTCTGCCTTCTTCTTGGGAACC 54.5 67.1 22 369
ENL-B8f.2 CTCTCTGGACTCCTCTTAATACC 47.8 59 23 243
ENL-B9f CACTTAGTGCTATGAAGGCGTTG 47.8 60.6 23 324
ENL-B11f ACTTTGCCGTGGAAGTCAATCC 50 60.3 22 286
ENL-B12f TGCTGTTTGCTGCTTGTCATCC 50 60.3 22 398
ENL-B13f.2 TCATTGCAGACTCCACCTCTCC 54.5 62.1 22 371
ENL-B14f CCTAACCACAATATCATTCTGGC 43.4 63.2 23 350
ENL-B15f.7 CTGGGTCTGCAGTGATTGTGG 57.1 61.8 21 94
ENL-B16f.2 GGTGGCATCCCTCCTCGTGG 70 65.5 20 186
ENL-B17f GTGGAATTCAGGGACAGTTCAG 50 60.3 22 313
ETV6
ETV6-S1r ETV6 outer pr. GATGTGGTTCATGTAAGCCAGGTCTTC 48 68.2 27
ETV6-S1r-n ETV6 inner pr. GGAGGACGCTGGGCAGTGATTATTC 56 69.1 25
ETV6-S2r ETV6 outer pr. AAAGGGACAGTACCTCAAGGCAGAAG 50 67.9 26
ETV6-S2r-n ETV6 inner pr. TGGCAGCACCTTGATGGTCAGCTAG 56 69.1 25
ETV6-S3r ETV6 outer pr. GGGACATTATGCACCTGCTTGGGAG 56 69.1 25
ETV6-S3r-n ETV6 inner pr. TAGGACTGTTCGGGGCCATCTGTC 58 68.5 24
RUNX1 ETV6-S1/2/3r-n
RUNX1-S1f breakpoints CAGAGGCAAGACGGGCTGATAACC 58 68.5 24 512/444/449
RUNX1-S2f AGGGACTCATGGTGACGGGAGC 64 67.9 22 196/128/133
RUNX1-S3f GACTCTATATTGGAACCTCGGAAACGC 48 68.2 27 257/189/194
RUNX1-S4f TTATCTGGTGGGCTGTTAGGAGGCTC 54 69.5 26 267/199/204
RUNX1-S5f GGTGTGTTTCATAGGGAACTGGTTTTGC 46 68.5 28 169/101/106
Table 1.Cont.
Name detection sequence(59-39) GC % TM6C l. size PCR product
RUNX1-S7f GAGGTGGAAGTAGTCATTATGGGATAACC 45 69.1 29 670/602/607
RUNX1-S8f TGGTGACAAGTTGCTTCAGGCTGATG 50 67.9 26 193/125/130
RUNX1-S10f CCGGGATGACAACAGTTCAAGGAATAC 48 68.2 27 142/74/79
RUNX1-S11f ACCAGGCACTTGACTCTTAGGATGTTTG 46 68.5 28 229/161/166
RUNX1-S12f GTGTCATCTCAACCATGGAAAGGGTAC 48 68.2 27 323/255/260
RUNX1-S13f GGAGGACCTAGTGGGATGCAAGTG 58 68.5 24 159/91/96
RUNX1-S14f CTGACTGGGCAGCTCCACTATGTC 58 68.5 24 217/149/154
RUNX1-S15f CCTAGTGAGTTCAGTGTGGTTTTGTCAG 46 68.5 28 174/106/111
RUNX1-S16f AGTGAGCTGGGGAATCCATTCAAGTG 50 67.9 26 173/105/110
RUNX1-S17f CGTTTCTAGAAGGAGTGCCGGCAG 58 68.5 24 296/228/233
RUNX1-S18f GCTACCAGTCAAGTTTCCTTTCGGGC 54 69.5 26 202/134/139
RUNX1-S19f AGACACAAAAGGTCAGACGCATGACAC 48 68.2 27 314/246/251
RUNX1-S20f TTGGGGAGAGAAGGATGATGGTCTTG 50 67.9 26 274/206/211
RUNX1-S21f AGTGGAAAAGGAGGTGGCAAGTACAG 50 67.9 26 152/84/89
RUNX1-S22f AAGGAAAGAAGCTAGTTGGGGTAGCG 50 67.9 26 272/204/209
RUNX1-S23f AACAGAGAAGTCGCAATAGTGCAGCAG 48 68.2 27 231/163/168
RUNX1-S24f TCTCATGTTTTCCAGTTGCTTAGGCGTG 46 68.5 28 230/162/167
RUNX1-S25f TGTCTTGGGGATCATTCTCGCCTGC 56 69.1 25 185/117/122
RUNX1-S26f CATCAGGCAGAAAGGAAGAAGGGAAG 50 67.9 26 177/109/114
RUNX1-S27f TGCAGTCACTTAGAAGCACCCATCTG 50 67.9 26 715/647/652
RUNX1-S28f CAGAAAATCTTGCAGCAGTCAGCTTGC 48 68.2 27 163/95/100
RUNX1-S29f TCGGTTAGCTTTCACGGAGGCAGTG 56 69.1 25 135/67/72
RUNX1-S0f RUNX1 control pr. CTTGGTTCAGAGTGTATCTCACCCTTG 48 68.2 27 404
RUNX1-S1r RUNX1 control pr. GTGAAGCCAGGGACACACACTAAATG 50 67.9 26 404
TCF3
TCF3-M1r TCF3 outer pr. CTGTGCTGGAGCGGGAAGTATGC 61 68.3 23
TCF3-M1r-n TCF3 inner pr. AGCGAGATGAGACCGCAGGAGTG 61 68.3 23
PBX1
PBX1-M1f breakpoints ACTTAAAACTTGGCCCTAGAGTCCCTC 48 68.2 27 164
PBX1-M2f GTGAAGCTGAGAAAACTACATGTGTGTCG 45 69.1 29 320
PBX1-M3f ATGGTGTAAGGATGGGGTGAGTGCTG 54 69.5 26 295
PBX1-M4f CAAGGATGTAACCTGATGGGGAATAGTG 46 68.5 28 542
PBX1-M5f TTGGTCTGTGCCTACATGTATGTGCTC 48 68.2 27 217
PBX1-M6f CCAGGTGTGAGAGGCAGTGTAACATC 54 69.5 26 192
PBX1-M7f CCATCTGTAAAATTGGGTGGCAGTGTAG 46 68.5 28 228
PBX1-M8f TCAAGGTAAAGCTCTGAAATCCCACGC 48 68.2 27 239
PBX1-M9f GATGGTGTCCCAGGAGCAAGCAAC 58 68.5 24 273
PBX1-M10f GGATTGACACAGACCAAGGGGTCTTG 54 69.5 26 356
PBX1-M11f AGAGAGGTCAGGAAGGGAAAGGGATG 54 69.5 26 186
PBX1-M12f CGATCCCACCATTGGTCAACACAGAC 54 69.5 26 247
PBX1-M13f TAGAATGAGGCAGAGCTTCCAGGATAG 48 68.2 27 224
PBX1-M14f GAGAGAGACTCAGCTTCAGTAACCTG 50 67.9 26 177
PBX1-M15f CCCTAGGCTGAACGAAACGAAAACTC 50 67.9 26 727
PBX1-M16f TCAAAGGCAGGAGTGAGATGTCATCC 50 67.9 26 218
PBX1-M17f TCTCTGACCTTCTGTCTCTGGGCAC 56 69.1 25 257
PBX1-M18f CTCTGAGACACGGAACACTAGTTGTG 50 67.9 26 192
PBX1-M19f TCCCTCTAGTCATATGTCTGTGCTGC 50 67.9 26 183
PBX1-M20f CAAAGTATGTTGAAGTGTGTTGGCGCC 48 68.2 27 158
PBX1-M21f GTACATAGGCGTTATCACCTCATTGGAAG 45 69.1 29 279
DNA Based Detection of Translocations
for 40 to 45 cycles under conditions as in first round PCR reaction. The multiplexing scheme is given in table 2.
To avoid contamination by airborne DNA, all PCR reactions were assembled under clean-room conditions in an UV-sterilized PCR cabinet with separate equipment and rooms for pre- and post-PCR procedures.
Evaluation of results
A sample was scored as PCR-positive if a primer pair specific for a translocation circle yielded a threshold cycle (CT) that was clearly decreased compared to the cohort of all other primer pairs. Positive real time products were run on standard agarose gels for determination of size. In addition DNA was isolated from the gel and sequenced from both sides using the PCR amplification primers.
The higher number of primers necessary to cover the t(12;21) and t(1;19) breakpoint region mandated multiplexing also during the second round of PCR. Therefore positively scoring products obtained with a primer pool were re-tested in a third round PCR using single forward primers.
Results
Validation of the GIPFEL procedure
To generate a genomic DNA preparation enriched in circular ligated DNA a 4-step biochemical procedure was developed (figure 2A). After digestion of genomic DNA and purification of a genome wide population of restriction fragments the nucleic acid was converted to circular form by ligation in a large volume. Remaining linear fragments were removed by digesting with exonuclease III followed by alcohol precipitation to prepare a template for PCR analysis.
PCR was designed in a semi-nested setup (figure 2B) pre-amplifying with an outer anchor primer (three primers for ETV6) binding to sequences of the 59 fusion portion. This primer was paired with pools of downstream primers corresponding to the
predicted 39 fusion sequence. The reaction products of this primary PCR served as input for the next round of PCR. Secondary PCRs were monitored with SYBR green on a real time machine using a 59 inner primer (three primers for ETV6) and either each downstream primer in individual combination (for MLL fusion proteins) or again pools of downstream primers (see Table 1 for primer sequences and Table 2 for multiplexing strategies). Primers amplifying a nearby genomic region unaffected by the translocation were employed alongside as controls. For further evaluation amplified PCR products were sized on agarose gels, isolated and sequenced (figure 2C). A sample was scored positive if the size and the predicted sequence of a PCR product could be unequivocally confirmed (see Table S1 for a list of predicted ligation joint sequences).
To evaluate the efficiency of the overall process we validated the procedure with DNA from three cell lines: MV4;11 carries a t(4;11), REH contains t(12;21) and 697 was used to detect t(1;19). For all lines the exact location of the breakpoint is known obviating the need for multiplexing in the set-up experiments. DNA from cell lines negative for the translocations to be tested (HL60, 697, REH) served as background control. Translocation bearing cells were mixed in various ratios with control cells and the GIPFEL procedure was performed (figure 3). Under these optimal conditions detection of signature circles was possible for all translocations down to a dilution of 1 into 1024. This dilution is equivalent to a calculated presence of 19 target molecules per PCR reaction (2.5mg DNA = 3.86105 cells61024= 38 but because only 50% of the circularization reaction was used as template for PCR, effectively a calculated maximum of 19 template molecules have been present).
To further validate the method on actual patient samples, DNA was obtained from clinical repositories. A collection was assembled encompassing 21 MLL-AF4, 16 MLL-AF9, 18 MLL-ENL, 60 ETV6-RUNX1, and 30 TCF3-PBX1 cases. Five negative control samples were added to each translocation group and the samples were blinded for processing. Because of the limited amount of the Table 1.Cont.
Name detection sequence(59-39) GC % TM6C l. size PCR product
PBX1-M22f GACCCCTTCTCTCTTAACTCATAATGGC 46 68.5 28 276
PBX1-M23f CAGGAACAAGAACAAGAAGGCATGTAGG 46 68.5 28 199
PBX1-M24f AGCATCATAGGTGACAAGGGGCCATG 54 69.5 26 164
PBX1-M25f TGCCTGGTGCATGTTAAGCCTCACAG 54 69.5 26 234
PBX1-M26f TAGAACATGCAGAATGCCCACCGTGG 54 69.5 26 183
PBX1-M27f TGAGTGTGTTGGTACCGATGTGTGGC 54 69.5 26 147
PBX1-M28f GTGAATGCCTGTGTGTACACTTAACGTG 46 68.5 28 253
PBX1-M29f CTGGCGTCATAACAGAAGTAGTCACAG 48 68.2 27 268
PBX1-M30f TGGCATCTGAAGCACCTGTCCTAATG 50 67.9 26 205
PBX1-M31f CTGAGCTTGACCTTCCAGTCGTCTTC 54 69.5 26 204
PBX1-M32f TTGGCATTGTGACCAGGAGATCTATTGC 46 68.5 28 243
PBX1-M33f GATGCAAGGGAACAATTACTGGACTGTTC 45 69.1 29 346
PBX1-M34f ACATTCTGAGGAAGATACATGGTTGTTCC 41 67.4 29 177
PBX1-M35f TGGTGGTAATGGGGTTGGTGGGATAG 54 69.5 26 328
PBX1-M36f ATACACACATGCACGTAACACCCCAAAG 46 68.5 28 167
PBX1-M0f PBX1 control pr. GCCCTGTAACCTGGGAGGTCTATTAG 54 69.5 26 298
PBX1-M1r PBX1 control pr. AACCATCTGTGGAGTGCCCGGATTAG 54 69.5 26 298
Table 2.Multiplexing strategy for GIPFEL analysis.
MLLAF4* anchor pr. #1 #2 #3 #4 control
PCR1 MLL-B1r.4+ B1f+B2f+B3f B4f.2+B6f+B7f B8f MLL-B2f.4
PCR2 anchor pr. #1 #2 #3 #4 #5 #6 #7 #8 control
MLL-B1r.n+ B1f B2f B3f B4f.2 B6f B7f B8f MLL-B2f.4
MLLAF9* anchor pr. #1 #2 #3 #4 #5 control
PCR1 MLL-B1r.4+ B1f.2+B2f.3+B3f B4f+B5f+B6f.2 B7f+B8f+B9f B10f MLL-B2f.4
anchor pr. #1 #2 #3 #4 #5 #6 #7 #8 #9 #10 #11 control
PCR2 MLL-B1r.n+ B1f.2 B2f.3 B3f B4f B5f B6f.2 B7f B8f B9f B10f MLL-B2f.4
MLLENL* anchor pr. #1 #2 #3 #4 #5 control
PCR1 MLL-B1r.4+ B6f+B7f+B8f.2 B9f+B11+B12f B13f.2+B14f+15f.7 B16f.2+B17f MLL-B2f.4
anchor pr. #1 #2 #3 #4 #5 #6 #7 #8 #9 #10 #11 #12 control
PCR2 MLL-B1r.n+ B6f B7f B8f B9f B11f B12f B13f.2 B14f B15f.7 B16f.2 B17f MLL-B2f.4
ETV6-RUNX1 anchor pr. #1 #2 #3 #4 #5 control
PCR1 ETV6- S1r+ S2r+S3r+
S12f+S15f+S17f+S22f+S23f+ S26f+S28f
S1f+S4f+S10f+S11f+ S14f+S24f+S27f
S2f+S6f+S7f+S8f+S18f+ S20f+S29f
S3f+S5f+S13f+S16f+S19f+ S21f+S25f
RUNX1-S0f+S1r (no anchor)
anchor pr. #1 #2 #3 #4 #5 control
PCR2{ ETV6- S1r-n
+ S2r-n+S3r-n+
S12f+S15f+S17f+S22f+S23f+ S26f+S28f
S1f+S4f+S10f+S11f+ S14f+S24f+S27f
S2f+S6f+S7f+S8f+S18f+ S20f+S29f
S3f+S5f+S13f+S16f+S19f+ S21f+S25f
RUNX1-S0f+S1r (no anchor)
TCF3-PBX1 anchor pr. #1 #2 #3 #4 #6 control
PCR1 TCF3-M1r+ M1f+M6f+M12f+M13f+M26f+ M29f+M33f+M36f
M4f+M8f+M9f+M10f+ M16f+M21f+M23f
M2f+M11f+M20f+M25f+ M28f+M34f+M35f
M3f+M5f+M14f+M18f+M19f+ M24f+M32f
PBX1-M0f+M1r (no anchor)
#5
M7f+M15f+M17f+M22f+M27f+ M30f+M31f
anchor pr. #1 #2 #3 #4 #6 control
PCR2{
TCF3-M1r-n+ M1f+M6f+M12f+M13f+M26f+ M29f+M33f+M36f
M4f+M8f+M9f+M10f+ M16f+M21f+M23f
M2f+M11f+M20f+M25f+ M28f+M34f+M35f
M3f+M5f+M14f+M18f+M19f+ M24f+M32f
PBX1-M0f+M1r (no anchor)
#5
M7f+M15f+M17f+M22f+M27f+ M30f+M31f
*for MLL fusion proteins multiplexing was done only in the first round of semi-nested PCR.
{
for ETV6-RUNX1 and TCF3-PBX1 multiplexing was done for both rounds of PCR. For samples scoring positive, a third validation round using single primers was added. doi:10.1371/journal.pone.0104419.t002
DNA
Based
Detection
of
Transloc
ations
PLOS
ONE
|
www.ploson
e.org
6
August
2014
|
Volume
9
|
Issue
8
|
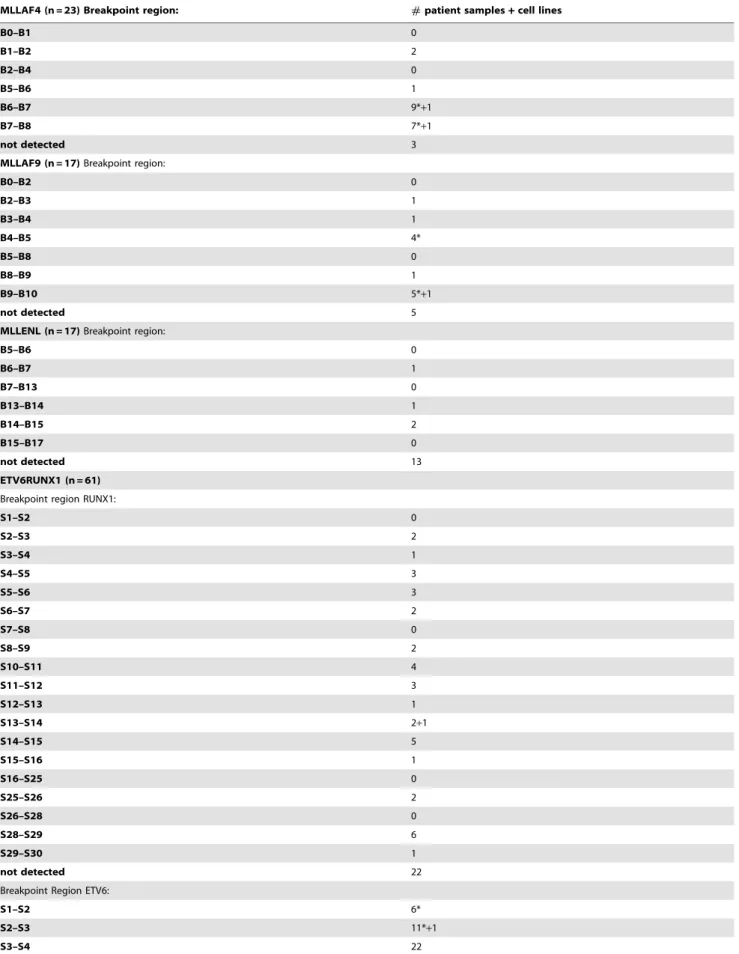
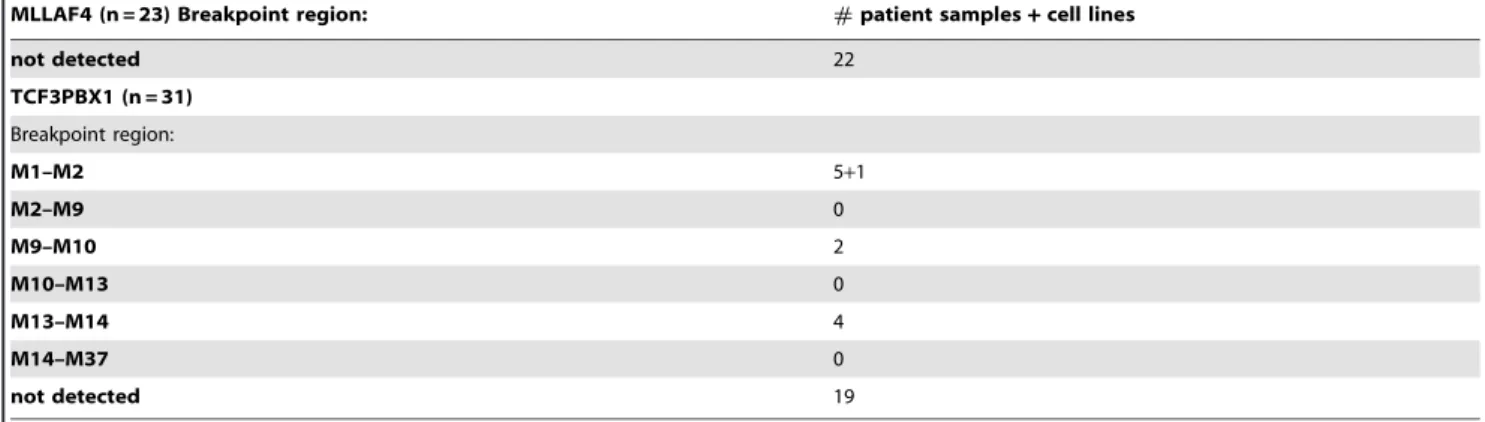
clinical material the procedure was performed with 1mg of genomic DNA as input for MLL bearing translocations. For the other translocations the DNA was genome amplified and 2.5mg were used. Again the three-tiered decision process of real-time PCR, agarose gelelectrophoresis and sequencing was applied to score the results. Representative examples of positive experiments are shown in figure 3D–F. Upon unblinding GIPFEL showed 100% specificity as no false positive results were obtained. As expected, accuracy was lower. For AF4, AF9, MLL-ENL, ETV6-RUNX1, and TCF3-PBX1, 83%, 65%, 24%, 64% and 39% of positive samples were correctly called. Sensitivity was comparable to cell line experiments. When tested with selected patient material positive samples still could be successfully called at dilutions between 1023and 1024. A summary of patient and cell line data is given in table 3. Because GIPFEL also gives topical information of the breakpoint location depending on the primer pair yielding a positive readout, a breakpoint distribution chart could be assembled (figure 4). As observed previously, chromo-somal junction sites were not randomly distributed but clustered in certain areas corresponding to known hotspots of instability giving additional support to the validity of our GIPFEL results [5,10–20].
Discussion
Here we present a proof-of-principle study demonstrating that it is possible to detect the most commonly occurring translocations in childhood leukemia using small amounts of DNA without having to resort to long range PCR or unstable RNA. The GIPFEL method relies on the prior knowledge of the genomic region where breaks occur. As long as this information is available it can be
adapted to any recurrent translocation. At the same time this is also a drawback of the technique. Breaks outside of the pre-defined genomic region will not be detected. Likewise, more complicated genomic rearrangements might elude discovery because they alter the predicted ligation joints. Translocations resulting from more complicated reshuffling of the genome have been described [21]. During our study we serendipitously detected at (11;19) breakpoint where material of chromosome 5 had been interspersed at the junction site of chromosome 11 and 19 (not shown). Events of this type are the most likely explanation for the false negative rate in the present study. In addition the fact that occasionally only one of two closely spaced restriction sites was covered by primer pairs also causes small ‘‘blind spots’’. However, compared to the size of most breakpoint regions it is highly improbable that these tiny regions
,1 kb should have a major impact on the sensitivity of the assay. The biochemical preparation of circular ligated DNA seems to be close to the optimum. Reactions that contained less than 20 calculated template molecules still yielded a positive readout indicating that all previous preparatory steps worked with near perfect efficiency. Therefore the sensitivity of GIPFEL seems to be mainly limited by the amount of total template DNA that can be fed per PCR reaction. This restricts the practical threshold of GIPFEL to about 1 in 104cells which falls in the range of most DNA based methods. We estimate this sensitivity should suffice to discover most clinically meaningful cases.
Another current constraint is the number of PCR reactions that need to be manually assembled to cover a translocation region. However, for this aspect improvements are in sight as new developments like digital droplet PCR should be easily adaptable to GIPFEL allowing the simultaneous screening for multiple Figure 2. Flow chart of the GIPFEL procedure.A. Biochemical steps for enrichment of circularized DNA. The products of a restriction enzyme (E) digest of genomic material are column purified and ligated in a large volume. Subsequently exonuclease III (presented in yellow) removes remaining linear fragments allowing enrichment for circularized DNA. B. PCR strategy to detect the presence of translocation specific circles. Primer pairs are designed that cover all possible ligation joints of translocation specific ligation products. Semi-nested PCR is performed first with an outer primer corresponding to the 59portion of the fusion and pools of downstream primers. The PCR products from these reactions are used as templates for secondary PCRs using a 59inner primer and the same downstream primers, yet in different combinations. A control PCR amplifies a ligation joint created from wild-type cells. C. Decision tree for scoring of GIPFEL results.
translocations in a high-throughput fashion. Despite the fact that t(11;19) and t(1;19) do not read out optimally in our assay, most cases of the much more frequently occurring t(4;11), t(9;11) and particularly t(12;21) will be recorded. In addition actual population based frequencies of the less easily detectable translocations may be extrapolated from the incidence as detected by GIPFEL corrected by the respective accuracy rate. In addition it is to be expected that NGS data from actual breakpoint regions will beome increasingly available. This information will aid in developing better primers for GIPFEL thus increasing precision of this method.
In summary GIPFEL could become a valuable tool particularly in prospective settings. Patients that have been exposed to topoisomerase inhibitors during the treatment of non-blood
related neoplastic diseases are at a higher risk developing 11q23 translocation-positive secondary malignancies. Similarly, persons exposed to ionizing radiation might be screened for the appearance of translocation positive clones. Finally, GIPFEL may be used to solve the ongoing scientific discussion about the actual frequency of pre-leukemic events in healthy newborns, who never develop leukemia in later life. For this purpose birth cohorts might be screened for the presence of interchromosomal fusion sequences in apparently healthy newborns. Previous studies gave highly divergent results ranging from 1:100 ETV6-RUNX1 positive cases [22] to less than 1 in 1417 cord blood samples [23,24]. In all these cases GIPFEL may detect the appearance of translocation positive clones allowing for follow up and maybe early treatment.
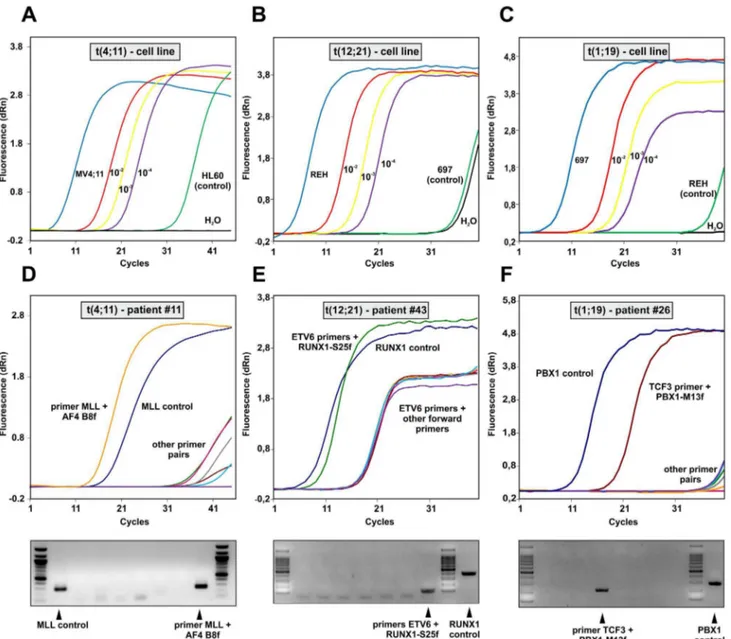
Figure 3. Examples of GIPFEL results.A. Sensitivity test. Circularized genomic DNA was produced from MV4;11 cells a cell line with a known t(4;11) translocation and from HL60 cells as ‘‘non-translocation’’ control as well as from various mixtures ‘‘diluting’’ MV4;11 cells in a population of HL60 as indicated. GIPFEL was performed and real-time amplification curves are shown. B. As in ‘‘A’’ with REH t(12;21) cells and 697 cells instead of HL60 cells. C. As in ‘‘A’’ with 697 t(1;19) and REH cells. D. Example for a GIPFEL result using patient DNA. Upper panel: Amplification chart of a typical GIPFEL experiment with patient DNA. Amplification is achieved with the genomic MLL control primer and a translocation specific primer pair. Lower panel: Agarose gel electrophoresis of the 8 individual secondary PCRs interrogating the (4;11) breakpoint region. E. Results presented as in ‘‘D’’ for a t(12;21) breakpoint. F. Results for a t(1;19) patient sample.
doi:10.1371/journal.pone.0104419.g003
DNA Based Detection of Translocations
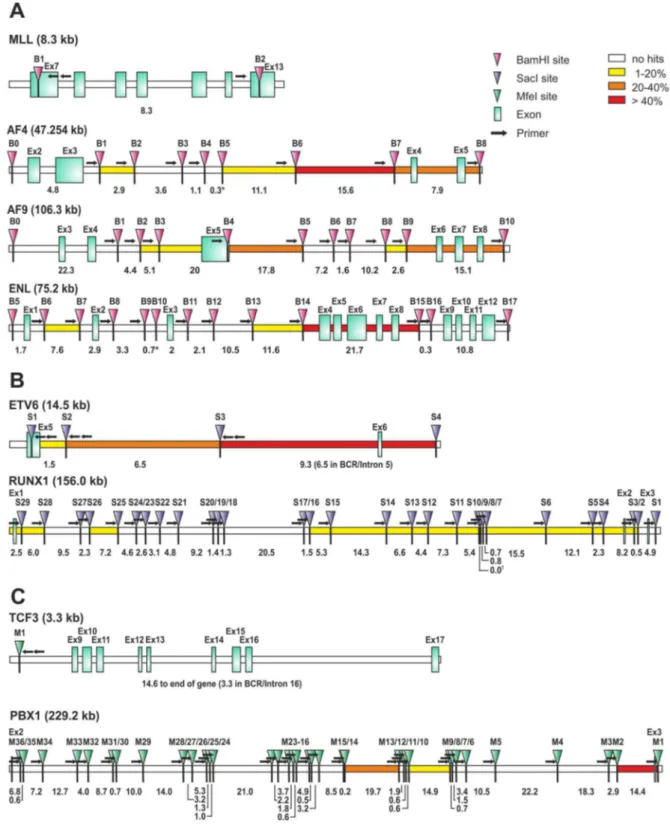
Figure 4. Breakpoint distribution, restriction site and primer locations for individual translocations.A. Schematic depiction of the 11q23 breakpoint region covered by GIPFEL. Consecutively numbered BamHI sites (B), primer locations (arrows) and exons (squares) involved are depicted. Numbers denote the size in kb between restriction sites. * Note: For restriction fragments,1 kb no primers were designed. B. Schematic depiction of the t(12;21) breakpoint regions covered by GIPFEL. SacI sites (S), primer locations and exons involved are depicted as described in A. Numbers denote the size in kb between restriction sites.{Note: Restriction sites S9 and S10 were 4 bp apart. No primer was designed for site S9. C. Schematic depiction of the t(1;19) breakpoint covered by GIPFEL. Presentation as in A and B. Digest was carried out with MfeI (M). The heatmap indicates the frequency of the breakpoints detected in the respective region.
Table 3.GIPFEL results summary.
MLLAF4 (n = 23) Breakpoint region: #patient samples+cell lines
B0–B1 0
B1–B2 2
B2–B4 0
B5–B6 1
B6–B7 9*+1
B7–B8 7*+1
not detected 3
MLLAF9 (n = 17)Breakpoint region:
B0–B2 0
B2–B3 1
B3–B4 1
B4–B5 4*
B5–B8 0
B8–B9 1
B9–B10 5*+1
not detected 5
MLLENL (n = 17)Breakpoint region:
B5–B6 0
B6–B7 1
B7–B13 0
B13–B14 1
B14–B15 2
B15–B17 0
not detected 13
ETV6RUNX1 (n = 61)
Breakpoint region RUNX1:
S1–S2 0
S2–S3 2
S3–S4 1
S4–S5 3
S5–S6 3
S6–S7 2
S7–S8 0
S8–S9 2
S10–S11 4
S11–S12 3
S12–S13 1
S13–S14 2+1
S14–S15 5
S15–S16 1
S16–S25 0
S25–S26 2
S26–S28 0
S28–S29 6
S29–S30 1
not detected 22
Breakpoint Region ETV6:
S1–S2 6*
S2–S3 11*+1
S3–S4 22
DNA Based Detection of Translocations
Supporting Information
Table S1 Predicted joining sequences for each primer combination.
(DOCX)
Acknowledgments
The authors wish to thank Sabine Hornhardt for valuable support and advice.
Author Contributions
Conceived and designed the experiments: AB RKS. Performed the experiments: EF DS UF PF. Analyzed the data: EF DS UF PF MS AB RKS. Contributed reagents/materials/analysis tools: MS. Contributed to the writing of the manuscript: EF DS UF PF MS AB RKS.
References
1. Rowley JD (2013) Genetics. A story of swapped ends. Science 340: 1412–1413. 2. Pui CH, Carroll WL, Meshinchi S, Arceci RJ (2011) Biology, risk stratification, and therapy of pediatric acute leukemias: an update. J Clin Oncol 29: 551–565. 3. Akao Y, Isobe M (2000) Molecular analysis of the rearranged genome and chimeric mRNAs caused by the t(6;11)(q27;q23) chromosome translocation involving MLL in an infant acute monocytic leukemia. Genes Chromosomes Cancer 27: 412–417.
4. Cimino G, Rapanotti MC, Biondi A, Elia L, Lo Coco F, et al. (1997) Infant acute leukemias show the same biased distribution of ALL1 gene breaks as topoisomerase II related secondary acute leukemias. Cancer Res 57: 2879–2883. 5. Langer T, Metzler M, Reinhardt D, Viehmann S, Borkhardt A, et al. (2003) Analysis of t(9;11) chromosomal breakpoint sequences in childhood acute leukemia: almost identical MLL breakpoints in therapy-related AML after treatment without etoposides. Genes Chromosomes Cancer 36: 393–401. 6. Megonigal MD, Rappaport EF, Jones DH, Kim CS, Nowell PC, et al. (1997)
Panhandle PCR strategy to amplify MLL genomic breakpoints in treatment-related leukemias. Proc Natl Acad Sci U S A 94: 11583–11588.
7. Conter V, Bartram CR, Valsecchi MG, Schrauder A, Panzer-Grumayer R, et al. (2010) Molecular response to treatment redefines all prognostic factors in children and adolescents with B-cell precursor acute lymphoblastic leukemia: results in 3184 patients of the AIEOP-BFM ALL 2000 study. Blood 115: 3206– 3214.
8. Schrappe M, Valsecchi MG, Bartram CR, Schrauder A, Panzer-Grumayer R, et al. (2011) Late MRD response determines relapse risk overall and in subsets of childhood T-cell ALL: results of the AIEOP-BFM-ALL 2000 study. Blood 118: 2077–2084.
9. Kibbe WA (2007) OligoCalc: an online oligonucleotide properties calculator. Nucleic Acids Res 35: W43–46.
10. Felix CA, Kim CS, Megonigal MD, Slater DJ, Jones DH, et al. (1997) Panhandle polymerase chain reaction amplifies MLL genomic translocation breakpoint involving unknown partner gene. Blood 90: 4679–4686. 11. Kobayashi H, Espinosa R 3rd, Thirman MJ, Gill HJ, Fernald AA, et al. (1993)
Heterogeneity of breakpoints of 11q23 rearrangements in hematologic malignancies identified with fluorescence in situ hybridization. Blood 82: 547– 551.
12. Meyer C, Schneider B, Reichel M, Angermueller S, Strehl S, et al. (2005) Diagnostic tool for the identification of MLL rearrangements including unknown partner genes. Proc Natl Acad Sci U S A 102: 449–454.
13. Rodic N, Zampella JG, Cornish TC, Wheelan SJ, Burns KH (2013) Translocation junctions in TCF3-PBX1 acute lymphoblastic leukemia/lympho-ma cluster near transposable elements. Mob DNA 4: 22.
14. Stanulla M, Wang J, Chervinsky DS, Thandla S, Aplan PD (1997) DNA cleavage within the MLL breakpoint cluster region is a specific event which occurs as part of higher-order chromatin fragmentation during the initial stages of apoptosis. Mol Cell Biol 17: 4070–4079.
15. Thandla SP, Ploski JE, Raza-Egilmez SZ, Chhalliyil PP, Block AW, et al. (1999) ETV6-AML1 translocation breakpoints cluster near a purine/pyrimidine repeat region in the ETV6 gene. Blood 93: 293–299.
16. van der Burg M, Beverloo HB, Langerak AW, Wijsman J, van Drunen E, et al. (1999) Rapid and sensitive detection of all types of MLL gene translocations with a single FISH probe set. Leukemia 13: 2107–2113.
17. von Goessel H, Jacobs U, Semper S, Krumbholz M, Langer T, et al. (2009) Cluster analysis of genomic ETV6-RUNX1 (TEL-AML1) fusion sites in childhood acute lymphoblastic leukemia. Leuk Res 33: 1082–1088.
18. Wiemels JL, Hofmann J, Kang M, Selzer R, Green R, et al. (2008) Chromosome 12p deletions in TEL-AML1 childhood acute lymphoblastic leukemia are associated with retrotransposon elements and occur postnatally. Cancer Res 68: 9935–9944.
19. Wiemels JL, Leonard BC, Wang Y, Segal MR, Hunger SP, et al. (2002) Site-specific translocation and evidence of postnatal origin of the t(1;19) E2A-PBX1 fusion in childhood acute lymphoblastic leukemia. Proc Natl Acad Sci U S A 99: 15101–15106.
20. Emerenciano M, Meyer C, Mansur MB, Marschalek R, Pombo-de-Oliveira MS (2013) The distribution of MLL breakpoints correlates with outcome in infant acute leukaemia. Br J Haematol 161: 224–236.
21. Ghosh S, Bartenhagen C, Okpanyi V, Gombert M, Binder V, et al. (2013) Recurrent involvement of ring-type zinc finger genes in complex molecular rearrangements in childhood acute myelogeneous leukemia with translocation t(10;11)(p12;q23). Leukemia 27: 1745–1748.
22. Mori H, Colman SM, Xiao Z, Ford AM, Healy LE, et al. (2002) Chromosome translocations and covert leukemic clones are generated during normal fetal development. Proc Natl Acad Sci U S A 99: 8242–8247.
23. Lausten-Thomsen U, Hjalgrim H, Marquart H, Lutterodt M, Petersen BL, et al. (2008) ETV6-RUNX1 transcript is not frequent in early human haematopoiesis. Eur J Haematol 81: 161–162.
24. Lausten-Thomsen U, Madsen HO, Vestergaard TR, Hjalgrim H, Nersting J, et al. (2011) Prevalence of t(12;21)[ETV6-RUNX1]-positive cells in healthy neonates. Blood 117: 186–189.
Table 3.Cont.
MLLAF4 (n = 23) Breakpoint region: #patient samples+cell lines
not detected 22
TCF3PBX1 (n = 31)
Breakpoint region: M1–M2 5+1 M2–M9 0 M9–M10 2 M10–M13 0 M13–M14 4 M14–M37 0
not detected 19