An improved HPLC method for the
quantitation of 6-mercaptopurine and
its metabolites in red blood cells
1Departamento de Pediatria, Faculdade de Medicina,
Universidade Federal de Minas Gerais, Belo Horizonte, MG, Brasil Laboratórios de 2Parasitologia Celular e Molecular, and
3Química de Produtos Naturais, Centro de Pesquisas René Rachou,
FIOCRUZ, Belo Horizonte, MG, Brasil B.M. Oliveira1,
A.J. Romanha2,
T.M.A. Alves3,
M.B. Viana1
and C.L. Zani3
Abstract
A procedure is described for the rapid determination of the intra-erythrocyte concentration of 6-mercaptopurine (6-MP) and its me-tabolites, 6-thioguanine nucleotides (6-TGN) and 6-methylmercapto-purine (6-MMP). Erythrocytes (8 x 10⁸ cells) in 350 µl Hanks solution
containing 7.5 mg dithiothreitol were treated with 50 µl 70% perchlo-ric acid. The precipitate was removed by centrifugation (13,000 g) and the supernatant hydrolyzed at 100°C for 45 min. After cooling, 100 µl was analyzed directly by HPLC using a Radialpack Resolve C18 column eluted with methanol-water (7.5:92.5, v/v) containing 100 mM triethylamine. 6-TG, 6-MP and the hydrolysis product of 6-MMP, 4-amino-5-(methylthio)carbonyl imidazole, were monitored at 342, 322 and 303 nm using a Shimadzu SPD-M10A diode array UV detector. The analytes eluted at 5.3, 6.0 and 10.2 min, respectively. The calibration curves were linear (r2 > 0.998), and the analytical
recoveries were 73.2% for TG, 119.1% for MP and 97.4% for 6-MMP. The intra- and inter-assay variations were highest for 6-MP (9.6 and 14.3%, respectively). The lowest detectable concentrations were 3, 3 and 25 pmol/8 x 108 erythrocytes for 6-TG, 6-MP and 6-MMP,
respectively. The quantification limits (coefficients of variation <15%) were 8, 10 and 70 pmol/8 x 108 erythrocytes for TG, MP and
6-MMP, respectively. The method was applied to the analysis of 183 samples from 36 children under chemotherapy for acute lymphoblas-tic leukemia. The concentrations of the metabolites in the red cells of the patients ranged from 0 to 1934 pmol/8 x 108 erythrocytes for
6-TGN, and from 0 to 105.8 and 0 to 45.9 nmol/8 x 108 erythrocytes for
6-MP and 6-MMP, respectively. The procedure gave results that were in agreement with those obtained with other methods designed to detect cases of non-compliance with treatment, including patient interviews and medical evaluation, among others, demonstrating its applicability to monitoring the treatment of leukemic children.
Correspondence
C.L. Zani
Laboratório de Química de Produtos Naturais
Centro de Pesquisas René Rachou FIOCRUZ
Av. Augusto de Lima, 1715 30190-002 Belo Horizonte, MG Brasil
Fax: +55-32-3295-3115 E-mail: [email protected]
Research supported by FIOCRUZ, CNPq, PRONEX and FAPEMIG.
Received July 15, 2003 Accepted March 16, 2004
Key words
•Acute lymphoblastic leukemia
Introduction
Acute lymphoblastic leukemia (ALL) is the most common malignancy affecting chil-dren. Prior to the discovery and application of chemotherapeutic agents, the majority of children suffering from ALL survived for only one or two months after diagnosis (1). However, over the last 30 years there has been a significant improvement in the prog-nosis of such patients and, currently, 70 to 80% of recently diagnosed children in devel-oped countries present disease-free survival for more than 5 years, and most will eventu-ally be cured (2). Treatment failures may be attributed to several factors, a major one being lack of adhesion to the prescribed treatment (3). Procedures to assess compli-ance with treatment, especially with respect to the effective delivery of chemotherapy, are of great importance to ALL patients and can even determine the outcome of the dis-ease. Such assessments may be carried out by various indirect methods including pa-tient interviews, medical evaluation, drug audits, etc. (4), although more direct meth-ods involving quantitation of the drug and its metabolites in urine and erythrocytes have been proposed (5-9).
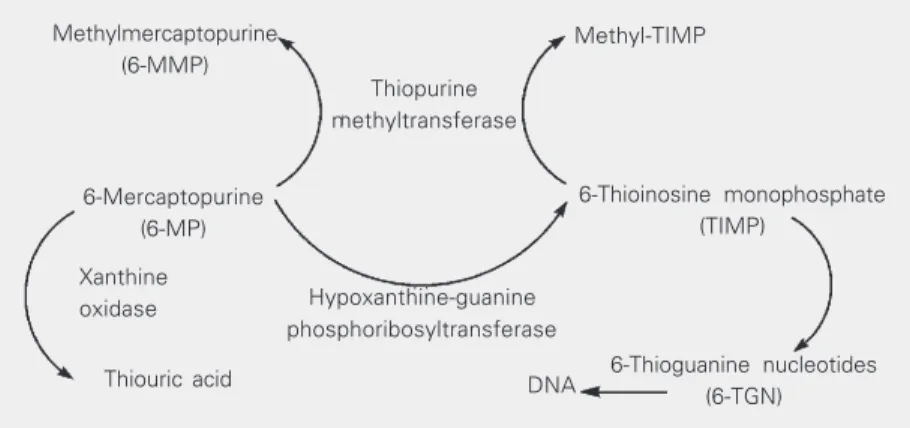
6-Mercaptopurine (6-MP), a chemothera-peutic agent commonly used to treat ALL, is an analogue of the natural nucleoside hypo-xanthine. As is the case for the majority of
purine analogues, 6-MP is a pro-drug and must be converted into the nucleotide by intracellu-lar enzymes in order to exert its cytotoxic effects (10). Such conversion after oral admin-istration of the drug follows three competing routes (Figure 1) (11,12). One route occurs both in the intestinal mucosa and in the liver and involves the enzyme xanthine oxidase, which transforms 6-MP into thiouric acid, an inactive metabolite (10). A second route gen-erates the active metabolite 6-thioinosine mon-ophosphate (TIMP) by the action of the en-zyme hypoxanthine-guanine phosphoribosyl-transferase (10). This transformation results in the formation of active nucleotides including nucleotides of 6-thioguanine (6-TGN). The incorporation of 6-TGN into DNA and RNA is considered to be the principal mechanism of action of 6-MP (13). The third route is cata-lyzed by the enzyme thiopurine methyltrans-ferase (TPMT), which converts MP into 6-methylmercaptopurine (6-MMP) (13). De-spite some views to the contrary, this methy-lation is considered to be an inactivation mechanism since 6-MMP seems to be inac-tive (13). However, while the metabolism of 6-MP by TPMT reduces the formation of active 6-TGN (14), this enzyme is also re-sponsible for the formation of methyl-TIMP, a metabolite that seems to be important for the cytotoxic activity of 6-MP as it may inhibit the de novo synthesis of purines (13). Significant differences in the activity of TPMT may be observed between individu-als, thus accounting for the reported (15) differences in susceptibility to treatment with 6-MP. Studies among different populations and families have demonstrated a genetic autosomal co-dominant polymorphism of TPMT: thus, ca. 90% of Caucasians and Afro-Americans present high enzymatic ac-tivity, 10% present intermediate acac-tivity, and 1 in 300 individuals inherits deficient TPMT activity (16,17).
The most important metabolites of 6-MP, the 6-TGNs, slowly accumulate in red cells and reach a steady-state concentration within
6-Thioinosine monophosphate (TIMP)
Methyl-TIMP
Thiopurine methyltransferase Methylmercaptopurine
(6-MMP)
6-Mercaptopurine (6-MP)
Xanthine oxidase
Thiouric acid DNA 6-Thioguanine nucleotides (6-TGN) Hypoxanthine-guanine
phosphoribosyltransferase
1 to 4 weeks after the beginning of treatment (18). These metabolites are rapidly incorpo-rated into the DNA and RNA of leukemic cells, leukocytes and their precursors in the bone marrow, thus making their detection somewhat difficult (19). However, the eryth-rocytes act as reservoirs of these metabolites since they do not synthesize nucleic acids, and the intra-erythrocyte TGN concentra-tion, which reflects this accumulation fol-lowing multiple doses of 6-MP (20), has been proposed as a useful parameter with which to monitor 6-MP maintenance che-motherapy (21-23). It should be emphasized, however, that this parameter alone may not be sufficient to optimize the treatment of some patients with ALL, and the concomi-tant evaluation of TPMT activity and leuko-cyte levels has been recommended in order fully to monitor the chemotherapy (24).
The majority of the methods for the quan-titation of 6-MP metabolites involve the hy-drolysis of nucleotides to the corresponding bases that can then be separated by HPLC and detected by UV absorption. During hy-drolysis, 6-MMP is converted completely into 4-amino-5-(methylthio)carbonyl imid-azole (AMTCI) (25) which, unlike 6-MMP, can be quantified by HPLC-UV under the same conditions as employed for the bases: the concentration of AMTCI thus determined correlates directly with that of the 6-MMP originally present (26).
We describe a quantitation procedure based on the publications of Dervieux and Boulieu (27) and Lennard and Singleton (26), which permits the rapid quantitation of the intra-erythrocyte levels of MP, TGN and 6-MMP. The method has been fully validated and employed to monitor 36 children with ALL receiving chemotherapy with 6-MP.
Material and Methods
Chemicals
Dithiothreitol (DTT), 6-thioguanine
(6-TG), 6-MP, and 6-MMP were purchased from Sigma; perchloric acid was from Carlo Erba and Hank’s balanced salt solution was from Gibco BRL; triethylamine, phosphoric acid and all other chemicals were purchased in analytical grade from Merck (Rio de Janeiro, RJ, Brazil). Grade I water was pro-duced from glass-distilled water using a Milli-Q-UF Plus (Millipore, Molshein, France) system. All glassware was treated with 30% nitric acid for at least 12 h and then rinsed thoroughly with water.
Patient selection
ob-tained from each patient (providing a total of 183 samples for the entire population) ac-cording to the extent of the maintenance phase of treatment. The samples were coded and the identities of the patients were not revealed until the quantitation data and the answers given in the patients’ questionnaires were analyzed at the same time.
Preparation of clinical samples
Whole blood was collected in ethylene-diaminetetraacetic acid (EDTA) as antico-agulant, and red blood cells were separated by centrifugation at 160 g for 10 min at 4ºC. The platelet-rich supernatant plasma and the buffy coat containing leukocytes and plate-lets were discarded, and the pellet was washed
with two volumes of Hanks solution and centrifuged at 160 g for 10 min at 4ºC. Again, the supernatant was discarded and the erythrocytes were suspended in Hanks solution at a density of 8 x 10⁸ erythrocytes/ 200 µl. This suspension was kept at -20ºC until required for further processing (28).
Preparation of standard mixtures
Stock solutions of 6-TG and 6-MMP at concentrations of 185.6 and 242.4 µg/ml, respectively, were prepared by dissolving the appropriate amount of weighed standard in 1 ml of 0.1 M NaOH, diluting with 21 ml water and acidifying with 2.5 ml of 0.1 M HCl. A stock solution of 208.0 µg/ml 6-MP was prepared by dissolving the appropriate amount of weighed standard in 1 ml of 0.1 M NaOH and completing the volume to 25.0 ml with water. The stock solutions were used to prepare six standard mixtures with different concentrations of metabolites by dilution as appropriate with 0.1 M HCl containing 154 mg/ml DTT. Aliquots (1 ml) of these stan-dard mixtures were transferred to 1.5 ml microcentrifuge tubes and stored at -20ºC.
Preparation of standard samples
A 50-µl aliquot of each of the six stan-dard mixtures (see Table 1) was added to 200 µl Hanks solution containing 8 x 10⁸ erythrocytes obtained from healthy volun-teers (who had been taking no medications) and processed as described for the clinical samples. The final concentrations of the metabolites in each of the six standard samples are shown in Table 1.
Sample extraction and hydrolysis
A procedure based on a published proto-col (27) was employed. The erythrocyte sus-pension (200 µl), together with DTT (100 µl of solution containing 75 mg/ml) and water (50 µl) were added to an Eppendorf tube
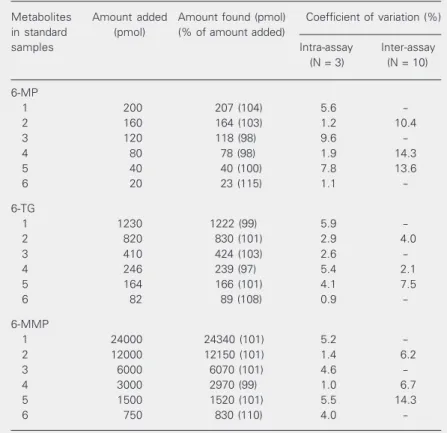
Table 1. Precision and accuracy of the determination of intra-erythrocyte concentra-tions of 6-MP, 6-TG and 6-MMP.
Metabolites Amount added Amount found (pmol) Coefficient of variation (%) in standard (pmol) (% of amount added)
samples Intra-assay Inter-assay
(N = 3) (N = 10)
6-MP
1 200 207 (104) 5.6
-2 160 164 (103) 1.2 10.4
3 120 118 (98) 9.6
-4 80 78 (98) 1.9 14.3
5 40 40 (100) 7.8 13.6
6 20 23 (115) 1.1
-6-TG
1 1230 1222 (99) 5.9
-2 820 830 (101) 2.9 4.0
3 410 424 (103) 2.6
-4 246 239 (97) 5.4 2.1
5 164 166 (101) 4.1 7.5
6 82 89 (108) 0.9
-6-MMP
1 24000 24340 (101) 5.2
-2 12000 12150 (101) 1.4 6.2
3 6000 6070 (101) 4.6
-4 3000 2970 (99) 1.0 6.7
5 1500 1520 (101) 5.5 14.3
6 750 830 (110) 4.0
-The erythrocytes (8 x 10⁸), obtained from healthy volunteers, were suspended in 200
held in an ice bath. Following homogeniza-tion, the suspension was treated with 70% perchloric acid (50 µl), mixed with a vortex mixer for 30 s, and centrifuged at 13,000 g for 15 min at room temperature. The super-natant (300 µl) was transferred to a 2-ml vial closed with a Teflon-lined screw cap, and heated at 100ºC for 45 min to hydrolyze the nucleotides and also to generate AMTCI from 6-MMP (25). Hydrolyzed samples were stored in an ice bath, and aliquots (100 µl) were injected into the HPLC apparatus for analysis as described below.
Chromatographic assay
Standard mixtures, standard samples and clinical samples were analyzed by HPLC (26) using a Shimadzu HPLC system con-sisting of an LC-10AD solvent delivery pump, an FCV-10AL low pressure solvent selector valve and an SPD-M10A diode array UV detector: a Waters Radial-Pak Resolve C18 column (100 x 8 mm; 5-µm particle size) was mounted in a Waters RCM 8 x 10 radial compressor and protected by a Waters Guard-Pak Resolve C18 pre-column. Elution was with methanol-water (7.5:92.5, v/v) contain-ing 100 mM triethylamine and adjusted to pH 3.2 with 0.1 M phosphoric acid: immedi-ately before analysis, DTT was added to the eluent to produce a 0.5-mM solution that was purged with helium and pumped at a flow rate of 1.4 ml/min. The column effluent was monitored simultaneously at 303 nm for AMTCI, at 322 nm for 6-MP and at 342 nm for 6-TG. The calibration curves and quanti-fications were based on the peak areas as determined using provided Shimadzu soft-ware (Class LC-10). After each day of use, the analytical column was washed with 60 ml of methanol and the guard-column was replaced after 300 injections.
Assay validation
Standard samples were used to
deter-mine the analytical recovery, accuracy and precision of the method over the entire con-centration range. The intra-assay variation was calculated from triplicate measurements at each concentration, while the inter-assay variation was obtained from experiments completed on 10 different days. The analyti-cal recovery was analyti-calculated by comparing the HPLC peak areas of processed standard samples with processed and unprocessed standard mixtures.
Results
HPLC chromatography
Figure 2A shows an HPLC chromato-gram of a processed blood sample obtained from an untreated healthy volunteer: after the first 4.3 min of elution, no peaks could be detected at 303, 322 or 342 nm. Figure 2B depicts the HPLC chromatogram of a pro-cessed standard mixture showing peaks of 6-TG (detected at 342 nm), 6-MP (at 322 nm) and AMTCI (at 303 nm; corresponding to 6-MMP in the original mixture) eluting at 5.3, 6.0 and 10.2 min, respectively. The limits of detection (signal-to-noise ratio of 5) were 3 pmol for 6-TG and 6-MP, and 25 pmol for AMTCI/6-MMP, whereas the limits of quan-tification (LOQ; coefficient of variation <15%) were 8 pmol for TG, 10 pmol for 6-MP, and 70 pmol for AMTCI/6-MMP). Val-ues below the LOQ were interpreted as show-ing the absence of the metabolite. In order to determine the shelf life of the standard mix-tures, the mixtures were stored at -20ºC dur-ing the study period (20 months) and showed unchanged HPLC profiles when re-analyzed after this time.
Assay validation
AMTCI/6-MMP, respectively: typical equations were, respectively, y = 146.4x, y = 210.2x + 3378.3 and y = 115552x + 215099, where y is the
area under the peak and x the concentration of metabolite (pmol/8 x 108 erythrocytes). The intra-assay coefficients of variation
mAbs 20
10
0
20
10
0
20
10
0
0
5
0
5
0
5
0
0 mAbs
Ch1 303 nm
Ch2 322 nm
Ch3 342 nm
Ch1 303 nm
Ch2 322 nm
Ch3 342 nm
5 10 15 0 5 10 15
Time (min)
5 10 15 0 5 10 15
Ch1 303 nm
Ch2 322 nm
Ch3 342 nm
Ch1 303 nm
Ch2 322 nm
Ch3 342 nm
4.276
4.277
4.202
6.224
5.363
10.236
6.014
5.259
AMTCI
AMTCI
6-TG 6-MP
6-TG
6-MP AMTCI
6-TG 6-MP
10.424
DTT DTT
mAbs 60
40
0 20
60
0 40
20
60
40
20
0
5
0
5
0
5
0
Time (min)
Time (min) Time (min)
mAbs
Figure 2. A, HPLC elution diagrams of a blood sample obtained from a healthy volunteer which was processed and then analyzed by HPLC using a Radial-Pak Resolve C18 column (100 x 8 mm; 5 µm particle size, eluted with methanol-water (7.5:92.5, v/v) containing 100 mM triethylamine adjusted to pH 3.2 with phosphoric acid; the flow rate was 1.4 ml/min; detection was by a photodiode array with channel 1 at 303 nm, channel 2 at 322 nm, and channel 3 at 342 nm. B, HPLC chromatogram of standard mixture 2 (see Table 1). Sample processing and HPLC analysis were as described in A. C, HPLC chromatogram of a blood sample collected from a patient using 6-MP at a dose rate of 47.8 mg m-2 day-1. Sample processing and HPLC analysis
were as described in A. D, HPLC chromatogram of a blood sample from the same patient as in C who had missed taking 6-MP at a dose rate of 58.1 mg m-2 day-1, showing low levels of the metabolites 6-TG and MMP (AMTCI). Sample processing and HPLC analysis were as described in A. AMTCI
= 4-amino-5-(methylthio)carbonyl imidazole; DTT = dithiothreitol. For other abbreviations, see Figure 1.
A B
ranged from 0.9 to 9.6% and inter-assay coefficients of variation were 2.1 to 14.3%. When compared with the processed stan-dard mixture, the recoveries of the metabo-lites in processed standard samples were 73.2% for 6-TG, 119.1% for 6-MP and 97.4% for AMTCI/6-MMP: such recoveries were obtained only after the amount of DTT rec-ommended to be added to the sample in the published protocol (27) was doubled. Prior to the analysis of each batch of clinical samples, the standard curve was validated using the standard samples 2, 4 and 5 (see Table 1) employed as quality controls for the method.
Quantitation of metabolites in clinical samples
The intra-erythrocyte concentrations of 6-TGN determined in the blood samples of patients varied from 0 to 1934.0 (median 319.7; mean 372.1) pmol/8 x 108 erythro-cytes, from 0 to 105.8 (median 2.9; mean 13.9) pmol/8 x 108 erythrocytes for 6-MP, and from 0 to 45.9 (median 6.3; mean 8.3) nmol/8 x 108 erythrocytes for 6-MMP. Fig-ure 2C illustrates the HPLC chromatogram of a sample obtained from a patient using 6-MP at a dose of 47.8 mg m-2 day-1. The peaks at 5.4 and 10.4 min correspond to 331.8 pmol 6-TGN/8 x 108 erythrocytes and to 4.7 nmol 6-MMP/8 x 108 erythrocytes, respec-tively. The intense peak at 14.8 min is due to the DTT added to the sample. Figure 2D shows the HPLC chromatogram of the same patient having failed to take a prescribed dose of 58.1 mg 6-MP m-2 day-1; the peak at 5.4 min corresponds to 73.4 pmol 6-TGN/8 x 108 erythrocytes while the peak at 10.4 min
corresponds to 0.3 nmol 6-MMP/8 x 108
erythrocytes. The peaks at 6.2 min, corre-sponding to 6-MP, could not be quantified in either sample as they were below the LOQ. The non-compliance of this patient with the treatment indicated by the above result was confirmed by interviews and
reports from medical charts (29).
Discussion
Several methods have been reported for the determination of 6-MP and its metabo-lites in biological fluids (30). The ideal method should allow the assessment of pa-tient compliance with the treatment, together with measurement of the absorption, trans-port and accumulation of the cytotoxic me-tabolites (31). Studies concerning the quan-tification of 6-MP and its metabolites in the urine of patients showed that the main disad-vantage of this type of sample is that it can detect failures in adherence to the treatment only when the analysis is performed shortly after the missed event (6). On the other hand, the quantitation of 6-MP and its metabolites in erythrocytes is more appropriate for the assessment of the regular use of the drug during long-term treatment as a steady state is reached (32) and should then be main-tained.
that they permit the simultaneous determina-tion of 6-MP, 6-TG and AMTCI/6-MMP in erythrocytes. In the present study, we com-bined the extraction and hydrolytic proce-dure developed by Dervieux and Boulieu (27) with the HPLC protocol published ear-lier (26). The modified procedure permitted the simultaneous analysis of 6-MP and its metabolites 6-TGN and 6-MMP in small-volume blood samples collected from chil-dren with ALL undergoing chemotherapy. The samples could be processed and ana-lyzed by HPLC with isocratic elution in just 15 min, thus making the procedure appropri-ate for the investigation of a large number of samples. Another possibility, not examined in the present study, is the suitability of the method for automation with the aim of in-creasing the reproducibility and the through-put of the assay.
The calibration curves for 6-MP, 6-TG and AMTCI/6-MMP were linear, with cor-relation coefficients greater than 0.998. The intra-assay coefficients of variation were <10% over the entire concentration range for all of the compounds analyzed, while the inter-assay variations were <15% for 6-MP and AMTCI/MMP and below 7.5% for 6-TG. Previous reports (26,27) cite intra- and inter-assay variations below 10% for both 6-TG and 6-MMP at the two concentrations evaluated; the value for 6-MP, however, was not provided (26). In an earlier study (35), an intra-assay variation of more than 10% was reported for at least one point on the calibra-tion curve for both 6-MP and 6-MMP. In the case of 6-TG, the variation was less than 10% at all points on the curve while the inter-assay variation was greater than 10% at one of the three concentrations monitored.
The analytical recoveries determined in the present investigation were 73.2% for 6-TG and 97.4% for 6-MMP, these values being similar to the previously reported val-ues of 73.1 and 84% (27), 68.6 and 45% (26)
and 74 and ≥38% (35), respectively. The LOQ values of 8, 10 and 70 pmol in 8 x 10⁸ erythrocytes/200 µl respectively determined for 6-TG, 6-MP and 6-MMP in this study, are slightly better than those obtained earlier (26) and those reported in Ref. 35 (30 pmol for 6-TG and 120 pmol for 6-MMP). Other workers (34) have been able to achieve LOQ values of 18 pmol for both TG and 6-MMP.
Our results show large differences in the intra-erythrocyte concentrations of 6-TG and 6-MMP in the samples analyzed. However, these intra- and inter-individual variations are similar to those reported by others (8,9,26,36). The inter-individual differences seem to reflect individual differences in 6-MP absorption and metabolism (due in part to the genetic polymorphism of TPMT) re-sulting in different bioavailability and distri-bution of the active metabolites in patients receiving similar doses. The variations ob-served in the values obtained for the same patient during a period of treatment suggest alternative explanations, among them the inadequate use of the prescribed medication (7) and non-compliance with treatment. In-deed, the aspect of non-compliance was also detected through questionnaires, interviews, and medical records (29), corroborating the observed low levels of drug and metabolites in erythrocytes of specific patients, and rein-forcing the usefulness of this method in moni-toring the treatment of children with ALL.
Acknowledgments
References
1. Beutler E (2001). The treatment of acute leukemia: past, present, and future. Leukemia, 15: 658-661.
2. Chessels JM (2000). Recent advances in management of acute leukemia. Archives of Disease in Childhood, 82: 438-442.
3. Pinkel D (1996). Selecting treatment for children with acute lympho-blastic leukemia. Journal of Clinical Oncology, 14: 4-6.
4. Wright EC (1993). Non-compliance - or how many aunts has Matilda? Lancet, 342: 909-913.
5. Azeemuddin S & Bharmal FM (1988). Rapid method for evaluating compliance of 6-mercaptopurine therapy in children with leukemia. Journal of Chromatography, 430: 163-169.
6. MacDougall LG, McElligott SE, Ross E, Greeff MC & Poole JE (1992). Pattern of 6-mercaptopurine urinary excretion in children with acute lymphoblastic leukemia: urinary assays as a measure of drug compliance. Therapeutic Drug Monitoring, 14: 371-375. 7. Davies HA, Lennard L & Lilleyman JS (1993). Variable
mercaptopu-rine metabolism in children with leukaemia: a problem of non-compliance? British Medical Journal, 306: 1239-1240.
8. Lennard L, Welch J & Lilleyman JS (1995). Intracellular metabolites of mercaptopurine in children with lymphoblastic leukaemia: a pos-sible indicator of non-compliance? British Journal of Cancer, 72: 1004-1006.
9. Lancaster D, Lennard L & Lilleyman JS (1997). Profile of non-compliance in lymphoblastic leukaemia. Archives of Disease in Childhood, 76: 365-366.
10. Lennard L (1992). The clinical pharmacology of 6-mercaptopurine. European Journal of Clinical Pharmacology, 43: 329-339.
11. Lennard L & Lilleyman JS (1996). Individualizing therapy with 6-mercaptopurine and 6-thioguanine related to the thiopurine methyl-transferase genetic polymorphism. Therapeutic Drug Monitoring, 18: 328-334.
12. McLeod HL, Coulthard S, Thomas AE, Pritchard SC, King DJ, Richards SM, Eden OB & Hall AG (1999). Analysis of thiopurine methyltransferase variant alleles in childhood acute lymphoblastic leukaemia. British Journal of Haematology, 105: 696-700. 13. Giverhaug T, Loennechen T & Aarbakke J (1999). The interaction of
6-mercaptopurine (6-MP) and methotrexate (MTX). General Phar-macology, 33: 341-346.
14. Lennard L, van Loon JA, Lilleyman JS & Weinshilboum RM (1987). Thiopurine pharmacogenetics in leukemia: correlation of erythro-cyte thiopurine methyltransferase activity and 6-thioguanine nucleo-tide concentrations. Clinical Pharmacology and Therapeutics, 41: 18-25.
15. Lennard L, Lilleyman JS, Loon JV & Weinshilboum RM (1990). Genetic variation in response to 6-mercaptopurine for childhood acute lymphoblastic leukaemia. Lancet, 336: 225-229.
16. McLeod HL, Lin JS, Scott EP, Pui CH & Evans WE (1994). Thiopurine methyltransferase activity in American white subjects and black subjects. Clinical Pharmacology and Therapeutics, 55: 15-20. 17. Weinshilboum RM & Sladek SL (1980). Mercaptopurine
pharmaco-genetics: monogenic inheritance of erythrocyte thiopurine methyl-transferase activity. American Journal of Human Genetics, 32: 651-662.
18. Rostami-Hodjegan A, Lennard L & Lilleyman JS (1995). The accu-mulation of mercaptopurine metabolites in age fractionated red blood cells. British Journal of Clinical Pharmacology, 40: 217-222. 19. Bostrom B & Erdmann G (1993). Cellular pharmacology of
6-mer-captopurine in acute lymphoblastic leukemia. American Journal of
Pediatric Hematology/Oncology, 15: 80-86.
20. Balis FM, Holcenberg JS, Poplack DG et al. (1998). Pharmacokinet-ics and pharmacodynamPharmacokinet-ics of oral methotrexate and mercaptopu-rine in children with lower risk acute lymphoblastic leukemia: A joint children’s cancer group and pediatric oncology branch study. Blood, 92: 3569-3577.
21. Schmiegelow K & Bruunshuus I (1990). 6-Thioguanine nucleotide accumulation in red blood cells during maintenance chemotherapy for childhood acute lymphoblastic leukemia, and it relation to leuko-penia. Cancer Chemotherapy and Pharmacology, 26: 288-292. 22. Lennard L, Gibson BES, Nicole T & Lilleyman JS (1993). Congenital
thiopurine methyltransferase deficiency and 6-mercaptopurine tox-icity during treatment for acute lymphoblastic leukaemia. Archives of Disease in Childhood, 69: 577-579.
23. Schmiegelow K, Schroder H, Gustafsson G, Kristinsson J, Glomstein A, Salmi T & Wranne L (1995). Risk of relapse in childhood acute lymphoblastic leukemia is related to RBC methotrexate and mer-captopurine metabolites during maintenance therapy. Journal of Clinical Oncology, 13: 345-351.
24. Innocenti F, Danesi R, Favre C et al. (2000). Variable correlation between 6-mercaptopurine metabolites in erythrocytes and hema-tologic toxicity: Implications for drug monitoring in children with acute lymphoblastic leukemia. Therapeutic Drug Monitoring, 22: 375-382.
25. Dervieux T & Boulieu R (1998). Identification of 6- methylmercapto-purine derivative formed during acid hydrolysis of thiomethylmercapto-purine nucleo-tides in erythrocytes, using liquid chromatography-mass spectrom-etry, infrared spectroscopy, and nuclear magnetic resonance assay. Clinical Chemistry, 44: 2511-2515.
26. Lennard L & Singleton HJ (1992). High-performance liquid chroma-tographic assay of the methyl and nucleotide metabolites of 6-mercaptopurine: quantification of red blood cell 6-thioguanine nucleotide, 6-thioinosinic acid and 6-methylmercaptopurine metabo-lites in a single sample. Journal of Chromatography, 583: 83-90. 27. Dervieux T & Boulieu R (1998). Simultaneous determination of
6-thioguanine and methyl 6-mercaptopurine nucleotides of azathio-prine in red blood cells by HPLC. Clinical Chemistry, 44: 551-555. 28. Lennard L (1987). Assay of 6-thioinosinic acid and 6-thioguanine
nucleotides, active metabolites of 6-mercaptopurine, in human red blood cells. Journal of Chromatography, 423: 169-178.
29. Oliveira BM, Viana MB, Zani CL & Romanha AJ (2004). Clinical and laboratory evaluation of compliance in acute lymphoblastic leu-kaemia. Archives of Disease in Childhood (in press).
30. Kato Y, Matsushita T, Yokoyama T & Mohri K (1991). Determination of 6-mercaptopurine in acute lymphoblastic leukemia patients’ plasma by high performance liquid chromatography. Therapeutic Drug Monitoring, 13: 220-225.
31. Rudy JL, Argyle JC, Winick N & Van Dreal P (1988). HPLC analysis of 6-mercaptopurine and metabolites in extracellular body fluids. Annals of Clinical Biochemistry, 25: 504-509.
32. Davies HA & Lilleyman JS (1995). Compliance with oral chemo-therapy in childhood lymphoblastic leukaemia. Cancer Treatment Reviews, 21: 93-103.
33. Giverhaug T, Bergan S, Loennechen T, Rugstad HE & Aarbakke J (1997). Analysis of methylated 6-mercaptopurine metabolites in human red blood cells: Comparison of two methods. Therapeutic Drug Monitoring, 19: 663-668.
Reversed-phase high-perfomance liquid chromatographic assay method for quantitating 6-mercaptopurine and its methylated and non-methylated metabolites in a single sample. Journal of Chroma-tography, 716: 392-396.
35. Erdmann GR, France LA, Bostrom B & Canafax DM (1990). A reversed phase high performance liquid chromatography approach in determining total red blood cell concentrations of 6-thioguanine, 6-mercaptopurine, methylthioguanine, and methylmercaptopurine in patient receiving thiopurine therapy. Biomedical Chromatogra-phy, 4: 47-51.
36. Relling MV, Hancock ML, Rivera GK, Sandlund JT, Ribeiro RC, Krynetski EY, Pui C-H & Evans WE (1999). Mercaptopurine therapy intolerance and heterozygosity at the thiopurine S-methyltransfer-ase gene locus. Journal of the National Cancer Institute, 91: 2001-2008.