Dysfunctional miRNA-Mediated Regulation in
Chromophobe Renal Cell Carcinoma
Xiaohan Sun1,2, Junying Zhang1*
1School of Computer Science and Technology, Xidian University, Xi'an, Shaanxi, P. R. China,2College of Mathematics and Information Science, Weinan Normal University, Weinan, Shaanxi, P. R. China
Abstract
Past research on pathogenesis of a complex disease suggests that differentially expressed message RNAs (mRNAs) can be noted as biomarkers of a disease. However, significant miRNA-mediated regulation change might also be more deep underlying cause of a dis-ease. In this study, a miRNA-mediated regulation module is defined based on GO terms (Gene Ontology terms) from which dysfunctional modules are identified as the suspected cause of a disease. A miRNA-mediated regulation module contains mRNAs annotated to a GO term and MicroRNAs (miRNAs) which regulate the mRNAs. Based on the miRNA-medi-ated regulation coefficients estimmiRNA-medi-ated from the expression profiles of the mRNA and the miRNAs, a SW (single regulation-weight) value is then designed to evaluate the miRNA-mediated regulation change of an mRNA, and the modules with significantly differential SW values are thus identified as dysfunctional modules. The approach is applied to Chromo-phobe renal cell carcinoma and it identifies 70 dysfunctional miRNA-mediated regulation modules from initial 4381 modules. The identified dysfunctional modules are detected to be comprehensive reflection of chromophobe renal cell carcinoma. The proposed approach suggests that accumulated alteration in miRNA-mediated regulation might cause functional alterations, which further cause a disease. Moreover, this approach can also be used to identify diffentially miRNA-mediated regulated mRNAs showing more comprehensive underlying association with a disease than differentially expressed mRNAs.
Introduction
MiRNAs are important gene regulators associated with a wide variety of functions. Their dys-regulation has been discovered to be the genetic cause of many complex diseases and cancers [1]. Many pathogenic studies focus on the alteration in miRNA regulation and its influence on mRNA expression. For example, Nandini Nairet al. identified the distinct patterns of some
cir-culating miRNAs expression [2], Yun Xiaoet al. identified dysfunctional miRNA-mRNA
regu-latory modules [3], and Tao Huang et al. identified dysfunctional gene sets in lung cancer [4]. In these studies, miRNA regulation is viewed as the cause of changed mRNA expression, but not the cause of dysfunction [5]. However, in our opinion, the remarkable alteration in miRNA regulation associated with some specific functions might be the underlying cause of a disease even with unchanged mRNA expression.
a11111
OPEN ACCESS
Citation:Sun X, Zhang J (2016) Dysfunctional miRNA-Mediated Regulation in Chromophobe Renal Cell Carcinoma. PLoS ONE 11(6): e0156324. doi:10.1371/journal.pone.0156324
Editor:Partha Mukhopadhyay, National Institutes of Health, UNITED STATES
Received:December 18, 2015
Accepted:May 12, 2016
Published:June 3, 2016
Copyright:© 2016 Sun, Zhang. This is an open access article distributed under the terms of the
Creative Commons Attribution License, which permits unrestricted use, distribution, and reproduction in any medium, provided the original author and source are credited.
Data Availability Statement:All miRNA and mRNA expression data of ChRCC and other relevant data are within the paper and its Supporting Information files.
Renal cell carcinoma (RCC) is the most common neoplasm of the adult kidney and chromo-phobe renal cell carcinoma (ChRCC) is a rare subtype of RCC. Some studies show miRNAs simultaneously regulate both oncogenes and tumor supressors in ChRCC [6], which results in the inconsistency between mRNA and miRNA expression and miRNA-mediated regulation. Moreover, the long-term outcomes of ChRCC are much more variable than those of other RCC subtypes [7], and miRNAs can be used as bio-signatures of different RCC subtypes [8]. Therefore, investigation of tumor-specific miRNA-mediated regulation is important to under-stand the pathogenesis of ChRCC.
In this study, we propose an approach to identify dysfunctional miRNA-mediated regula-tion modules (MMRMs) by comparing miRNA-mRNA regularegula-tion between tumor and normal samples. A function in our study corresponds to a Gene Ontology term (GO, a bioinformatics resource about gene-product functionhttp://www.geneontology.org) [4,9]. A miRNA-medi-ated regulation module is a GO-term relmiRNA-medi-ated module which contains mRNAs annotmiRNA-medi-ated to a GO term and miRNAs which regulate the mRNAs. Based on expression profiles of miRNAs and mRNAs, the miRNA-mediated regulation coefficients are estimated by linear regression, and a SW (single regulation-weight) value is designed to estimate cumulative difference of the regulation coefficients of an mRNA. A dysfunctional MMRM is then detected by the SW values in the module showing statistically significant difference between tumor and normal samples. We apply the identification approach on ChRCC as an example. It identifies 70 dysfunctional miRNA-mediated modules from 4381 modules. The designed SW value can also be applied to identify the underlying causal mRNAs which undergo significant miRNA-mediated regulation alteration. The identified dysfunctional MMRMs and differentially miRNA-mediated regula-tion mRNAs show relevance to comprehensive symptoms of ChRCC.
Materials and Methods
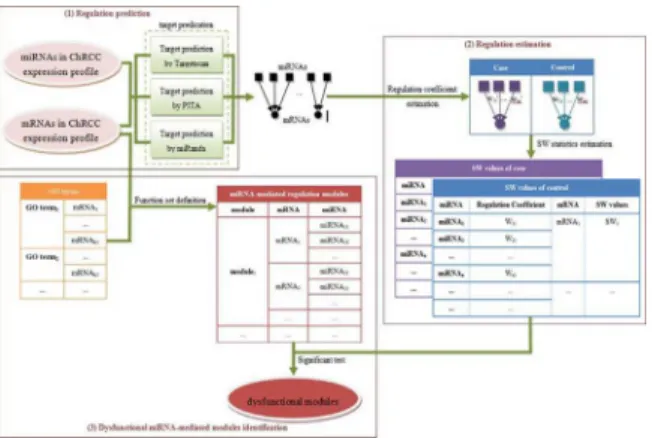
Our approach is used to identify dysfunctional MMRMs, in which, miRNA-mediated regula-tion show statistically significant difference between tumours and normal samples. There are three stages for identifying dysfunctional MMRMs (Fig 1): (1) predicting regulation relation-ship between miRNAs and mRNAs associated with a disease (ChRCC in the study), (2) esti-mating the regulation coefficient of an mRNA and an miRNA and illustrating miRNA
regulation alteration of an mRNA by a designed SW value, and (3) creating MMRMs according to GO terms and identifying the dysfunctional ones. We apply this approach on expression profiles of miRNAs and mRNAs of ChRCC, and identify 70 dysfunctional MMRMs.
Prediction of miRNA-mRNA regulation
The expression profiles of miRNAs and mRNAs associated with ChRCC are downloaded from The Cancer Genome Atlas (TCGA, the NIH research program,http://cancergenome.nih.gov/). There are 25 control and 66 case samples from TCGA cohort which covers 1046 miRNAs and 20531 mRNAs (S1andS2Files).
The miRNA-mRNA regulation relationship can be predicted by available prediction soft-ware. There have been various resources of target mRNA predictions, which produce different results [10,11]. A common solution to decrease the false positives is to cross check multiple algorithms to get an additional layer of confidence [10]. We choose Targetscan (http://www. targetscan.org/cgi-bin/targetscan), PITA (http://genie.weizmann.ac.il/index.html), and miRanda (http://www.microrna.org/microrna/home.do) to predict targets due to their good performance in detecting the previously validated targets [11]. Only the target mRNAs pre-dicted by at least two algorithms are believed reliable. This way, we obtain 149181 miRNA-mRNA relationships between 289 associated miRNAs and 11458 associated miRNA-mRNAs.
China [14SXZD014] and the research plan projects of Weinan Normal University [16YKP002].
Estimation of regulation coefficients
The miRNA-mRNA regulation strength can be measured by a regulation coefficient estimated by linear regression based on the expression profiles of miRNAs and mRNAs. Linear regression is an approach for modelling the relationship between a scalar dependent variable and one or more explanatory variables. The column vector of an mRNA expression is taken as the depen-dent variable, and the matrix of expression of the miRNAs is taken as explanatory variables. Multiple linear regressions here are used to estimate the regulation coefficients between an mRNA and multiple miRNAs (Fig 2).
Because an mRNA is regulated by multiple miRNAs, and the regulation change of an mRNA cannot be completely illustrated until investigating all the regulation changes of miR-NAs which regulate the mRNA, we design an SW value to measure the regulation change of an
mRNA. The value is defined asSW¼
ffiffiffiffiffiffiffiffiffiffiffiffiffiffiffiffiffiffiffiffiffiffiffiffiffiffiffiffiffi X
n
i¼1
ðwi wi0Þ2
n
v u u t
where [wi] andw0iare the regulation
coefficient vector of respective case and control samples, and n is the number of miRNAs
which regulate an mRNA. We divideX
n
i¼1
ðwi wi0Þ2
by n to balance the contribution from the
large and small regulation coefficients.
Fig 1. Flowchart of the approach.(1) Regulation relationship between a miRNA and an mRNA is
predicated. (2) Regulation coefficients are estimated, and SW values are computed. (3) MMRMs are created and dysfunctional ones are identified.
doi:10.1371/journal.pone.0156324.g001
Fig 2. Regulation coefficients estimation between multiple miRNAs and a target mRNA.The dependent variable is an m-by-1 vector (m is the number of samples), in which each value is the expression of an mRNA sample. The explanatory variables is a m-by-n matrix, in which each column is the expression values of a miRNA across all the samples, and n is the number of miRNAs which regulate the mRNA. A n-by-1 vector [w11w21 wn1]Tis then returned, and each value in the vector is a regulation coefficient.
Identification of dysfunctional MMRMs
GO term is a name indicating the domain to which the term belongs and describing the func-tion of gene products. We download mRNA associafunc-tion files of Homo sapiens from the Gene Ontology (http://geneontology.org/page/download-annotations), and obtain 13812 distinct GO terms and the mRNAs annotated to these terms (S3 File). Corresponding to a GO term, an MMRM associated with ChRCC is created and it includes the associated mRNAs annotated to the GO term and the associated miRNAs predicted to regulate the mRNAs [4]. Finally, we get 11919 associated MMRMs.
The dysfunctional MMRMs are the modules which contain mRNAs showing statistically significant difference in SW values. Due to the graph structure of GO, GO terms in different hierarchy contain different numbers of gene products, and MMRMs thus contain different number of mRNAs. With the SW value of each associated mRNA at hand, we perform t-test to determine if the SW values in a module are significantly different between case and control. t-test is relatively robust to moderate violations of the normality assumption for moderately large samples [12], hence it is adopted here because the number of mRNAs in a module is not very large. By t-test with significance level of 0.01, we identify 70 modules as dysfunctional MMRMs associated with ChRCC.
Results
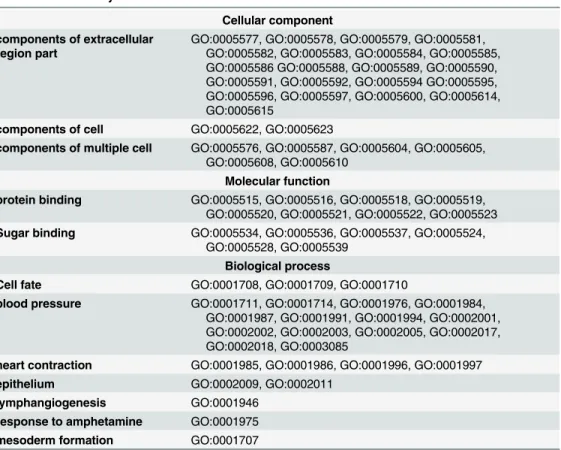
The 70 identified dysfunctional MMRMs correspond to 70 GO terms which cover 30 cellular components, 14 molecular functions and 26 biological processes (Table 1), most of them are closely associated with anatomical structure morphogenesis, cellular developmental process, blood pressureetc.
Table 1. Identified Dysfunctional MMRMs.
Cellular component components of extracellular
region part
GO:0005577, GO:0005578, GO:0005579, GO:0005581, GO:0005582, GO:0005583, GO:0005584, GO:0005585, GO:0005586 GO:0005588, GO:0005589, GO:0005590, GO:0005591, GO:0005592, GO:0005594 GO:0005595, GO:0005596, GO:0005597, GO:0005600, GO:0005614, GO:0005615
components of cell GO:0005622, GO:0005623
components of multiple cell GO:0005576, GO:0005587, GO:0005604, GO:0005605, GO:0005608, GO:0005610
Molecular function
protein binding GO:0005515, GO:0005516, GO:0005518, GO:0005519, GO:0005520, GO:0005521, GO:0005522, GO:0005523
Sugar binding GO:0005534, GO:0005536, GO:0005537, GO:0005524, GO:0005528, GO:0005539
Biological process
Cell fate GO:0001708, GO:0001709, GO:0001710
blood pressure GO:0001711, GO:0001714, GO:0001976, GO:0001984, GO:0001987, GO:0001991, GO:0001994, GO:0002001, GO:0002002, GO:0002003, GO:0002005, GO:0002017, GO:0002018, GO:0003085
heart contraction GO:0001985, GO:0001986, GO:0001996, GO:0001997
epithelium GO:0002009, GO:0002011
lymphangiogenesis GO:0001946
response to amphetamine GO:0001975
mesoderm formation GO:0001707
Discussion
Dysfunctional MMRMs
An MMRM includes multiple mRNAs and an mRNA is regulated by multiple miRNAs, there-fore, the identified dysfunctional MMRMs are the comprehensive reflection of ChRCC. Many of the identified MMRMs do not directly involve renal cells or relevant products, but they are associated with functions of kidney, response to drugs and Birt-Hogg-Dubé (BHD) syndrome. Kidneys participate in regulating acid-base balance, extracellular fluid volume, blood pressure
etc., which are partially overlapped with the identified dysfunctional MMRMs. Second,
amphetamine diet pills increase the risk for RCC [13]. Third, BHD is a human autosomal dom-inant genetic disorder that can cause susceptibility to kidney cancer, and people over 20 years of age with BHD syndrome have an increased risk of developing slow-growing ChRCC[14,15].
Differentially miRNA-mediated regulated mRNAs
An mRNA expression could remain unchanged even if the mRNA undergoes dramatic alter-ation in miRNA regulalter-ation because some miRNAs prompt the mRNA expression but others could repress it. Therefore, the Differentially miRNA-mediated regulated mRNAs should be relevant to ChRCC in a comprehensive and indirect way. SW value is a measure of miRNA-mediated regulation difference, and it can be used to identify the differentially miRNA-medi-ated regulmiRNA-medi-ated mRNAs. To estimate statistical significance of a SW value, we perform 1000 per-mutation tests on all the samples of each mRNA, and compute a SW value for each
permutation. Based on the 1000 SW values, the p-value of an SW value can be obtained. We thus get 148 mRNAs whose p-value<= 0.01 (S4 File). Among the 148 identified mRNAs,
BPGMis unregulated in ChRCC [16], some mRNAs have been reported to be associated with
renal diseases. For example,MDM2,SLC16A3,LFT etc. show expression change in renal cancer
[17–20];SLC22A7,ACHE,BMP4 etc. are associated with renal function [21–24]. Moreover,
some identified mRNAs are associated with cell growth and differentiation. For example,
GAB3,PTPN7,PTPN11,FEG6,HRK etc. regulate cell differentiation, growth, survival,
apopto-sis, proliferationetc. [25–29]. Most differentially miRNA-mediated regulated mRNAs are
rele-vant to comprehensive symptoms of ChRCC and they might be underlying cause of ChRCC. Significance Analysis of Microarrays (SAM) is a method for identifying differentially expressed mRNAs from mRNA expression profile. Here we adopt it finding 258 differentially expressed mRNAs. We compare the 148 mRNAs identified based on SW value with the 258 mRNAs identified by SAM and find two overlap mRNAs (C7andTPT1). The few overlap
genes explain the assumption that the mRNAs undergoing major miRNA-regulation change might present stable expression.
GO enrichment analysis tool (http://geneontology.org/page/go-enrichment-analysis) is applied on the 158 identified mRNAs based on SW value to find the functions that the mRNAs enrich. Separately taking the complete biological process, molecular function, cellular compo-nent annotation data sets as background, we find 138 genes overrepresented in biological pro-cess, 3 genes in growth hormone, 133 genes in receptor binding, 132 genes in cell and 145 genes in cell part and cellular component. The overrepresented terms are higher in the hierar-chical structure of GO terms, which deduces that miRNA-mediated dysregulation could have extensive effect on mRNAs.
Conclusion
In this approach, we create MMRMs, and from which we identify the dysfunctional ones. We apply the approach on mRNA and miRNA expression profiles of ChRCC and identify 70 dys-functional MMRMs. In addition, SW values can also be used to identify differentially miRNA-mediated regulated mRNAs. The proposed approach provides a novel view of mechanics of disease: miRNA regulation involves in a disease not only by affecting mRNA expression but also by miRNA dysregulation itself.
Supporting Information
S1 File. miRNA expression profile downloaded from TCGA.
(ZIP)
S2 File. mRNA expression profile downloaded from TCGA.
(ZIP)
S3 File. Genes in GO.The genes in this file are those annotated to GO terms. (XLS)
S4 File. Significant genes based on SW.The genes in this file are the differentially miRNA-mediated regulated genes identified based on SW values.
(XLS)
Acknowledgments
We thank all of the members of our laboratory for critical discussions.
Author Contributions
Conceived and designed the experiments: XS. Performed the experiments: XS. Analyzed the data: XS. Contributed reagents/materials/analysis tools: XS. Wrote the paper: XS JZ. Supervised the experiments: JZ.
References
1. Iorio MV, Croce CM. MicroRNA dysregulation in cancer: diagnostics, monitoring and therapeutics. A comprehensive review. EMBO Mol Med. 2012; 4(3):143–59. Epub 2012/02/22. doi:10.1002/emmm.
201100209PMID:22351564; PubMed Central PMCID: PMC3376845.
2. Nair N, Kumar S, Gongora E, Gupta S. Circulating miRNA as novel markers for diastolic dysfunction. Molecular and Cellular Biochemistry. 2013; 376(1–2):33–40. doi:10.1007/s11010-012-1546-xPMID:
ISI:000315294400004.
3. Xiao Y, Ping Y, Fan H, Xu C, Guan J, Zhao H, et al. Identifying dysfunctional miRNA-mRNA regulatory modules by inverse activation, cofunction, and high interconnection of target genes: a case study of glioblastoma. Neuro Oncol. 2013; 15(7):818–28. Epub 2013/03/22. doi: not018 [pii] doi:10.1093/
neuonc/not018PMID:23516263; PubMed Central PMCID: PMC3688007.
4. Huang T, Jiang M, Kong X, Cai YD. Dysfunctions associated with methylation, microRNA expression and gene expression in lung cancer. PLoS ONE. 2012; 7(8):e43441. Epub 2012/08/23. doi:10.1371/ journal.pone.0043441PONE-D-11-25019 [pii]. PMID:22912875; PubMed Central PMCID:
PMC3422260.
5. Oberg AL, French AJ, Sarver AL, Subramanian S, Morlan BW, Riska SM, et al. miRNA expression in colon polyps provides evidence for a multihit model of colon cancer. PLoS ONE. 2011; 6(6):e20465. Epub 2011/06/23. doi:10.1371/journal.pone.0020465PONE-D-11-04534 [pii]. PMID:21694772; PubMed Central PMCID: PMC3111419.
7. Ge YZ, Xin H, Lu TZ, Xu Z, Yu P, Zhao YC, et al. MicroRNA expression profiles predict clinical pheno-types and prognosis in chromophobe renal cell carcinoma. Sci Rep. 2015; 5:10328. doi:10.1038/ srep10328PMID:25981392; PubMed Central PMCID: PMC4434887.
8. Youssef YM, White NM, Grigull J, Krizova A, Samy C, Mejia-Guerrero S, et al. Accurate molecular clas-sification of kidney cancer subtypes using microRNA signature. Eur Urol. 2011; 59(5):721–30. doi:10.
1016/j.eururo.2011.01.004PMID:21272993.
9. Gene Ontology C. The Gene Ontology: enhancements for 2011. Nucleic Acids Res. 2012; 40(Data-base issue):D559–64. doi:10.1093/nar/gkr1028PMID:22102568; PubMed Central PMCID: PMC3245151.
10. Zheng H, Fu R, Wang JT, Liu Q, Chen H, Jiang SW. Advances in the Techniques for the Prediction of microRNA Targets. Int J Mol Sci. 2013; 14(4):8179–87. Epub 2013/04/18. doi: ijms14048179 [pii] doi:
10.3390/ijms14048179PMID:23591837; PubMed Central PMCID: PMC3645737.
11. Kleftogiannis D, Korfiati A, Theofilatos K, Likothanassis S, Tsakalidis A, Mavroudi S. Where we stand, where we are moving: Surveying computational techniques for identifying miRNA genes and uncover-ing their regulatory role. J Biomed Inform. 2013; 46(3):563–73. Epub 2013/03/19. doi: S1532-0464(13) 00022-1 [pii] doi:10.1016/j.jbi.2013.02.002PMID:23501016.
12. Sawilowsky SS, Blair RC. A more realistic look at the robustness and Type II error properties of the t test to departures from population normality. Psychological Bulletin. 1992; 111(2):352–60. doi:10.
1037/0033-2909.111.2.352
13. Srikanth MS, Fox SR, Oh KH, Ward K, Sun H, Keskey T, et al. Renal cell carcinoma following bariatric surgery. Obesity surgery. 2005; 15(8):1165–70. doi:10.1381/0960892055002185PMID:16197791. 14. Kennedy JC, Khabibullin D, Henske EP. Mechanisms of Pulmonary Cyst Pathogenesis in Birt-Hogg-Dube Syndrome: The Stretch Hypothesis. Semin Cell Dev Biol. 2016. doi:10.1016/j.semcdb.2016.02. 014PMID:26877139.
15. Linehan WM, Pinto PA, Bratslavsky G, Pfaffenroth E, Merino M, Vocke CD, et al. Hereditary kidney cancer: unique opportunity for disease-based therapy. Cancer. 2009; 115(10 Suppl):2252–61. doi:10.
1002/cncr.24230PMID:19402075; PubMed Central PMCID: PMC2720093.
16. Yamazaki K, Sakamoto M, Ohta T, Kanai Y, Ohki M, Hirohashi S. Overexpression of KIT in chromo-phobe renal cell carcinoma. Oncogene. 2003; 22(6):847–52. doi:10.1038/sj.onc.1206153PMID:
12584564.
17. Oparina NY, Snezhkina AV, Sadritdinova AF, Veselovskii VA, Dmitriev AA, Senchenko VN, et al. Differ-ential expression of genes that encode glycolysis enzymes in kidney and lung cancer in humans. Russ J Genet+. 2013; 49(7):707–16. doi:10.1134/S1022795413050104PMID:ISI:000321852000002. 18. Hirata H, Hinoda Y, Kikuno N, Kawamoto K, Suehiro Y, Tanaka Y, et al. MDM2 SNP309 polymorphism
as risk factor for susceptibility and poor prognosis in renal cell carcinoma. Clinical Cancer Research. 2007; 13(14):4123–9. doi:10.1158/1078-0432.Ccr-07-0609PMID:ISI:000248110500015.
19. Gerlinger M, Santos CR, Spencer-Dene B, Martinez P, Endesfelder D, Burrell RA, et al. Genome-wide RNA interference analysis of renal carcinoma survival regulators identifies MCT4 as a Warburg effect metabolic target. Journal of Pathology. 2012; 227(2):146–56. doi:10.1002/Path.4006PMID:
ISI:000303193100005.
20. Liou LS, Shi T, Duan Z-H, Sadhukhan P, Der SD, Novick AA, et al. Microarray gene expression profiling and analysis in renal cell carcinoma. BMC urology. 2004; 4(1):9.
21. More VR, Wen X, Thomas PE, Aleksunes LM, Slitt AL. Severe diabetes and leptin resistance cause dif-ferential hepatic and renal transporter expression in mice. Comp Hepatol. 2012; 11(1):1. Epub 2012/ 04/25. doi: 1476-5926-11-1 [pii] doi:10.1186/1476-5926-11-1PMID:22524730; PubMed Central PMCID: PMC3416584.
22. Peiris-John R, Wanigasuriya J, Wickremasinghe A, Dissanayake W, Hittarage A. Exposure to acetyl-cholinesterase-inhibiting pesticides and chronic renal failure. 2006. PMID:16898042
23. Tabatabaeifar M, Schlingmann KP, Litwin M, Emre S, Bakkaloglu A, Mehls O, et al. Functional analysis of BMP4 mutations identified in pediatric CAKUT patients. Pediatr Nephrol. 2009; 24(12):2361–8. doi:
10.1007/s00467-009-1287-6PMID:ISI:000271283400010.
24. Weber S, Taylor JC, Winyard P, Baker KF, Sullivan-Brown J, Schild R, et al. SIX2 and BMP4 mutations associate with anomalous kidney development. Journal of the American Society of Nephrology. 2008; 19(5):891–903. doi:10.1681/Asn.2006111282PMID:ISI:000255423300013.
25. Wolf I, Jenkins BJ, Liu Y, Seiffert M, Custodio JM, Young P, et al. Gab3, a new DOS/Gab family mem-ber, facilitates macrophage differentiation. Mol Cell Biol. 2002; 22(1):231–44. Epub 2001/12/12. PMID:
26. Saxena M, Williams S, Gilman J, Mustelin T. Negative regulation of T cell antigen receptor signal trans-duction by hematopoietic tyrosine phosphatase (HePTP). J Biol Chem. 1998; 273(25):15340–4. Epub 1998/06/23. PMID:9624114.
27. Chang I, Majid S, Saini S, Zaman MS, Yamamura S, Chiyomaru T, et al. Hrk mediates 2-methoxyestra-diol-induced mitochondrial apoptotic signaling in prostate cancer cells. Mol Cancer Ther. 2013; 12 (6):1049–59. Epub 2013/04/13. doi: 1535-7163.MCT-12-1187 [pii] doi:
10.1158/1535-7163.MCT-12-1187PMID:23580416.
28. Barrera-Vilarmau S, Obregon P, de Alba E. Intrinsic order and disorder in the bcl-2 member harakiri: insights into its proapoptotic activity. PLoS ONE. 2011; 6(6):e21413. Epub 2011/07/07. doi:10.1371/ journal.pone.0021413PONE-D-11-03035 [pii]. PMID:21731739; PubMed Central PMCID: PMC3121775.
29. Gillies L, Lee SC, Long JS, Ktistakis N, Pyne NJ, Pyne S. The sphingosine 1-phosphate receptor 5 and sphingosine kinases 1 and 2 are localised in centrosomes: possible role in regulating cell division. Cell Signal. 2009; 21(5):675–84. Epub 2009/02/13. doi: S0898-6568(09)00007-2 [pii] doi:10.1016/j.cellsig.