CPD
10, 1857–1899, 2014Implication on tropical climate
dynamics
L.-J. Shiau et al.
Title Page
Abstract Introduction
Conclusions References
Tables Figures
◭ ◮
◭ ◮
Back Close
Full Screen / Esc
Printer-friendly Version Interactive Discussion
Discussion
P
a
per
|
D
iscussion
P
a
per
|
Discussion
P
a
per
|
Discuss
ion
P
a
per
|
Clim. Past Discuss., 10, 1857–1899, 2014 www.clim-past-discuss.net/10/1857/2014/ doi:10.5194/cpd-10-1857-2014
© Author(s) 2014. CC Attribution 3.0 License.
Open Access
Climate of the Past
Discussions
This discussion paper is/has been under review for the journal Climate of the Past (CP). Please refer to the corresponding final paper in CP if available.
SST phases in the open-ocean and
margins of the tropical Pacific;
implication on tropical climate dynamics
L.-J. Shiau1, S. C. Clemens2, M.-T. Chen1, M. Yamamoto3, and Y. Yokoyama4
1
Institute of Applied Geosciences, National Taiwan Ocean University, Keelung 20224, Taiwan
2
Department of Geological Sciences, Brown University, Providence 02912, RI, USA
3
Faculty of Environmental Earth Science, Hokkaido University, Sapporo 060-0810, Japan
4
Atmosphere and Ocean Research Institute and Department of Earth and Planetary Sciences, University of Tokyo, Tokyo 113-0033, Japan
Received: 28 February 2014 – Accepted: 14 March 2014 – Published: 28 April 2014
Correspondence to: L.-J. Shiau ([email protected])
CPD
10, 1857–1899, 2014Implication on tropical climate
dynamics
L.-J. Shiau et al.
Title Page
Abstract Introduction
Conclusions References
Tables Figures
◭ ◮
◭ ◮
Back Close
Full Screen / Esc
Printer-friendly Version Interactive Discussion
Discussion
P
a
per
|
D
iscussion
P
a
per
|
Discussion
P
a
per
|
Discuss
ion
P
a
per
|
Abstract
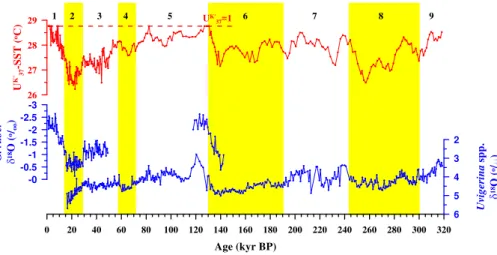
The tropical Pacific exerts a major effect on the global climate system and might have driven large extra-tropical climate change. We present a 320 kyr high resolu-tion UK37′-sea surface temperature (SST) record from core MD052928 (11◦17.26′S, 148◦51.60′E, water depth 2250 m) located offsoutheastern Papua New Guinea (PNG), 5
in the western tropical Pacific. The age model of the core is based on AMS 14C dat-ing of planktic foraminifers and correlation of benthic to the LR04 stack. The UK37′-SST ranges from 26.5 to 29◦C, showing glacial–interglacial and millennial variations. We assess the phase of the MD052928 UK37′-SST as part of a synthesis of five other SST records from the tropical Pacific at the precession, obliquity, and eccentricity bands. 10
The SST records can be separated into two groups when considering SST phase rel-ative to changes in orbital forcing, ice volume and greenhouse gases (GHGs). SST maxima at open-ocean sites within primary equatorial current systems occur between obliquity maxima and methane (CH4) maxima but early relative to ice volume minima and CO2maxima at the obliquity band. In contrast, SST maxima at continental margin
15
sites change are in phase with ice minima and CO2 maxima, likely influenced by the
slow response of continental ice sheets and GHGs. At the precession band, the early group located on the Warm Pool area indicates a direct influenced by the local insola-tion, and with the similar phase progress as the obliquity band. These results indicate that the decreased high-low latitudes insolation gradient and increasing low latitude 20
local insolation resulting in tropical Pacific SST rise. Higher SST would supply more moisture resulting in increased CH4in the tropical wetlands. This promotes increasing
CPD
10, 1857–1899, 2014Implication on tropical climate
dynamics
L.-J. Shiau et al.
Title Page
Abstract Introduction
Conclusions References
Tables Figures
◭ ◮
◭ ◮
Back Close
Full Screen / Esc
Printer-friendly Version Interactive Discussion
Discussion
P
a
per
|
D
iscussion
P
a
per
|
Discussion
P
a
per
|
Discuss
ion
P
a
per
|
1 Introduction
The tropical Pacific plays an important role in the global climate system. Solar radia-tion incident on the large area of the equatorial Pacific triggers atmosphere and ocean circulation that results in the transport of heat and moisture from the low to high lati-tudes (e.g., Hadley Circulation, the Intertropical Convergence Zone (ITCZ) migration, 5
Kuroshio and other currents on the tropical Pacific (Fig. 1a). The trade wind system in tropical Pacific results in stronger wind-driven upwelling and cooler sea surface tem-perature (SST) (<26◦C) in the central and eastern equatorial Pacific (EEP) named the “cold tongue”. In the western tropical Pacific, the Western Pacific warm pool (WPWP) around the New Guinea and Maritime Continent areas is characterized by warmer SST 10
(>28◦C). The eastern to western SST gradient in the tropical Pacific drives the longi-tudinal Walker Circulation associated with El Niño and La Niña events that affect the modern climate deeply. In addition, the western tropical Pacific is also close to the Asian and Australian continent, playing a role in the East Asian-Australian monsoon systems. Based on the large amount ocean research and satellites data, the tropi-15
cal Pacific is thought to exert a major effect on the global climate system (e.g. Yan et al., 1992). Similarly, modeling investigations also suggest that long-term changes in tropical Pacific SST patterns might have driven large extra-tropical climate change (Pierrehumbert, 2000).
A number of tropical Pacific paleo-SST records have been published (e.g. de Garidel-20
Thoron et al., 2005; Lea et al., 2000; Liu and Herbert, 2004; Medina-Elizadle and Lea, 2005) (Fig. 1a). Liu and Herbert (2004) studied ODP 846 UK37′-SST from the EEP cold tongue, finding a strong obliquity component. On the basis of this and other evidences, they concluded that ODP 846 SST is less affected by local insolation than by high latitude feedbacks. de Garidel-Thoron et al. (2005) studied MD972140 Mg/Ca-SST 25
CPD
10, 1857–1899, 2014Implication on tropical climate
dynamics
L.-J. Shiau et al.
Title Page
Abstract Introduction
Conclusions References
Tables Figures
◭ ◮
◭ ◮
Back Close
Full Screen / Esc
Printer-friendly Version Interactive Discussion
Discussion
P
a
per
|
D
iscussion
P
a
per
|
Discussion
P
a
per
|
Discuss
ion
P
a
per
|
domain after the Middle Pleistocene. Recently, Tachikawa et al. (2009) found that the CO2 rise in Termination I lagged the SST rise in the Southern and tropical Pacific
suggesting that early tropical warming could provide heat and moisture to the northern high latitudes and influence the onset of the last deglaciation. Other works suggest that WPWP SST varies similarly to Antarctica temperature changes on the millennial time 5
scale (Rosenthal et al., 2003; Stott et al., 2007) indicating a link to the southern high latitudes through atmosphere or deep water circulation.
In addition to proxy data, there are model studies supporting the idea of a tropical Pacific influence on global climate. Clement et al. (1999) found tropical Pacific SST responses to insolation variability with an obvious precession period as well as ENSO-10
like variability. Lee and Poulsen (2005) also used a coupled ocean–atmosphere model to reveal the influence of obliquity forcing on climate via changes in meridional insola-tion gradients. FOAM model results also indicate the geographic distribuinsola-tions of phases between surface air temperature and insolation in the tropical Pacific (Kutzbach et al., 2008; Chen et al., 2011).
15
In order to better understand tropical Pacific climate dynamics, we recovered a CA-LYPSO core from the southeastern offshore of PNG, Northern Coral Sea (Fig. 1a), MD052928 (11◦17.26′S, 148◦51.60′E, 2250 m). The sediments are mainly composed of a mixture of carbonate and siliciclastic detritus (Beaufort et al., 2005). The site lo-cation is affected by two surface currents, the South Equatorial Current (SEC) and 20
Coral Sea Coastal Current (CSCC) (Wolanski et al., 1995), as well as by Antarctic Intermediate Water (AAIW), Circumpolar Deep Water (CPDW) and Antarctic Bottom Water (AABW) (Bostock et al., 2004; Wyrtki, 1961) connecting the regional oceanogra-phy to the southern high latitudes (Fig. 1a). The local climate has two major seasons, the northwestern monsoon during the austral summer and southeastern trades during 25
CPD
10, 1857–1899, 2014Implication on tropical climate
dynamics
L.-J. Shiau et al.
Title Page
Abstract Introduction
Conclusions References
Tables Figures
◭ ◮
◭ ◮
Back Close
Full Screen / Esc
Printer-friendly Version Interactive Discussion
Discussion
P
a
per
|
D
iscussion
P
a
per
|
Discussion
P
a
per
|
Discuss
ion
P
a
per
|
We compare our 320 kyr long high resolution UK37′-SST record from core MD052928, to other SST records from the tropical Pacific including the WPWP, the EEP upwelling area and the South China Sea (SCS) (Fig. 1a). We document the timing of SST from these locations relative to local insolation, Antarctica temperature, and greenhouse gases (GHGs) by using time series methods in order to reveal underlying mechanisms 5
driving surface temperature change.
2 Methods
2.1 Age model
We used 10 AMS-14C dates of planktonic foraminiferaGlobigerinoides ruber and Glo-bigerinoides sacculifer and compared oxygen isotopes of benthic foraminifera
Uvige-10
rinaspp. with the LR04 stack (Lisiecki and Raymo, 2005) to establish the age model of core MD052928. The detailed AMS-14C and oxygen isotope measurements and the age model had been described in Liao (2008) and Shiau et al. (2012).
2.2 UK37′ paleothermometer
The SST biomarker we used is the alkenone-derived UK37′ index (Prahl and Wakeham, 15
1987). In this study, we analyzed the whole 24 m of core MD052928. The top 6 m was sampled at 5 cm intervals, below 6 m, we sample at 10 cm intervals except termination II (1170–1270 cm) where we sampled at 5 cm for a total of 300 samples. We calibrated the UK37′-SST by using the nonlinear calibration of Conte et al. (2006) which is based on alkenones from surface water particulates collected from the world ocean, the esti-20
mated SST error is 1.2◦C (Conte et al., 2006). The modern sediment trap observation on the western equatorial Pacific indicates the C37alkenones flux is with three maxima
CPD
10, 1857–1899, 2014Implication on tropical climate
dynamics
L.-J. Shiau et al.
Title Page
Abstract Introduction
Conclusions References
Tables Figures
◭ ◮
◭ ◮
Back Close
Full Screen / Esc
Printer-friendly Version Interactive Discussion
Discussion
P
a
per
|
D
iscussion
P
a
per
|
Discussion
P
a
per
|
Discuss
ion
P
a
per
|
SST average of these high C37 alkenones flux periods, and close to the modern an-nual mean SST (Fig. 1). For the analytical procedure, we extracted the lipids with an Accelerated Solvent Extractor (DIONEX ASE 200) using a mixture of dichloromethane: methanol (6 : 4 v/v) at a temperature of 100◦C and a pressure of 7.6×10⁶Pa from the
freeze-dried sediment samples. After the extraction, we used silica gel column chro-5
matography to separate alkenones from the extracts. We eluted the alkenones using toluene. Then we analyzed the alkenones by gas chromatography with flame ionization detector. The alkenone analysis procedures are described in Yamamoto et al. (2000).
3 Results
3.1 The SST records of MD052928
10
The SST of MD052928 varies between 26.5–29◦C, indicating obvious glacial– interglacial variation (Fig. 2). The warmest periods are the Holocene and MIS 5.5. During these two intervals temperatures exceed the upper limit of the C37 alkenone
calibration and are truncated at 28.7◦C (Conte et al., 2006). Other interglacial periods, such as MIS 5.1, MIS 5.3, MIS 7.1, MIS 7.3, MIS 7.5 and MIS 9, SST are cooler than 15
in the Holocene and MIS 5.5, ranging between 28 and 28.5◦C.
During the glacial periods, the coldest SST occurred at the LGM (19–23 kyr BP) and MIS 8.2 (∼260 kyr BP), the lowest SST is ∼26.5◦C. Within other glacial periods and
some cold stages in interglacials (e.g. MIS 7.4) the SST is between 27 and 28◦C except for MIS 6.5 and MIS 8.5 that exceed 28◦C and are warmer than other glacials. 20
We also note that SST changes lead ice volume at the three terminations, especially at Termination II where the SST leads by∼4 kyr. These SST findings are consistent with
CPD
10, 1857–1899, 2014Implication on tropical climate
dynamics
L.-J. Shiau et al.
Title Page
Abstract Introduction
Conclusions References
Tables Figures
◭ ◮
◭ ◮
Back Close
Full Screen / Esc
Printer-friendly Version Interactive Discussion
Discussion
P
a
per
|
D
iscussion
P
a
per
|
Discussion
P
a
per
|
Discuss
ion
P
a
per
|
3.2 Comparison of SST records across the tropical Pacific
In this study, we compare the MD052928 SST record with other SST records from the tropical Pacific region (Fig. 1a). The modern annual SST cycles for these sites are shown in Fig. 1b. Seasonal amplitudes are small for sites in the core of the warm pool and larger for cold tongue and continental margin sites. Two sites stand out with regard 5
to seasonal amplitude. ODP 1146 has a 6◦C seasonal amplitude driven by cold winter monsoon winds offthe Asian continent. ODP 846 has a 6◦C amplitude driven by
sea-sonally strengthened upwelling during the prevalent SE trade period at boreal summer in the EEP cold tongue. These modern seasonal amplitudes carry through the paleo record, with ODP 1146 and ODP 846 having the highest amplitude SST records over 10
the past 320 kyr (Fig. 3). Prior to intercomparisons of SST records, we have assessed the various age models in order to compare them with confidence. Where available, we prefer to use age models constructed on the basis of benthic foraminiferal oxygen isotopes because it is less affected by surface hydrologic conditions. The age models of ODP 846 (Liu and Herbert, 2004) and ODP 1146 (Clemens et al., 2008) were con-15
structed using benthic oxygen isotopes. However, ODP 806 (Medina-Elizalde and Lea, 2005) used planktic oxygen isotopes. In this case, we used the age model of Bickert et al. (1993) which is based on the benthic oxygen isotopes although cross spectral comparison of the benthic and planktic-based age models in this case indicates neg-ligible phase differences. MD972140 and MD972142 have no benthic oxygen isotope 20
records; for these cores we use the planktic records.
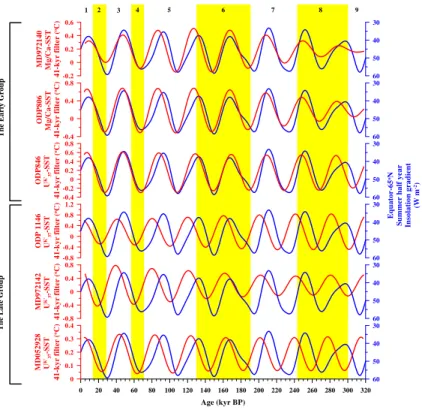
SST time-series comparisons are illustrated in Fig. 3. Glacial-interglacial SSTs varia-tions are 2–3◦C with the exception of sites ODP 1146, ODP 846, and MD972142 which have ranges of∼4◦C. All these three records show larger modern seasonal
temper-ature ranges as well (Fig. 1b). On this basis, one might interpret low tempertemper-atures at 25
CPD
10, 1857–1899, 2014Implication on tropical climate
dynamics
L.-J. Shiau et al.
Title Page
Abstract Introduction
Conclusions References
Tables Figures
◭ ◮
◭ ◮
Back Close
Full Screen / Esc
Printer-friendly Version Interactive Discussion
Discussion
P
a
per
|
D
iscussion
P
a
per
|
Discussion
P
a
per
|
Discuss
ion
P
a
per
|
cold water from the Peru–Chile margin during the SE trade prevails at the boreal sum-mer (Liu and Herbert, 2004). Comparing SSTs variations on the terminations, we find that the SCS SST rises concurrently with the ice volume decrease derived from the
δ18O. At other sites, SSTs increase leads ice volume terminations, especially at termi-nation II. In addition, we did cross-spectral analysis of SST relative to orbital eccentricity 5
(100-kyr), obliquity (41-kyr), and precession (23-kyr) (ETP) (Fig. 4 and Fig. 5). All spec-tra indicate the strongest concenspec-tration of variance at the eccentricity band indicating a strong link between equatorial SST and high latitude ice volume. All records indicate statistically significant coherence (>80 %) with all orbital parameters (ETP) with the exception of MD972140 at the obliquity band and ODP 846 at the precession band. 10
In order to discuss the phases of tropical Pacific SSTs we plot all results reactive toδ18O from the same core, assigning δ18O to the SPECMAP (Imbrie et al., 1984) phases reactive to ETP. Details are described in the Supplement. Briefly, we applied the cross correlation function to adjust the lags ofδ18O records in order to get better correlation to SPECMAP. After this adjustment, these sixδ18O records are in phase 15
with SPECMAP on the three orbital bands suggesting we have a reference time frame to compare tropical Pacific SST phases on the orbital time scale. These phase results are summarized and shown in the Supplement, Table 1, and illustrated in Fig. 5.
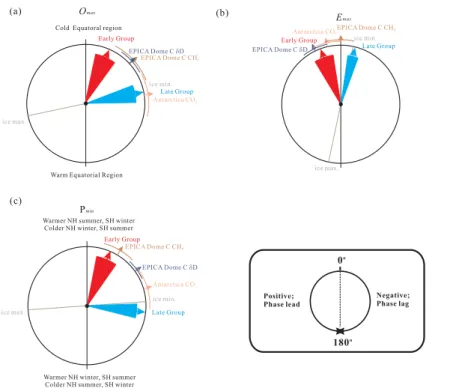
The SST records can be separated into two groups when considering SST phase relative to changes in orbital forcing, ice volume, air temperature and GHGs recorded 20
in the Antarctica ice core (Fig. 5a–c). SST maxima at open-ocean sites within primary equatorial current systems (MD972140, ODP 806 and ODP 846) slightly lag obliquity maxima, and leading CH4maxima and ice volume minima at the obliquity band. These sites lead ice volume minima and CH4 maximum at the eccentricity band as well. In
contrast, SST maxima at sites proximal to land masses (ODP 1146, MD972142, and 25
CPD
10, 1857–1899, 2014Implication on tropical climate
dynamics
L.-J. Shiau et al.
Title Page
Abstract Introduction
Conclusions References
Tables Figures
◭ ◮
◭ ◮
Back Close
Full Screen / Esc
Printer-friendly Version Interactive Discussion
Discussion
P
a
per
|
D
iscussion
P
a
per
|
Discussion
P
a
per
|
Discuss
ion
P
a
per
|
or slightly lag ice volume minima (Supplement Fig. S6c). We interpret these phase relationships in Sect. 4.2.
3.3 The comparison of tropical Pacific SSTs to GHGs and Antarctica
temperature
GHGs are be distributed globally in a short time and can be use to correlate the age of 5
ice cores between the Northern and Southern Hemisphere (EPICA community mem-bers, 2004) and may act as a trigger mechanism of tropical SST (Lea, 2004). In addi-tion, previous studies indicate the Antarctica temperature variability affects the tropical Pacific SST variability by AAIW or sub-Antarctic Mode water indicating the connec-tion between tropical Pacific and Antarctica climate changes (Toggweiler et al., 1991; 10
Stott et al., 2007; Tachikawa et al., 2009). These indicate a clear relationship among GHGs, southern high latitude temperature and tropical Pacific SST. In this study, we also compare tropical Pacific SSTs to the CH4 concentration (Loulergue et al., 2008)
and deuterium record (δD, Antarctica temperature proxy) (Jouzel et al., 2007) from EPICA Dome C using the EDC3 age model (Parrenin et al., 2007) as well as a com-15
posite CO2 record from Antarctica ice cores which is also based on the EDC3 age
model (Lüthi et al., 2008).
Figure 3 also illustrates the comparison among GHGs,δD and tropical Pacific SSTs. Both CO2and CH4 show higher concentration in interglacials, but there are some
dif-ferences between these two GHGs. For instances, higher CO2concentration extends
20
from MIS 5.5 to MIS 5.4, but CH4decreased rapidly after MIS 5.5. CH4also indicates an abrupt change around the Younger Dryas whereas CO2 does not. Open ocean
cores ODP 846, ODP 806 and MD972140 as well as MD052928, indicate slight leads or in-phase relationships between SST and GHGs at terminations whereas those in the SCS clearly lag.
25
Cross-spectral results show that CH4 is in phase with or slightly lags the
CPD
10, 1857–1899, 2014Implication on tropical climate
dynamics
L.-J. Shiau et al.
Title Page
Abstract Introduction
Conclusions References
Tables Figures
◭ ◮
◭ ◮
Back Close
Full Screen / Esc
Printer-friendly Version Interactive Discussion
Discussion
P
a
per
|
D
iscussion
P
a
per
|
Discussion
P
a
per
|
Discuss
ion
P
a
per
|
precession bands. CH4andδD lead ice volume minima at all orbital bands. At the obliq-uity band, CH4and δD lag SSTs from the open ocean and lead CO2and SSTs in the
SCS and Coral Sea. At the eccentricity band, GHGs maxima fall between SST maxima of the early and late response groups. At the precession band, CH4 is in phase with the early group SSTs and leadsδD, CO2 and the late SST group (Fig. 5). The phase
5
estimations of GHGs andδD are showed in Table 1.
4 Discussion
4.1 SST variability of the tropical Pacific
The SST variability of the tropical Pacific on annual and orbital time scales is strongly linked to geographic location. MD052928 located offPNG, on the southern margin of 10
the WPWP, has a seasonal SST variation of∼3◦C which is associated with seasonal
meridional solar insolation. During the austral summer, the local SST reaches 29◦C
due to the WPWP southward expansion. In contrast, the SST decreases to 26◦C when the WPWP contracts northward during the austral winter (Fig. 1b). The SST range at MD052928 on glacial–interglacial time scales is ∼1.5–2.5◦C (Fig. 2). This range is
15
larger than that estimated by UK37′ method for the central WPWP region which indicates
∼1◦C variation during glacial–interglacial cycles (McClymont and Rosell-Melé, 2005;
Ohkouchi et al., 1994). Thus, MD052928 is ideally located to monitor changes in the meridional extent of the WPWP on orbital time scales. In addition, we find the UK37′ -SST of core MD052928 rose earlier than ice volume change during Terminations II 20
and III, leading ice volume changes by∼4 kyrs. The early warming of SST indicates
CPD
10, 1857–1899, 2014Implication on tropical climate
dynamics
L.-J. Shiau et al.
Title Page
Abstract Introduction
Conclusions References
Tables Figures
◭ ◮
◭ ◮
Back Close
Full Screen / Esc
Printer-friendly Version Interactive Discussion
Discussion
P
a
per
|
D
iscussion
P
a
per
|
Discussion
P
a
per
|
Discuss
ion
P
a
per
|
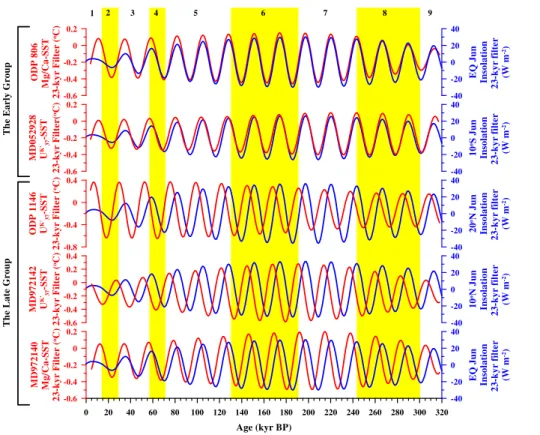
Furthermore, we found our downcore UK37′-SST record shows an obvious signal at the 23-kyr period but weak at 41-kyr (Fig. 4f). We will discuss this further in Sect. 4.2.
Comparing MD052928 SST to local insolation indicates a strong correlation to June insolation in the Southern Hemisphere (SH), especially at the 23-kyr period (Fig. 6). This result indicates MD052928 SST on the orbital time scale is associated with austral 5
winter insolation when the boreal summer solstice is at the perihelion. These relation-ships are also illustrated on the precession phase wheel (Supplement Fig. S6c). The central WPWP (ODP 806 and MD972140) is characterized by low amplitude seasonal SST variability (Fig. 1b). However, SST at ODP 806 and MD972140 show a 3◦C SST
decrease at the LGM (Fig. 3) indicating significant WPWP cooling in glacials. The cen-10
tral WPWP may be less affected by land–sea interaction in glacials and likely reflects ocean conditions more directly. The SST differences between glacials and interglacials are lower than in the SCS and eastern Pacific upwelling region. In former studies, using foraminiferal transform functions such as CLIMAP or MARGO, the WPWP area SST decreases ∼2◦C in LGM (CLIMAP, 1981; MARGO Project Members, 2009).
Previ-15
ous UK37′-SSTs studies also indicate∼1◦C variations during glacial–interglacial cycles
in the central WPWP (McClymont and Rosell-Melé, 2005; Ohkouchi et al., 1994; de Garidel-Thoron et al., 2007). These SST differences may result from different proxy responses but not affect the result that SST decreased in glacials. In addition, we note the MD052928 UK37′-SST amplitude is lower than ODP 806 and MD972140 located 20
on the central WPWP (Fig. 3). MD052928 located on the southern Margin of WPWP where should be more sensible to SST variations. Although our observation may be at-tributed to different proxies; however, some former SST studies in the Coral Sea, such as ODP 820 (16◦38′S, 146◦18′E, UK′
37-SST) (Lawrence and Herbert, 2005), MD972125
(22◦34′S, 161◦44′E, UK37′ and Mg/Ca-SST) (Tachikawa et al., 2009), and a latitudi-25
CPD
10, 1857–1899, 2014Implication on tropical climate
dynamics
L.-J. Shiau et al.
Title Page
Abstract Introduction
Conclusions References
Tables Figures
◭ ◮
◭ ◮
Back Close
Full Screen / Esc
Printer-friendly Version Interactive Discussion
Discussion
P
a
per
|
D
iscussion
P
a
per
|
Discussion
P
a
per
|
Discuss
ion
P
a
per
|
the North of∼20◦S. This indicates the small SST amplitude may be the local character
of the Coral Sea.
The SCS is a marginal sea of the Pacific and its modern annual SST changes are under the influence of the East Asian Monsoon (Wang, 1999). The modern East Asian winter monsoon results in a large north-south SST gradient whereas in summer, East 5
Asian summer monsoon yields a homogenous high SST throughout the whole SCS (Wang, 1999). The seasonal SST variations are∼2◦C (MD972142, in the
southeast-ern SCS) ∼5◦C (ODP 1146, in the northern SCS) (Fig. 1b) suggesting that paleo
variations in SST might be driven by winter dynamics. The glacial–interglacial UK37′-SST variations are∼2–4.5◦C (Fig. 3). The exposed Sunda Shelf would result in a
semi-10
closed basin that prevented the warm water from the Indo-Pacific warm pool flowing into the SCS, and combine an inflow of cold surface water via the Luzon Strait re-sulted from the stronger East Asian winter monsoon that results in larger SST decline in glacials (Wang, 1999; Steinke et al., 2008). In addition, we note the SSTs in the SCS are in phase with the oxygen isotope records (Fig. 3) that may indicate the SSTs in 15
the SCS are associated with the ice volume changes, through the strengthened winter monsoon forcing and descending sea level.
ODP 846 is located in the upwelling region of the EEP. The seasonal SST reaches a minimum in boreal summer due to the stronger SE trade resulting in the stronger SEC and EUC as well as increased strength of trade-induced upwelling (Wyrtki, 1981). 20
SST in the east is lower than in the western tropical Pacific and with a larger seasonal SST change (Fig. 1b). The annual SST variation of the EEP is ∼6◦C, higher in
bo-real spring and lower in bobo-real summer and fall. On the glacial–interglacial time scale, the UK37′-SST of ODP 846 indicates obvious glacial–interglacial variability, and the SST changes between 2.5–4◦C (Fig. 3). The previous study of Liu and Herbert (2004) in-25
CPD
10, 1857–1899, 2014Implication on tropical climate
dynamics
L.-J. Shiau et al.
Title Page
Abstract Introduction
Conclusions References
Tables Figures
◭ ◮
◭ ◮
Back Close
Full Screen / Esc
Printer-friendly Version Interactive Discussion
Discussion
P
a
per
|
D
iscussion
P
a
per
|
Discussion
P
a
per
|
Discuss
ion
P
a
per
|
high latitude feedbacks, either related to atmospheric and oceanic convection or ocean thermohaline circulation (Liu and Herbert, 2004; Martinez-Garcia et al., 2010).
These SST records indicate that SSTs are not simple responses to local insolation but, rather, can be strongly impacted by local geography (such as continental prox-imity), upwelling, and ocean and atmospheric circulation. Factors leading to the SST 5
phase grouping on the orbital timescale we will discuss in the next section.
4.2 The mechanisms of phase differences in tropical Pacific SST records
4.2.1 Obliquity and eccentricity bands
At the obliquity and eccentricity bands, two clear groupings exist. Open ocean sites (MD972140, ODP 806, and ODP 846) proximal to the equator (Fig. 4a) comprise 10
a tightly clustered early-response group that slightly lags maximum obliquity and sig-nificantly leads CH4 and ice volume minima (Figs. 5a, S6a). Between the latitudes of
∼14◦N and ◦S, increased tilt leads to decreased insolation (Kutzbach et al., 2008).
Thus, warm SST at these sites cannot be related to local insolation forcing at the obliq-uity band.
15
The early group leads the ice volume change which has been discovered in other studies on the Equatorial pacific (Lea et al., 2000; Liu and Herbert, 2004; de Garidel-Thoron et al., 2005; Medina-Elizade and Lea, 2005) indicating that ice volume change is not the main factor driving tropical, open ocean SST. ODP 846, ODP 806 and MD972140 show clear power density at the obliquity band as discussed in previous 20
studies (e.g., de Garidel-Thoron et al., 2005; Liu and Herbert, 2004; Medina-Elizade and Lea, 2005). In addition, these three does have an obvious signal and appears in phase relationship at the obliquity band (Fig. S6a, Table S1).
Raymo and Nisancioglu (2003) suggested that the insolation gradient between high and low latitudes is controlled by obliquity forcing; the heat difference between high and 25
CPD
10, 1857–1899, 2014Implication on tropical climate
dynamics
L.-J. Shiau et al.
Title Page
Abstract Introduction
Conclusions References
Tables Figures
◭ ◮
◭ ◮
Back Close
Full Screen / Esc
Printer-friendly Version Interactive Discussion
Discussion
P
a
per
|
D
iscussion
P
a
per
|
Discussion
P
a
per
|
Discuss
ion
P
a
per
|
and ODP 846 with the summer half year (21 March to 21 September) insolation gradi-ent between the equator and 65◦N, revealing an in-phase relationship at the obliquity band (Fig. 7). This result suggests the entire tropical Pacific SST at the obliquity band is strongly affected by high-low latitudes heat differences through atmospheric heat transport. In addition, the increasing high-low latitudes insolation gradient could trigger 5
stronger latitudinal atmospheric circulation (e.g. Hadley circulation). Based on Raymo and Nisancioglu’s hypothesis, the highest insolation gradient happens when the obliq-uity reaches a minimum. Our results show the maximum SST of early group is slightly lags obliquity maximum, this may indicate that weaker latitudinal circulation leads to de-creasing strength of equatorial upwelling system causing the whole equatorial Pacific 10
SST to become warmer.
The late group (MD972142, ODP 1146, and MD052928) comprise sites proximal to land masses and lags the insolation gradient minimum and is in phase with or slightly lags ice volume minimum at the obliquity band (Figs. 5a and 7). The late group, con-sisting of sites proximal to land, appears to be affected by processes linked to high lat-15
itude ice volume. MD972142 and ODP 1146 located in the SCS where is surrounded by the Asian continent, Philippine archipelago, and exposed Sunda Shelf during the glacial that results in a lowstand condition. In glacial periods, the warm water from the Indo-Pacific warm pool could not flow through the exposed Sunda Shelf. In addition, the stronger winter monsoon also results in cooler SST in the SCS during glacial as 20
we discussed in Sect. 4.1. Therefore, SST phases in the SCS might be attributed to the warm water inhibited by the exposed landmass and monsoon system at the obliq-uity and eccentricity bands. MD052928, located on the northern Coral Sea in which is a relatively opener basin than the SCS. However, MD052928 was close to the exposed Sahul Shelf during the lowstand period. The exposed Sahul Shelf and the New Guinea 25
CPD
10, 1857–1899, 2014Implication on tropical climate
dynamics
L.-J. Shiau et al.
Title Page
Abstract Introduction
Conclusions References
Tables Figures
◭ ◮
◭ ◮
Back Close
Full Screen / Esc
Printer-friendly Version Interactive Discussion
Discussion
P
a
per
|
D
iscussion
P
a
per
|
Discussion
P
a
per
|
Discuss
ion
P
a
per
|
Furthermore, we also note the late group lags to the CH4, Antarctica δD record, and in phase with the CO2 (Fig. 5a) which may indicate the maximum SSTs of the
late group could be related to high latitude forcing. At the obliquity band, the phase relationship among the early and late groups, GHGs and Antarctica δD record may reveal the warmer tropical SST resulting in more CH4 released and the warmer high
5
latitude area, then resulting in the continental ice volume minimum and the rising SSTs proximal to land masses.
Early studies of insolation at the eccentricity band indicate high eccentricity at peri-helion results in more heat flux in the tropical latitude due to the effects of the 2 times overhead passages of the sun during each year (Ashkenazy and Gildor, 2008; Berger, 10
2006; Short et al., 1991). Short et al. (1991) used an energy balance model (EBM) to stimulate the thermal responses of different regions finding the equatorial area has a stronger response at the eccentricity band, whereas the tropical land masses have enhanced thermal responses at all the orbital bands, especially on the eccentricity and precession bands. However, our early group SST phase leads the eccentricity maxima, 15
the orbital configuration might not be the major control factor at this band. Shackleton (2000) studied the phase relationships of deep-Pacific temperature, Antarctica air tem-perature and CO2concentration from the Vostok ice core to the ice volume and found
the former three proxies all lead the ice volume change and ETP at the eccentricity band. He suggested the eccentricity signal resulted from changes of global carbon 20
cycle caused by the atmospheric CO2 concentration. In recent, a model study also
suggests different CO2 concentrations play an important role on the amplification on
the eccentricity cycle (Ganopolski and Calvo, 2011). SST phases of early group are in phase with the CO2concentration at the eccentricity band may support this hypothesis.
Nevertheless, we still need longer records and more evidences to discuss the role of 25
the global carbon cycle on the eccentricity band.
CPD
10, 1857–1899, 2014Implication on tropical climate
dynamics
L.-J. Shiau et al.
Title Page
Abstract Introduction
Conclusions References
Tables Figures
◭ ◮
◭ ◮
Back Close
Full Screen / Esc
Printer-friendly Version Interactive Discussion
Discussion
P
a
per
|
D
iscussion
P
a
per
|
Discussion
P
a
per
|
Discuss
ion
P
a
per
|
maxima. Warmer equatorial Pacific SST heads to increased atmospheric moisture and tropical rainfall leading to expand tropical wetlands and increase CH4 production.
In-creased CH4 promotes increased deglaciation and CO2 leading to increase
continen-tal and continencontinen-tal margin surface temperatures. At the eccentricity band, although the SSTs, GHGs and AntarcticaδD also indicate similar phase relationship as the obliquity 5
band, however, the phase lead of the early group SSTs is still not well explained.
4.2.2 Precession band
At the precession band, all SST records have obvious 23-kyr power (Fig. 4), and the phase can also be separated into 2 groups (Fig. 5c). However, unlike the eccentricity and obliquity bands these groupings do not reflect open-ocean and continental prox-10
imity simply. The early group includes MD052928 and ODP 806 located in the WPWP. As in the eccentricity and obliquity bands, the early group slightly leads CH4and
sig-nificantly also leads the ice volume minimum. The late group includes MD972142 and ODP 1146 located in the SCS and MD972140 located on the western margin of WPWP. The late group lags ice volume minimum to a slightly greater extent than at obliquity 15
and eccentricity bands. ODP 846 in the EEP has no significant coherence precession band so we don’t discuss its phase variation.
The early group phases are close to the boreal summer solstice at the perihelion, when the solar radiation reaches the maximum in the Northern Hemisphere (NH) at the boreal summer (Fig. 6). However, in this case, the phase of the SH site (MD052928) 20
indicates a link to winter dynamics; SST maxima at the time of warmest SH winter. The modern observation indicates the WPWP moves northward and the SST decreases in the MD052928 site during the boreal summer (austral winter). However, our result reveals the SSTs of the early group are in phase with the local insolation during the boreal summer solstice at the perihelion at the precession band indicating the WPWP 25
CPD
10, 1857–1899, 2014Implication on tropical climate
dynamics
L.-J. Shiau et al.
Title Page
Abstract Introduction
Conclusions References
Tables Figures
◭ ◮
◭ ◮
Back Close
Full Screen / Esc
Printer-friendly Version Interactive Discussion
Discussion
P
a
per
|
D
iscussion
P
a
per
|
Discussion
P
a
per
|
Discuss
ion
P
a
per
|
indicating there are some internal mechanisms acting on the late group at the preces-sion band.
The late group includes three SST records, MD972142 and ODP 1146 from the SCS and MD972140 from the western part of WPWP. It shows very large lags relative to direct local insolation forcing during the boreal summer and the ice volume minima 5
indicating there are some internal mechanisms acting on the late group at the preces-sion band (Figs. 5c and 6). In addition, the SCS is a relatively closed basin compared to the open ocean and surrounded by the Asian continent and the Philippine and In-donesian archipelagos, and the shallow Sunda Shelf located on the southern SCS. These two records reveal a phase similar to the previous SST records from Asian sum-10
mer monsoon regions at the precession band (Chen et al., 2003; Clemens and Prell, 2003). We infer that the SCS records may be caused by the timing of increased EASM winds, driving clockwise circulation in the SCS, bringing warm waters to these sites (Wang, 1999). If so, the exposed or submerged Sunda Shelf controlled by the ice vol-ume change might affect the warm surface water flow into the SCS from the tropical 15
Eastern Indian Ocean and the WPWP during the summer.
MD972140, however, its SST phase lags ODP 806 and MD052928 on the precession band whereas they located on the WPWP region (Supplement Fig. S6c). This might be associated with its location. The New Guinea and Indonesian archipelago are under the Australian monsoon system that is associated with the East Asian Monsoon in 20
the modern world (Suppiah and Wu, 1998). Previous studies also suggested that East Asian-Australian monsoon system influences climate variations on this region at the precession band (e.g. Tachikawa et al., 2011; Shiau et al., 2012). MD972140 located on the western part of WPWP, between the central WPWP and the Asian continent that may be affected by the East Asian-Australian monsoon system. Its phase also 25
CPD
10, 1857–1899, 2014Implication on tropical climate
dynamics
L.-J. Shiau et al.
Title Page
Abstract Introduction
Conclusions References
Tables Figures
◭ ◮
◭ ◮
Back Close
Full Screen / Esc
Printer-friendly Version Interactive Discussion
Discussion
P
a
per
|
D
iscussion
P
a
per
|
Discussion
P
a
per
|
Discuss
ion
P
a
per
|
works. This theory suggests the relatively cold, salty water from the Pacific enters the SCS through the Luzon Strait, through the monsoon and upwelling dynamics to form the warmer and fresher SCSTF in the SCS basin flowing southward then exits the SCS through the Karimata Strait with a shallow water depth (∼40 m) into the Indonesian
maritime continent. The SCSTF is suggested as a conveyor belt transferring up to 5
0.2 PW of heat and 0.1 Sv of freshwater from the SCS into the Indonesian maritime continent (Qu et al., 2006). The relatively warmer and fresher SCSTF flows into the Makassar Strait and forms a northward surface current then returns into the tropical Pacific (Qu et al., 2005). Furthermore, the model study suggested that the SCSTF would promote the northward heat and water transport in the Makassar Strait during 10
the boreal winter that could enhance the increased SST in the tropical Pacific (Tozuka et al., 2007). MD972140 located on the western WPWP, whereas its SST is in phase with the ice volume minimum and belongs to the late group on the precession band (Fig. S6c) suggesting not only the local seasonal insolation as the early group but also other mechanisms. MD972140 SST might be possibly affected by the SCSTF during 15
the interglacial periods. The SCSTF could exit the SCS through the Karimata Strait and flow into the Indonesian maritime continent easily during the highstand condition in interglacials. MD972140 might be under complex interactions of East Asian-Australian monsoon system, local insolation and the SCSTF resulting in its SST phase lag to other WPWP sites on the precession bands. Although the SST records of the late 20
group are located in the tropics, however, their SSTs are not controlled by the local insolation directly that may be also associated with other internal mechanisms, such as the monsoon, land–sea configuration, and local ocean and atmospheric circulations. Previous studies indicate significant effects of precession on the tropical climate (Beaufort et al., 2001; Clement et al., 1999; Short and Mengel, 1986). In this study, 25
CPD
10, 1857–1899, 2014Implication on tropical climate
dynamics
L.-J. Shiau et al.
Title Page
Abstract Introduction
Conclusions References
Tables Figures
◭ ◮
◭ ◮
Back Close
Full Screen / Esc
Printer-friendly Version Interactive Discussion
Discussion
P
a
per
|
D
iscussion
P
a
per
|
Discussion
P
a
per
|
Discuss
ion
P
a
per
|
At the precession band, SSTs, GHGs andδD show the similar phase relationship as the obliquity band (Fig. 5a and c) and indicate the same scenario as the obliquity band. Higher local insolation leads the warmer WPWP resulting in higher moisture supply and stronger tropical rainfall and the expansion of tropical wetlands. Then increased CH4 production promotes increased deglaciation and CO2leading to increased continental
5
and continental margin surface temperatures. The difference is that the early group SSTs is associated with the local insolation during the boreal summer directly and distributed on the WPWP, which show the WPWP may play an important role on the global climate system at the precession band.
4.3 Phase relationships among tropical Pacific SST variability, GHGs, and
10
Antarctic temperature on the orbital time scale
CH4shows an earlier phase relative to CO2at the obliquity and precession bands, and a lag relative to the early group. CH4 is a stronger GHGs with the second radiative
forcing after CO2(Forster et al., 2007) and has a variety of high- and low-latitude
wet-lands and animals sources (Chappellaz et al., 1993a), marine clathrates (Kennett et al., 15
2000), and thermokarst lakes (Walter et al., 2007) in nature and other anthropogenic sources (e.g. enhanced biomass burning, and rice agriculture) (Forster et al., 2007). Chappellaz et al. (1993a) estimated the annual atmospheric CH4nature budgets in the LGM and pre-industrial Holocene are 120 and 180 Tg yr−1, respectively, which indicates that the difference of atmospheric CH4 between LGM and pre-industrial Holocene is
20
mostly contributed by the expanded wetlands in tropical and NH high latitude. Evidence from measuringδD of CH4(Sower, 2006) and cosmogenic
14
C of CH4(Petrenko et al.,
2009, 2013) in ice cores suggest that the marine clathrate is not a major driver for the abrupt climate change such as Younger Dryas or Heinrich events. The rising sea level also results in some wetlands on the shelf in deglacials. The original vegetation on the 25
shelf buried and decomposed in the wetland when the sea rise in deglacials that could also contributes a part of CH4 into atmosphere (Ridgwell et al., 2012). These results
CPD
10, 1857–1899, 2014Implication on tropical climate
dynamics
L.-J. Shiau et al.
Title Page
Abstract Introduction
Conclusions References
Tables Figures
◭ ◮
◭ ◮
Back Close
Full Screen / Esc
Printer-friendly Version Interactive Discussion
Discussion
P
a
per
|
D
iscussion
P
a
per
|
Discussion
P
a
per
|
Discuss
ion
P
a
per
|
addition, one of the major atmospheric CH4sinks is through the oxidation in the tropo-sphere by reaction with hydroxyl radicals (Forster et al., 2007), which appears to bring minimal effects on the variations of CH4concentration in the glacial–interglacial cycles
(Chappellaz et al., 1993a; Thompson et al., 1993, and Singarayer et al., 2011).
In this research, phases of tropical SSTs maxima all lead the CH4 maxima at the
5
three orbital bands (Fig. 5). Higher tropical SST could result in more evaporation over the tropical ocean that may induce more rainfall on the tropical land and expanded wet-lands. Chappellaz et al. (1993b) suggested the low latitude moisture fluctuations may play an important role in changes of atmospheric CH4during the deglaciation. From the
LGM to the pre-industrial Holocene, the variation of annual CH4 emission flux change 10
is 60 Tg yr−1. Approximately 50 % of the CH
4 emission flux was contributed from the
tropics and the remaining were mainly sourced from wetlands in boreal high latitudes (Chappellaz et al., 1993a). Loulergue et al. (2008) studied the CH4 in the Dome C
ice core and found the strength of tropical CH4 budgets influenced by monsoon sys-tems and with an additional source input during major terminations as the retreat of 15
the northern ice sheet allowed higher CH4emissions from boreal periglacial wetlands.
Guo et al. (2012) analyzed the Dome C CH4concentration and Chinese loess weath-ering data pointing out the global monsoon changes have been a constant driver of atmospheric CH4, and the tropical insolation play an important role, especially on the
precession and semi-precession bands. Recently, a model study suggested the rising 20
atmospheric CH4concentration during the Holocene and the end of the last interglacial
period is associated with the enhanced precipitation and expanded wetlands in the tropics linked to the nature changes in the Earth’s orbital configuration, especially on the precession band (Singarayer et al., 2011). In this scenario, the increasing tropical insolation and warmer tropical SST would lead to variations in the hydrological cycles 25
at low latitudes enhancing CH4 emissions. The phase relationship of the early group SSTs and CH4 maxima at the precession band shown in this study (Fig. 5c) supports
these model results. On the obliquity band, however, the CH4 maximum slightly lags
CPD
10, 1857–1899, 2014Implication on tropical climate
dynamics
L.-J. Shiau et al.
Title Page
Abstract Introduction
Conclusions References
Tables Figures
◭ ◮
◭ ◮
Back Close
Full Screen / Esc
Printer-friendly Version Interactive Discussion
Discussion
P
a
per
|
D
iscussion
P
a
per
|
Discussion
P
a
per
|
Discuss
ion
P
a
per
|
supply more moisture on the tropical land that might enhance the precipitation over the tropical lands and tropical wetland expansion in this band. In addition, the obliquity maximum could result in warmer climate in the high latitudes, especially on the NH. The warmer climate on the northern high latitudes would result in ice melting and more wetland that also promotes CH4production. On the eccentricity band, the early group 5
of SSTs is also in phase with CH4 maxima (Fig. 5b), however, the SSTs lead the
ec-centricity maxima which indicate that other internal forcings, such as the global carbon cycle (Shackleton, 2000) may play important roles at this band. All these observations suggest the early warming of tropical SST resulted from tropical insolation changes is primarily responsible for the expansion of tropical wetlands and therefore the in-10
creases of CH4emission in glacial–interglacial cycles. A modern observation indicates
the imhomogenous warming SST over the WPWP results in anomalous meridional circulation induced the rising motion and increasing precipitation trend on tropical SH (Feng et al., 2013). This anomalous ascending south of the equator is due to the larger warming trend of WPWP SST in the SH. In our SST records, MD052928 and ODP 806 15
located on the tropical SH and equator, respectively, slightly leading MD972140 located on the north of equator during the deglaciation (Fig. 3), which might result in difference warming trend over the WPWP on the orbital time scale and enhance higher precipita-tion and CH4 emission in the tropical SH. Furthermore, the WPWP was also close to
exposed Sunda and Sahul shelves located on the tropical SH in glacials that could re-20
sult in the large expanded wetland during glacials to interglacials until the sea level rose to overlap the shelves. Wetlands resulted from gradually flooding on these shelves also enhances a part of atmospheric CH4 besides the more precipitation (Rigdwell et al.,
2012). In addition, orbital configurations of obliquity maxima and precession minima forcing would enhance the ice sheet melting on high latitudes that may result in more 25
periglacial wetlands and more additional CH4 emission, though the lifetime of CH4 in
atmosphere is very short (∼12 yr) (Forster et al., 2007).
CPD
10, 1857–1899, 2014Implication on tropical climate
dynamics
L.-J. Shiau et al.
Title Page
Abstract Introduction
Conclusions References
Tables Figures
◭ ◮
◭ ◮
Back Close
Full Screen / Esc
Printer-friendly Version Interactive Discussion
Discussion
P
a
per
|
D
iscussion
P
a
per
|
Discussion
P
a
per
|
Discuss
ion
P
a
per
|
2007). TheδD variability lags relative to the early SST group at obliquity and preces-sion bands, and is in phase at the eccentricity band (Fig. 5). The early group SSTs lead at obliquity and precession bands indicates that tropical Pacific SSTs of the open ocean and WPWP are not influenced by the southern high latitudes directly as previous stud-ies (e.g. Stott et al., 2007) but are mainly affected by low latitude insolation forcing. With 5
satellite observation indicating that heat transport in the Pacific is from the low to high latitudes (Hasterath, 1982), this result suggests that the early warming of the tropical Pacific is driven by local insolation changes that lead southern high latitude warming. In addition, the variations ofδD in ice cores are in-phase with CH4 at all orbital bands
(Fig. 5) that indicate the increases of atmospheric CH4concentrations provide a posi-10
tive feedback that contributes the southern high latitudes warming. Thus, the latitudinal heat transport in the Pacific in conjunction with the warming effect from CH4 during
the increases of high latitude insolation would result in the warming of southern high latitudes, the retreat of sea ice, and the ice sheet melting on the Antarctica during the deglaciation.
15
The warming of southern high latitudes results in the melting of sea ice and Antarc-tica ice sheet that would change the ocean currents around the Antarctic and promote the CO2rising in atmosphere (Stott et al., 2007). CO2is a long-lived GHG with strong
radiative forcing (Forster et al., 2007). The ocean processes are proposed as the cause of CO2changes during the glacial–interglacial cycle (Jansen et al., 2007). The ocean is 20
the largest of the relatively fast-exchanging (<1 kyr) carbon reservoir, and the terrestrial change only is not sufficient to explain the low CO2during glacial (Sigman and Boyle,
2000; Jansen et al., 2007). There are several mechanisms including ocean circulation, marine biological activity, ocean-sediment interactions, seawater carbonate chemistry and air–sea exchange have been proposed to explain the atmosphericpCO2changes
25
in glacial–interglacial time scales (Jansen et al., 2007). Though all these mechanisms are complicated, the Southern Ocean is thought to be an important driver on glacial– interglacial atmospheric pCO2 changes (Sigman et al., 2010). The change in
CPD
10, 1857–1899, 2014Implication on tropical climate
dynamics
L.-J. Shiau et al.
Title Page
Abstract Introduction
Conclusions References
Tables Figures
◭ ◮
◭ ◮
Back Close
Full Screen / Esc
Printer-friendly Version Interactive Discussion
Discussion
P
a
per
|
D
iscussion
P
a
per
|
Discussion
P
a
per
|
Discuss
ion
P
a
per
|
surface water and the underlying deep water that have closed the valve of CO2 re-leasing to atmosphere during glacials (Sigman et al., 2010). Paleceanographic records (Stott et al., 2007) based on deep-sea temperature suggest that the increase of austral spring insolation would result in the retreat of sea ice and the decrease of stratification by enhanced Ekman transport that would have led to stronger air–sea exchange and 5
rising CO2 during the deglaciation. Opal flux reconstructions in the Southern Ocean
(Anderson et al., 2009) also suggest that the strengthened upwelling would enhance the atmosphericpCO2. SST reconstructions of the tropical and southern Pacific show
an early warming than the CO2rise during the Termination I (Tachikawa et al., 2009),
providing another support to this mechanism. Other physical parameters may affect the 10
CO2change during glacial–interglacial cycles. For example, the ocean SST and salinity changes may possibly affect thepCO2 variability during the glacial–interglacial cycle.
In a calculation for thepCO2 variability due to the tropical SST and salinity (Sigman
and Boyle, 2000), 5◦C variability in tropical SST and 3 % salinity changes in the ocean
during the glacial–interglacial cycle only account forpCO2 variability of 23.5 ppmv. in
15
the total glacial–interglacial variation of∼80 ppmv.
Our results indicate that the CO2maxima are in-phase with the early group of SSTs at the eccentricity band, but lag to the early group at obliquity and precession bands (Fig. 5). The phase of CO2maxima at the eccentricity band might reflect the influence
of global carbon cycle at eccentricity frequency (Shackleton, 2000) and the effects on 20
tropical SSTs (e.g. Lea, 2004; Medina-Elizadle and Lea, 2005). The early group of tropical Pacific SSTs in phase with Antarctic CO2at the eccentricity band shown in this
study supports the CO2 trigger mechanism at this band (Fig. 5b). On the other hand, the early groups of SSTs lead Antarctic CO2record at obliquity and precession bands,
and the late groups are in phase with CO2at the obliquity band and lag to CO2at the
25
precession band (Fig. 5a, c). These indicate that CO2may not be the major controlling factor on the tropical SST on obliquity and precession cycles. A box core study (ERDC-92) of the western equatorial Pacific, which is one of the CO2source regions during the
CPD
10, 1857–1899, 2014Implication on tropical climate
dynamics
L.-J. Shiau et al.
Title Page
Abstract Introduction
Conclusions References
Tables Figures
◭ ◮
◭ ◮
Back Close
Full Screen / Esc
Printer-friendly Version Interactive Discussion
Discussion
P
a
per
|
D
iscussion
P
a
per
|
Discussion
P
a
per
|
Discuss
ion
P
a
per
|
isotope estimatedpCO2maxima (Palmer and Pearson, 2003). If the early warming on tropical ocean could act efficiently to supply more moisture to make an expansion of tropical wetlands and more CH4 emissions, then the increases of CH4would
acceler-ate the warming in southern high latitudes and enhance the retreat of sea ice and ice sheet melting in Antarctica. In summary, our phase results of tropical SSTs, CH4,δD
5
and CO2 reveals the following scenario: the insolation at low latitudes results in the
early warming of the tropical open ocean, and then trigger the atmospheric CH4 con-centration which in turn forms a positive feedback that may accelerate the deglaciation, then changing the ocean circulation frame in the southern high latitudes and rising of
pCO2, and the increase of tropical SST in the marginal seas. The GHGs and high lati-10
tude warming may not be the major factors controlling the tropical climate. In contrast, the early warming of tropical open ocean and WPWP resulted from the insolation that may play an important role on the deglaciation during the glacial–interglacial cycle.
5 Conclusions
Core MD052928 from the southern Papua New Guinea provides a high resolution UK37′ -15
SST record revealing the variability of the southern WPWP margin and is ideally lo-cated to monitor the meridional extent of the WPWP. The downcore UK37′-SST of core MD052928 shows the∼1.5–2.5◦C variations during the glacial–interglacial variations
and an obvious precession period associated to the local austral winter dynamics. However, the lower SST variation amplitude than in the central WPWP that may be 20
attributed to the local character of the Coral Sea.
All tropical Pacific SST records from the three different areas: the WPWP, SCS, and cold tongue in the EEP. Comparisons of the SST records from these three areas in-dicate that SSTs are not simple responses to their local insolation but, rather can be strongly impacted by local geography, such as continental proximity, upwelling, and 25
CPD
10, 1857–1899, 2014Implication on tropical climate
dynamics
L.-J. Shiau et al.
Title Page
Abstract Introduction
Conclusions References
Tables Figures
◭ ◮
◭ ◮
Back Close
Full Screen / Esc
Printer-friendly Version Interactive Discussion
Discussion
P
a
per
|
D
iscussion
P
a
per
|
Discussion
P
a
per
|
Discuss
ion
P
a
per
|
Cross-Spectral results of tropical Pacific SSTs indicate the SSTs could be separated into two groups at all orbital periods. At the obliquity and eccentricity bands, the early group includes ODP 846, ODP 806 and MD972140 which located on the open ocean and proximal to the equator. The late group consists of ODP 1146, MD972142 and MD052928 which are proximal to the Asian and Australian continents. At the preces-5
sion band, the two groups are different from the obliquity and eccentricity bands. The early group consists of ODP 806 and MD052928 which located on the WPWP, and the late group includes ODP 1146 and MD972142 located on the SCS and MD972140 located on the western part of WPWP. These results indicate that the changes in high-low latitudes insolation gradient and tropical local insolation during boreal summer re-10
sulting in the warmer SST in the equatorial Pacific and WPWP. Warmer tropical SST leads to more rainfall and the expansion of wetlands in tropical regions resulting in in-creasing the atmospheric CH4 concentration. Increased CH4 promotes the increased
deglaciation and CO2 leading to increased continents and continental margin surface temperatures.
15
These results suggest the GHGs and early warming in the southern high latitude may be not the major factors controlling the tropical Pacific SSTs variability at the orbital time scale. The tropical climate dynamics in the open ocean is dominated by the low latitude insolation variation, and influences high latitudes through atmosphere and ocean cir-culations; however, the land–sea distribution, feedbacks of continental ice sheets and 20
GHGs could result in the more complex interactions that may affect the heat transport from the low to high latitudes, and the global climate system.
Supplementary material related to this article is available online at
http://www.clim-past-discuss.net/10/1857/2014/cpd-10-1857-2014-supplement. zip.
25
Acknowledgements. We thank N.R. Wan and H. Li in Department of Earth Sciences,
CPD
10, 1857–1899, 2014Implication on tropical climate
dynamics
L.-J. Shiau et al.
Title Page
Abstract Introduction
Conclusions References
Tables Figures
◭ ◮
◭ ◮
Back Close
Full Screen / Esc
Printer-friendly Version Interactive Discussion
Discussion
P
a
per
|
D
iscussion
P
a
per
|
Discussion
P
a
per
|
Discuss
ion
P
a
per
|
the National Science Council and National Taiwan Ocean University, Republic of China. This study is supported by the grant NSC97-2917-I-019-103 to L.-J. Shiau from the National Science Council, Republic of China.
References
Anderson, D. M., Prell, W. L., and Barratt, N. J.: Estimates of sea surface temperature in the
5
Coral Sea at the last glacial maximum, Paleoceanography, 4, 615–627, 1989.
Anderson, R. F., Ali, S., Bradtmiller, L. I., Nielsen, S. H. H., Fleisher, M. Q., Anderson, B. E., and Burckle, L. H.: Wind-driven upwelling in the Southern Ocean and the deglacial rise in
Atmospheric CO2, Science, 323, 1443–1448, 2009.
Ashkenazy, Y. and Gildor, H.: Timing and significance of maximum and minimum equatorial
10
insolation, Paleoceanography, 23, PA1206, doi:10.1029/2007PA001436, 2008.
Beaufort, L., de Garidel-Thoron, T., Mix, A. C., and Pisias, N. G.: ENSO-like Forcing on Oceanic Primary Production During the Late Pleistocene, Science, 293, 2440–2444, 2001.
Beaufort, L., Chen, M.-T., Droxler, A. W., Yokoyama, Y., Balut, Y., and Rothe, S.: MD148-PECTEN IMAGES XIII Cruise Report, Institut Polaire Francais, Plouzané, 80 pp., 2005.
15
Berger, A., Loutre, M. F., and Mélice, J. L.: Equatorial insolation: from precession harmonics to eccentricity frequencies, Clim. Past, 2, 131–136, doi:10.5194/cp-2-131-2006, 2006.
Bickert, T., Berger, W. H., Burke, S., Schmidt, H., and Wefer, G.: Late Quaternary stable isotope record of benthic foraminiferas: sites 805 and 806, Ontong Java Plateau, in: Proceedings of the Ocean Drilling Program, Scientific Results, 130, edited by: Berger, W. H., Kroenke, L. W.,
20
Janecek, T. R., and Sliter, W. V., College Station, TX, 411–420, 1993.
Bostock, H. C., Opdyke, B. N., Gagan, M. K., and Fifield, L. K.: Carbon isotope ev-idence for changes in Antarctic Intermediate Water circulation and ocean ventilation in the southwest Pacific during the last deglaciation, Paleoceanography, 19, PA4013, doi:10.1029/2004PA001047, 2004.
25
Chappellaz, J. A., Fung, I. Y., and Thompson, A. M.: The atmospheric CH4increase since the
Last Glacial Maximum (1). Source estimates. Tellus B, 45, 228–241, 1993a.
Chappellaz, J., Bluniert, T., Raynaud, D., Barnola, J. M., Schwander, J., and Stauffert, B.:
Syn-chronous changes in atmospheric CH4 and Greenland climate between 40 and 8 kyr BP,
Nature, 366, 443–445, 1993b.
CPD
10, 1857–1899, 2014Implication on tropical climate
dynamics
L.-J. Shiau et al.
Title Page
Abstract Introduction
Conclusions References
Tables Figures
◭ ◮
◭ ◮
Back Close
Full Screen / Esc
Printer-friendly Version Interactive Discussion
Discussion
P
a
per
|
D
iscussion
P
a
per
|
Discussion
P
a
per
|
Discuss
ion
P
a
per
|
Chen, G.-S., Liu, Z., Clemens, S. C., Prell, W. L., and Liu, X.: Modeling the time-depended response of Asian Summer Monsoon to obliquity forcing in a coupled GCM: a PHASEMAP sensitivity experiment, Clim. Dynam., 36, 695–710, 2011.
Chen, M.-T., Shiau, L.-J., Yu, P.-S., Chiu, T.-C., Chen, Y.-G., and Wei, K.-Y.: 500000-Year records of carbonate, organic carbon, and foraminiferal sea-surface temperature from the
5
southeastern South China Sea (near Palawan Island), Palaeogeogr. Palaeocl., 197, 113– 131, 2003.
Clemens, S. C. and Prell, W. L.: A 350 000 year summer-monsoon multi-proxy stack from the Owen Ridge, Northern Arabian Sea, Mar. Geol., 201, 35–51, 2003.
Clemens, S. C., Prell, W. L., Sun, Y., Liu, Z., and Chen, G.: Southern Hemisphere forcing of
10
Plioceneδ18O and the evolution of Indo-Asian monsoons, Paleoceanography, 23, PA4210,
doi:10.1029/2008PA001638, 2008.
Clement, A., Seager, R., and Cane, M. A.: Orbital controls on the El Niño-Southern Oscillation and the tropical climate., Paleoceanography, 14, 441–456, 1999.
CLIMAP Project Members: Seasonal reconstructions of the Earth’s surface at the last glacial
15
maximum, Map Chart Series, MC36, Geological Society of America, Boulder, CO, 1981. Conte, M. H., Sicre, M.-A., Rühlemann, C., Weber, J. C., Schulte, S., Schulz-Bull, D., and
Blanz, T.: Global temperature calibration of the alkenone unsaturation index (UK37′) in
sur-face waters and comparison with sursur-face sediments, Geochem. Geophy. Geosy., 7, Q02005, doi:10.1029/2005GC001054, 2006.
20
de Garidel-Thoron, T., Rosenthal, Y., Bassinot, F., and Beaufort, L.: Stable sea surface temper-atures in the west Pacific warm pool over the past 5 million years, Nature, 433, 294–298, 2004.
de Garidel-Thoron, T., Rosenthal, Y., Beaufort, L., Bard, E., Sonzogni, C., and Mix, A. C.: A mul-tiproxy assessment of the western equatorial Pacific hydrography during the last 30 kyr,
Pa-25
leoceanography, 22, PA3204, doi:10.1029/2006PA001269, 2007.
EPICA community members: Eight glacial cycles from an Antarctic ice core, Nature, 429, 623– 628, 2004.
Feng, J., Li, J., and Xie, F.: Long-term variation of the principal mode of boreal spring hadley circulation linked to SST over the Indo-Pacific warm pool, J. Climate, 26, 532–544,
30
doi:10.1175/jcli-d-12-00066.1, 2013.