GMDD
7, 5465–5515, 2014ORACLE: an organic aerosol module
A. P. Tsimpidi et al.
Title Page
Abstract Introduction
Conclusions References
Tables Figures
◭ ◮
◭ ◮
Back Close
Full Screen / Esc
Printer-friendly Version Interactive Discussion
Discussion
P
a
per
|
Discus
sion
P
a
per
|
Discussion
P
a
per
|
Discussion
P
a
per
|
Geosci. Model Dev. Discuss., 7, 5465–5515, 2014 www.geosci-model-dev-discuss.net/7/5465/2014/ doi:10.5194/gmdd-7-5465-2014
© Author(s) 2014. CC Attribution 3.0 License.
This discussion paper is/has been under review for the journal Geoscientific Model Development (GMD). Please refer to the corresponding final paper in GMD if available.
ORACLE: a module for the description of
ORganic Aerosol Composition and
Evolution in the atmosphere
A. P. Tsimpidi1, V. A. Karydis1, A. Pozzer1, S. N. Pandis2,3, and J. Lelieveld1,4
1
Max Planck Institute for Chemistry, Mainz, Germany
2
Department of Chemical Engineering, University of Patras, Patras, Greece
3
Department of Chemical Engineering, Carnegie Mellon University, Pittsburgh, PA, USA
4
Energy, Environment and Water Research Center, Cyprus Institute, Nicosia, Cyprus
Received: 13 July 2014 – Accepted: 27 July 2014 – Published: 12 August 2014
Correspondence to: A. P. Tsimpidi ([email protected])
GMDD
7, 5465–5515, 2014ORACLE: an organic aerosol module
A. P. Tsimpidi et al.
Title Page
Abstract Introduction
Conclusions References
Tables Figures
◭ ◮
◭ ◮
Back Close
Full Screen / Esc
Printer-friendly Version Interactive Discussion
Discussion
P
a
per
|
Discus
sion
P
a
per
|
Discussion
P
a
per
|
Discussion
P
a
per
|
Abstract
A computationally efficient module for the description of organic aerosol (OA) parti-tioning and chemical aging has been developed and implemented into the EMAC at-mospheric chemistry-climate model. The model simulates the formation of secondary organic aerosol (SOA) from semi-volatile (SVOCs), intermediate-volatility (IVOCs) and
5
volatile organic compounds (VOCs). The model distinguishes SVOCs from biomass burning and all other combustion sources using two surrogate species for each source category with an effective saturation concentration at 298 K ofC∗=0.1 and 10 µg m−3. Two additional surrogate species withC∗=103and 105µg m−3are used for the IVOCs emitted by the above two source categories. Gas-phase photochemical reactions that
10
change the volatility of the organics are taken into account. The oxidation products (SOA-sv, SOA-iv, and SOA-v) of each group of precursors (SVOCs, IVOCs, and VOCs) are simulated separately in the module to keep track of their origin. ORACLE efficiently describes the OA composition and evolution in the atmosphere and can be used to (i) estimate the relative contributions of SOA and primary organic aerosol (POA) to total
15
OA, (ii) determine how SOA concentrations are affected by biogenic and anthropogenic emissions, and (iii) evaluate the effects of photochemical aging and long-range trans-port on the OA budget. Here we estimate that the predicted domain-average global surface OA concentration is 1.5 µg m−3and consists of 7 % POA from fuel combustion, 11 % POA from biomass burning, 2 % SOA-sv from fuel combustion, 3 % SOA-sv from
20
GMDD
7, 5465–5515, 2014ORACLE: an organic aerosol module
A. P. Tsimpidi et al.
Title Page
Abstract Introduction
Conclusions References
Tables Figures
◭ ◮
◭ ◮
Back Close
Full Screen / Esc
Printer-friendly Version Interactive Discussion
Discussion
P
a
per
|
Discus
sion
P
a
per
|
Discussion
P
a
per
|
Discussion
P
a
per
|
1 Introduction
Atmospheric aerosols adversely affect human health and play an important role in cli-mate change. Depending on the physicochemical properties, aerosols affect the energy budget of the Earth’s atmosphere by scattering and absorbing solar radiation (direct ef-fect) and influencing the reflective properties of clouds, their lifetime, and precipitation
5
formation (indirect effects). Organic aerosol (OA) is an important constituent of atmo-spheric particulates and varies with geographical region, accounting for 20 to 90 % of the submicron particulate mass (Zhang et al., 2007). However, the understanding of OA sources, atmospheric processing and removal is limited. Given that anthropogenic carbonaceous emissions from developing and emerging economies are expected to
10
dramatically increase in the future (IPCC, 2013), a better understanding of the chem-ical evolution of OA is essential to reduce the aerosol related uncertainties in global climate simulations and improve air quality and climate assessments.
OA consists of primary material (POA, directly emitted from sources such as fossil fuel combustion and biomass burning) and secondary particulate matter (SOA, formed
15
within the atmosphere from the oxidation of gas-phase precursors). The relative contri-bution of POA and SOA to the overall OA budget remains controversial. Recent studies show that OA is dominated by SOA not only in tropical regions but also in urban en-vironments (Zhang et al., 2005). The formation of SOA is often underestimated in at-mospheric chemistry-climate models (CCMs) and chemistry-transport models (CTMs)
20
(Heald et al., 2005). Robinson et al. (2007) attributed this “unexplained” SOA to the evaporation of POA, oxidation of the resulting vapors in the gas phase and subse-quent recondensation, SOA formation from intermediate volatility organic compounds (IVOCs) and chemical aging of the first generation products of the volatile organic com-pounds (VOCs), which were not taken into account by models. Laboratory and field
25
GMDD
7, 5465–5515, 2014ORACLE: an organic aerosol module
A. P. Tsimpidi et al.
Title Page
Abstract Introduction
Conclusions References
Tables Figures
◭ ◮
◭ ◮
Back Close
Full Screen / Esc
Printer-friendly Version Interactive Discussion
Discussion
P
a
per
|
Discus
sion
P
a
per
|
Discussion
P
a
per
|
Discussion
P
a
per
|
2008; Jimenez et al., 2009; Grieshop et al., 2009; Hennigan et al., 2011; Miracolo et al., 2011; May et al., 2012).
CCMs have traditionally treated POA and SOA as nonvolatile and nonreactive par-ticles that are emitted directly into the atmosphere (Kanakidou et al., 2005). Most of these models convert “hydrophobic” OA to “hydrophilic” OA using an assumed aging
5
rate constant to account for the chemical conversion of fresh OA to more water soluble compounds and its mixing with other soluble aerosol components without any mecha-nistic detail. In order to describe the OA volatility changes that accompany this chemical conversion, Donahue et al. (2006) developed the volatility basis-set (VBS) framework. This framework describes the OA absorptive partitioning, where OA is assumed to be
10
semi-volatile and photochemically reactive and is distributed in logarithmically spaced volatility bins. With this approach, the intermediate and semi-volatile primary emissions and the SOA formation and its chemical aging can be simulated in a common frame-work that is well suited for regional and global modeling (Murphy and Pandis, 2009; Tsimpidi et al., 2010; Jathar et al., 2011).
15
Several recent regional scale modeling studies have accounted for the semi-volatile nature and chemical aging of organic compounds demonstrating improvements in re-producing the organic aerosol budget and its chemical resolution (Murphy and Pan-dis, 2009; Tsimpidi et al., 2010; Hodzic et al., 2010; Tsimpidi et al., 2011; Fountoukis et al., 2011; Shrivastava et al., 2011; Bergstrom et al., 2012; Athanasopoulou et al.,
20
2013; Zhang et al., 2013; Fountoukis et al., 2014). However, such efforts on a global scale are limited. Farina et al. (2010) implemented the VBS in the Goddard Institute for Space Studies General Circulation Model II’ (GISS II’) to describe the formation of SOA from VOCs, while assuming that POA emissions were nonvolatile and non-reactive and not accounting for IVOC emissions. Pye and Seinfeld (2010) estimated
25
GMDD
7, 5465–5515, 2014ORACLE: an organic aerosol module
A. P. Tsimpidi et al.
Title Page
Abstract Introduction
Conclusions References
Tables Figures
◭ ◮
◭ ◮
Back Close
Full Screen / Esc
Printer-friendly Version Interactive Discussion
Discussion
P
a
per
|
Discus
sion
P
a
per
|
Discussion
P
a
per
|
Discussion
P
a
per
|
total surface-level OA concentrations due to the partial evaporation of POA upon emis-sion. Jathar et al. (2011) modified the model of Farina et al. (2010) to account explic-itly for the semivolatile and reactive POA and predicted a global dominance of SOA, which brought the POA/SOA fractions into better agreement with measurements. Jo et al. (2013) employed the VBS framework in the GEOS-Chem global CTM to study
5
the effect of photochemical aging on global SOA. They found that the model results were in better agreement with all observations relative to the simulations without aging and to those of the traditional two product approach. All of the above studies showed improved representation of POA and/or SOA in the corresponding global CTMs and that the changes brought the model predictions closer to field measurements.
How-10
ever, the number of studies that have employed the recent OA findings is rather limited and in most cases lack one or more potentially important processes (i.e., the aging reactions, the semivolatile character of POA, etc.).
This study aims to improve the description of organic aerosols in large-scale models, making use of the VBS approach and recent developments based on laboratory and
15
field measurements. A new computationally efficient module for the description of or-ganic aerosol composition and evolution in the atmosphere (ORACLE) has been devel-oped and implemented in the ECHAM/MESSy Atmospheric Chemistry (EMAC) model (Jöckel et al., 2006) to simulate POA and SOA formation and growth. ORACLE uses a novel lumping method that allows the use of a small number of species, minimizing
20
the computational cost. At the same time it provides valuable information about the OA sources and physicochemical evolution during its atmospheric lifetime. The ORACLE user has full control of the complexity of the OA scheme and is able to adjust the num-ber of species and reactions, depending on the application and the desired chemical resolution (number of compounds and volatility bins), as well as the physicochemical
25
GMDD
7, 5465–5515, 2014ORACLE: an organic aerosol module
A. P. Tsimpidi et al.
Title Page
Abstract Introduction
Conclusions References
Tables Figures
◭ ◮
◭ ◮
Back Close
Full Screen / Esc
Printer-friendly Version Interactive Discussion
Discussion
P
a
per
|
Discus
sion
P
a
per
|
Discussion
P
a
per
|
Discussion
P
a
per
|
identifying the major uncertainties that should be addressed in future experimental and modeling studies.
2 Global model description
2.1 EMAC model
The ECHAM5/MESSy Atmospheric Chemistry model (EMAC) (Jöckel et al., 2006,
5
2010) is used as the host model for ORACLE. This is a numerical chemistry and climate simulation system that includes sub-models describing lower and middle at-mospheric processes and their interaction with oceans, land and human influences. EMAC combines the Modular Earth Submodel System (MESSy; Jöckel et al., 2005) and the 5th generation of the European Centre Hamburg general circulation model
10
(ECHAM5; Röckner et al., 2006). ECHAM5 simulates the atmospheric flow with the prognostic variables vorticity, divergence, temperature, total moisture and the logarithm of the surface pressure, and is integrated in the base model layer of MESSy. The inter-face structure of MESSy allows the use of different modules for atmospheric chemistry, transport, and diagnostic tools. EMAC has been extensively described and evaluated
15
against ground-based and satellite observations, and can be run on a range of spatial resolutions (Jöckel et al., 2006; Pozzer et al., 2012; de Meij et al., 2012). In this study, the applied spectral resolution of the EMAC model is T42L31, corresponding to a hor-izontal grid resolution of approximately 2.8◦×2.8◦ and 31 vertical layers extending to 25 km. EMAC is applied for 6 years covering the period 2004–2009 and the first year is
20
used as spin-up.
The EMAC model simulates gas-phase species online through the Module Efficiently Calculating the Chemistry of the Atmosphere submodel (MECCA; Sander et al., 2011). MECCA calculates online the concentration of the major oxidants (OH, H2O2, NO2, and O3) by using a chemical scheme based on the MIM mechanism (Pöschl et al., 2000)
25
GMDD
7, 5465–5515, 2014ORACLE: an organic aerosol module
A. P. Tsimpidi et al.
Title Page
Abstract Introduction
Conclusions References
Tables Figures
◭ ◮
◭ ◮
Back Close
Full Screen / Esc
Printer-friendly Version Interactive Discussion
Discussion
P
a
per
|
Discus
sion
P
a
per
|
Discussion
P
a
per
|
Discussion
P
a
per
|
reactions of 129 gases in total. Inorganic aerosol microphysics and gas/particle parti-tioning are calculated by the Global Modal-aerosol eXtension aerosol module (GMXe; Pringle et al., 2010). This submodel is computationally efficient and is suitable for medium to long-term simulations with global and regional models.
The aerosol microphysics are described using 7 interacting lognormal modes (4
hy-5
drophilic and 3 hydrophobic modes). The 4 hydrophilic modes cover the full aerosol size spectrum (nucleation, Aitken, accumulation, and coarse modes). Each size range has fixed size boundaries and a variable mean radius. The 3 hydrophobic modes have the same size range apart from the nucleation mode. The aerosol composition within each mode is uniform with size (internally mixed), though the composition can vary
be-10
tween modes (externally mixed). The removal of gas and aerosol species through dry deposition is calculated within the DRYDEP submodel (Kerkweg et al., 2006) based on the big leaf approach. The sedimentation of aerosols is calculated within the SEDI submodel (Kerkweg et al., 2006) using a first order approach. Cloud scavenging of gas and aerosol species is simulated using the SCAV submodel (Tost et al., 2006). The
15
optical properties of aerosols (optical thickness, single scattering albedo, asymmetry factor) are calculated within the AEROPT submodel (Lauer et al., 2007) based on pre-calculated look-up tables from Mie theory. The CLOUD submodel (Jöckel et al., 2006) is used to calculate the cloud cover as well as cloud micro-physics including precipita-tion. The detailed two-moment liquid and ice-cloud microphysical scheme of Lohmann
20
et al. (2007), which enables a physically based treatment of aerosol-cloud interactions, is used to compute cloud microphysical processes.
3 ORACLE module description
3.1 Module overview
The ORACLE module (i) uses logarithmically-spaced saturation concentration bins to
25
GMDD
7, 5465–5515, 2014ORACLE: an organic aerosol module
A. P. Tsimpidi et al.
Title Page
Abstract Introduction
Conclusions References
Tables Figures
◭ ◮
◭ ◮
Back Close
Full Screen / Esc
Printer-friendly Version Interactive Discussion
Discussion
P
a
per
|
Discus
sion
P
a
per
|
Discussion
P
a
per
|
Discussion
P
a
per
|
of SVOCs and IVOCs from fuel combustion and biomass burning emissions and an-thropogenic and biogenic VOCs to the formation of SOA (iii) monitors the gas-phase photochemical reactions of SOA precursors, (iv) assumes bulk equilibrium between the gas and particulate phases and (v) distributes the OA in size modes. A schematic overview of the ORACLE module and how it is implemented in EMAC is provided in
5
Fig. 1.
3.2 OA terminology
The ORACLE module describes the chemical life of a high number of different species involved in the formation of total atmospheric OA in order to cover and track the distri-bution of these species in multiple simultaneously occurring phases, their participation
10
in a large number of possible formation pathways (i.e. multigenerational oxidation), their volatility distribution and the origin of their sources. The complexity of this de-scription demands a systematic classification of the organic compounds that will be in line with ongoing field and laboratory studies and model development. Following the Murphy et al. (2014) naming convention for classifying OA components, the ORACLE
15
classification system has the following syntax:
[Source root name]−[initial volatility]
with the “source root name” indicated by an acronym currently used in the field and the “initial volatility” of the species upon emission indicated by an alphabetical low-ercase suffix. Table 1 contains a full description of the root terms and suffixes used
20
for identifying the emitted volatility of the organic components described by ORACLE module in this application. The source root name of organic components consist of lowercase alphabetical characters (Modifiers) that describe their source type (i.e. “f” for fuel combustion), followed by three capital letters (Base Term): the first letter de-clares if the organic component is primary (“P”), coming from primary emissions, or
25
GMDD
7, 5465–5515, 2014ORACLE: an organic aerosol module
A. P. Tsimpidi et al.
Title Page
Abstract Introduction
Conclusions References
Tables Figures
◭ ◮
◭ ◮
Back Close
Full Screen / Esc
Printer-friendly Version Interactive Discussion
Discussion
P
a
per
|
Discus
sion
P
a
per
|
Discussion
P
a
per
|
Discussion
P
a
per
|
aerosol and “G” for gas). The exact names of all the organic compounds simulated by ORACLE are listed in Table 2.
3.3 Volatility basis set theory
The ORACLE module adopts the volatility basis set approach proposed by Donahue et al. (2006). It subdivides the thousands of organic compounds into groups
(sur-5
rogate species) with logarithmically spaced effective saturation concentrations. This framework abandons the traditional distinction between POA and SOA and allows the EMAC model to efficiently treat both semivolatile primary emissions and SOA produc-tion, and then simulate the chemical evolution of these species under a unified frame-work. The exact volatility resolution defined and used by ORACLE can be controlled
10
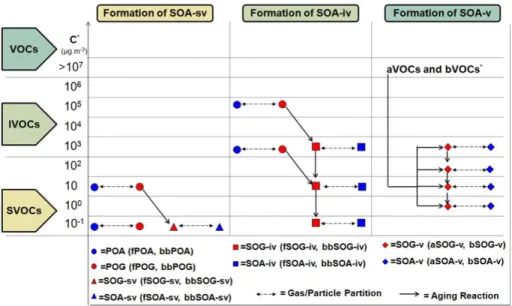
through the interface layer of the module, offering the flexibility to investigate different schemes. For the current application, eight surrogate species are used for POA di-vided into two groups with saturation concentrationsC∗ at 298 K equal to 10−1, 101, 103, 105µg m−3: (i) POA from biofuel combustion, fossil fuel combustion, and other ur-ban sources (fPOA) and (ii) POA from biomass burning (bbPOA). The least volatile
15
fraction, at 10−1µg m−3, describes the low volatility organics in the atmosphere that are mostly in the particulate phase even in remote locations. On the other hand, even under highly polluted conditions the majority of the material in the 105µg m−3 volatility bin will exist exclusively in the vapor phase. The user has full control of the complexity of the ORACLE module and therefore can easily add bins at either end of the range
20
to describe and investigate unique conditions. A similar approach is followed for SOA that is formed from the VOC emissions. Following the approach of Lane et al. (2008) it is assumed that the oxidation of the anthropogenic and biogenic VOC species (aVOC and bVOC, respectively) results in four products for each precursor distributed in four volatility bins with effective saturation concentrations at 298 K equal to 1, 10, 102 and
25
GMDD
7, 5465–5515, 2014ORACLE: an organic aerosol module
A. P. Tsimpidi et al.
Title Page
Abstract Introduction
Conclusions References
Tables Figures
◭ ◮
◭ ◮
Back Close
Full Screen / Esc
Printer-friendly Version Interactive Discussion
Discussion
P
a
per
|
Discus
sion
P
a
per
|
Discussion
P
a
per
|
Discussion
P
a
per
|
ORACLE interface. The different aerosol types and chemical processes modeled in the proposed framework are illustrated in Fig. 2.
3.4 Emission inventory of OA precursors
VOC emissions: the emissions of isoprene and monoterpenes are calculated online by EMAC with the ONLEM submodel and depend on ecosystem type, temperature,
5
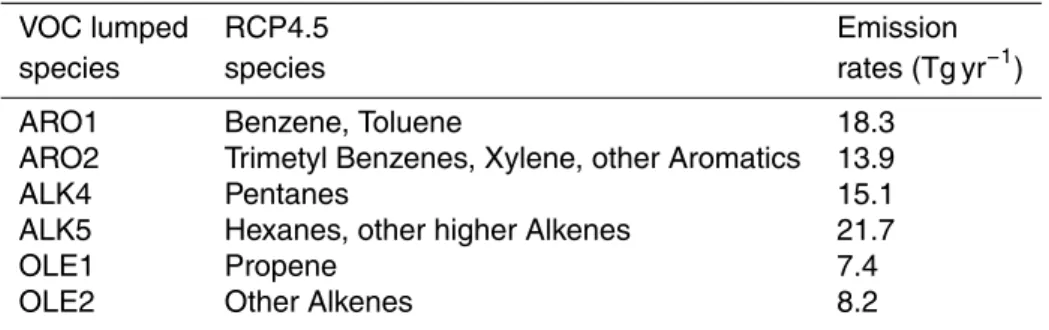
and solar radiation. The AIRSEA submodel estimates the oceanic isoprene emissions from chlorophyll concentrations (Pozzer et al., 2006). In this application, isoprene and monoterpene global emissions are 477 and 62.4 Tg yr−1, respectively. The emissions of the aVOCs that are considered SOA precursors are derived from the IPCC RCP4.5 emission inventory (Clarke et al., 2007). These compounds were not considered by the
10
original gas phase chemistry submodel MECCA. Therefore, six lumped aVOC species have been added to MECCA to assess the aSOA formation in ORACLE. These lumped species are grouped similarly to the Statewide Air Pollution Research Center SAPRC99 chemical mechanism (Carter, 2000) into: two alkane species, two olefins, and two aro-matics. The aVOCs that are considered SOA precursors and their annual global
emis-15
sions are listed in Table 3.
IVOC and SVOC emissions:the EMAC model considers the contribution of fuel com-bustion and biomass burning to POA emissions. The AEROCOM database is used for the aerosol emissions from fossil and biofuel combustion based on the year 2000 (Dentener et al., 2006). The biomass burning contribution is based on the Global Fire
20
Emissions Database (GFED version 3.1) which is monthly resolved and covers the period 1997–2009 (van der Werf et al., 2010). These emission datasets treat POA as non-reactive and non-volatile. However, the POA concentration upon emission is highly sensitive to ambient conditions, including dilution and temperature (Hildemann et al., 1989; Lipsky and Robinson, 2006). ORACLE accounts for the volatility of POA
emis-25
GMDD
7, 5465–5515, 2014ORACLE: an organic aerosol module
A. P. Tsimpidi et al.
Title Page
Abstract Introduction
Conclusions References
Tables Figures
◭ ◮
◭ ◮
Back Close
Full Screen / Esc
Printer-friendly Version Interactive Discussion
Discussion
P
a
per
|
Discus
sion
P
a
per
|
Discussion
P
a
per
|
Discussion
P
a
per
|
in both the gas and particulate phases under typical ambient conditions. IVOCs have saturation concentrations between 103and 106µg m−3and exist in the gas phase.
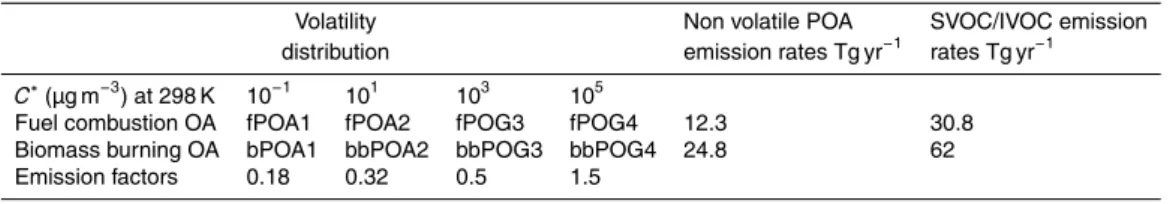
For the current application, the model distinguishes SVOCs from biomass burning and other combustion sources (biofuel and fossil fuel combustion, and other urban sources) using two surrogate species for each emission category with effective
satura-5
tion concentration at 298 K ofC∗=0.1 and 10 µg m−3. For IVOCs two additional surro-gate species withC∗=103and 105µg m−3 are used for each of the above two source categories. The emission factors used for the distribution of traditional POA emissions into SVOCs and IVOCs are based on the work of Tsimpidi et al. (2010). These emis-sion factors also account for the additional IVOC emisemis-sions that were not included
10
in the original emission inventory used by EMAC. Traditional emission inventories ac-count only for a small fraction of the IVOCs since they are based on samples using quartz and/or Teflon filters collected at aerosol concentrations up to 104µg−3 (Shrivas-tava et al., 2008; Robinson et al., 2010). The amount of IVOC emissions missing from traditional inventories is estimated to be between 0.25 and 2.8 times the traditional
15
POA emissions (Schauer et al., 1999, 2001, 2002). In this study, we assume that the missing IVOC emissions are 1.5 times the traditional emission inventory (Shrivastava et al., 2008; Tsimpidi et al., 2010) and are assigned to the fourth volatility bin with
C∗=105µg m−3. Table 4 lists the emission factors for each SVOC and IVOC and their total annual global emissions from fuel combustion and biomass burning.
20
3.5 Photochemical reactions
Photo-oxidation of VOCs: the photochemical oxidation of VOCs that are considered as SOA precursors has been implemented into MECCA. The updated mechanism consid-ers the oxidation of alkenes, aromatics and isoprene by OH, and the oxidation of olefins and monoterpene by O3, O, OH, and NO3. The oxidation products from anthropogenic
25
GMDD
7, 5465–5515, 2014ORACLE: an organic aerosol module
A. P. Tsimpidi et al.
Title Page
Abstract Introduction
Conclusions References
Tables Figures
◭ ◮
◭ ◮
Back Close
Full Screen / Esc
Printer-friendly Version Interactive Discussion
Discussion
P
a
per
|
Discus
sion
P
a
per
|
Discussion
P
a
per
|
Discussion
P
a
per
|
biogenic VOCs (bSOA-v). These groups are further distributed into volatility bins with logarithmically spaced effective saturation concentrations (Fig. 2). The photo-oxidation of aVOCs and bVOCs is described by the following reactions:
aVOC+Oxidants→
n
X
i=1
aiaSOG-vi (R1)
aSOG-vi↔aSOA-vi (R2)
5
bVOC+Oxidants→
n
X
i=1
aibSOG-vi (R3)
bSOG-vi↔bSOA-vi (R4)
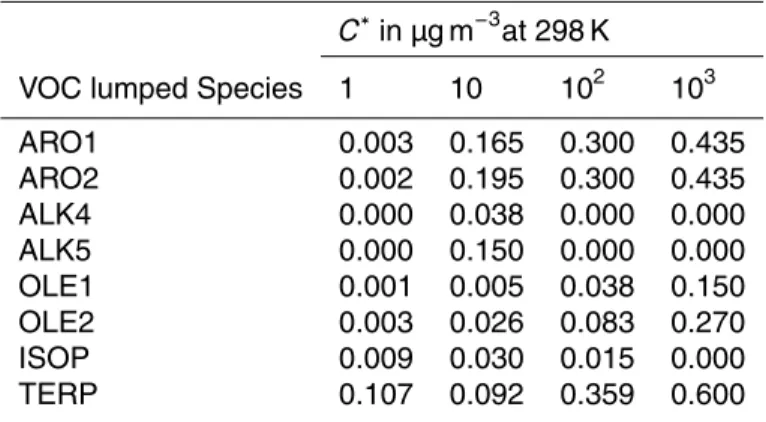
where ai is the aerosol yield, i is the corresponding volatility bin, and n is the total number of volatility bins. In this application, four volatility bins are considered and the corresponding aerosol yields are those used by Tsimpidi et al. (2010) based on
labo-10
ratory results from smog-chamber experiments under high-NOx conditions for aVOCs
and low-NOxconditions for bVOCs (Table 5). This is based on the assumption that
ur-ban areas are characterized by high-NOx conditions (Tsimpidi et al., 2008; Karl et al., 2009) and forested regions by low-NOx conditions (Pugh et al., 2010; Browne et al.,
2013).
15
Chemical Aging Reactions: ORACLE treats all OA compounds as chemically reac-tive. However, only homogeneous gas-phase aging is considered since it occurs rapidly compared to heterogeneous reactions with OH (Donahue et al., 2013). The volatilities of aSOA-v reacting with OH, are reduced by a factor of 10 (Fig. 2) with a rate constant of 1×10⁻¹¹cm3molecule−1s−1 (Tsimpidi et al., 2010) and a 7.5 % increase in mass
20
to account for the added oxygen. aSOA-v can participate in up to three generations of oxidation reaching a final organic matter to organic carbon ratio (OM/OC) of up to 2.2 (assuming an initial OM/OC of 1.8), which is within the limits (OM/OC: 1.8–2.4) of the observed OM/OC of the oxygenated organic aerosols (Aiken et al., 2008). It is assumed that the chemical aging of bSOA-v does not result in any increase of the SOA
GMDD
7, 5465–5515, 2014ORACLE: an organic aerosol module
A. P. Tsimpidi et al.
Title Page
Abstract Introduction
Conclusions References
Tables Figures
◭ ◮
◭ ◮
Back Close
Full Screen / Esc
Printer-friendly Version Interactive Discussion
Discussion
P
a
per
|
Discus
sion
P
a
per
|
Discussion
P
a
per
|
Discussion
P
a
per
|
concentrations due to a balance between functionalization and fragmentation reactions (Ng et al., 2006; Fountoukis et al., 2011). The chemical aging of aSOA-v is described by the following reaction:
aSOG-vi+OH→1.075aSOG-vi−1 (R5)
aSOG-vi−1↔aSOA-vi−1 (R6)
5
The volatilities of SVOCs and IVOCs are reduced by a factor of 100 (Fig. 2) as a result of the OH reaction with a rate constant of 2×10⁻¹¹cm3molecule−1s−1 (Pye and Seinfeld, 2010) and a 15 % increase in mass to account for the added oxygen. This represents a more aggressive addition of oxygen and reduction in volatility com-pared to aSOA-v. In the present application, SVOCs and IVOCs can participate in up to
10
three generations of oxidation reaching a final OM/OC of up to 1.8 (assuming an initial OM/OC of 1.2), which is consistent with the observed OM/OC (OM/OC: 1.8–2.4) of the oxygenated organic aerosols (Aiken et al., 2008). The oxidation products of SVOCs and IVOCs are called SOA from the oxidation of fuel combustion and biomass burning SVOCs (fSOA-sv and bbSOA-sv, respectively) and SOA from the oxidation of fuel and
15
biomass burning IVOCs (fSOA-iv and bbSOA-iv, respectively). The photo-oxidation of SVOCs and IVOCs is described by the following reactions:
fSVOCi+OH→1.15fSOG-svi−1 (R7)
fSOG-svi ↔fSOA-svi (R8)
fIVOCi+OH→1.15fSOG-ivi−1 (R9)
20
fSOG-ivi ↔fSOA-ivi (R10)
bbSVOCi+OH→1.15bbSOG-svi−1 (R11)
bbSOG-svi ↔bbSOA-svi (R12)
bbIVOCi+OH→1.15bbSOG-ivi−1 (R13)
bbSOG-ivi ↔bbSOA-ivi (R14)
GMDD
7, 5465–5515, 2014ORACLE: an organic aerosol module
A. P. Tsimpidi et al.
Title Page
Abstract Introduction
Conclusions References
Tables Figures
◭ ◮
◭ ◮
Back Close
Full Screen / Esc
Printer-friendly Version Interactive Discussion
Discussion
P
a
per
|
Discus
sion
P
a
per
|
Discussion
P
a
per
|
Discussion
P
a
per
|
wherei is the corresponding volatility bin. The products of reactions (R7)–(R14) are al-lowed to be further oxidized by OH forming species with lower saturation concentration (i.e. the oxidation of fSOA-svi will produce the fSOA-svi−1).
3.6 Gas/aerosol partitioning
ORACLE calculates the partitioning of organic compounds between the gas and
parti-5
cle phases by assuming bulk equilibrium between the two phases and that all organic compounds form a pseudo-ideal solution. The gas/aerosol partitioning is performed in two steps as follows:
Bulk equillibrium: ORACLE calculates the bulk equilibrium gas and aerosol concen-trations following the approach of the SOAM II model of Strader et al. (1999).
Consid-10
ering partitioning ofnorganic compounds and assuming pseudo-ideal solution, a set ofnnonlinear equations is obtained:
ca,i =ct,i−xic∗i fori =1,n
xi =Pnca,i/Mi
j=1ca,j/Mj
,
15
where ct,i and ca,i are the total and aerosol-phase concentrations of product i in
µg m−3, respectively,c∗i is the effective saturation concentration of producti,xi is the mole fraction of product i in the absorbing organic phase, and Mi is the molecular weight of producti. The temperature dependence of saturation concentrations is de-scribed by the Clausius–Clapeyron equation:
20
c∗i =c∗i,0T0 T exp
∆H R
1
T0
−1
T
,
wherec∗i and c∗i,0 are the saturation concentrations at temperature T and T0,
GMDD
7, 5465–5515, 2014ORACLE: an organic aerosol module
A. P. Tsimpidi et al.
Title Page
Abstract Introduction
Conclusions References
Tables Figures
◭ ◮
◭ ◮
Back Close
Full Screen / Esc
Printer-friendly Version Interactive Discussion
Discussion
P
a
per
|
Discus
sion
P
a
per
|
Discussion
P
a
per
|
Discussion
P
a
per
|
a∆H of 30 kJ mol−1is used for all aSOA-v and bSOA-v species and a∆H of 106, 94, 82, and 70 kJ mol−1 is used for the 10−1, 101, 103, 105µg m−3 volatility bins, respec-tively, for all organic compounds from fossil fuel and biomass burning sources (Tsimpidi et al., 2010). ORACLE solves this equation set, which yields the bulk aerosol compo-sition at equilibrium.
5
Aerosol size distribution: the aerosol size distribution is determined by distributing the change in aerosol mass after the bulk equilibrium into each size mode using a weight-ing factor (Pandis et al., 1993). Assumweight-ing pseudo-ideal solution, the fraction, fi,k, of
total flux of speciesi between gas and aerosol phases that condenses onto or evapo-rates from an aerosol modek is given by:
10
fi,k= Nkdk ci−xi,kc ∗
i
/(βk+1)
m
P
l=1
Nldl ci−xi,lc∗i
/(βl+1) ,
whereNk and dk are the number and mean diameter of particles in the mode k, re-spectively, m is the total number of aerosol modes, βk=2λ/αdk, α is the aerosol accommodation coefficient, andλis the mean free path of air molecules (Pandis et al.,
15
1993). The above equation is solved iteratively at each time step and determines the OA composition of each mode.
4 Model results
4.1 Total OA concentrations
The model calculated global average surface OA concentration is 1.5 µg m−3 (Fig. 3).
20
GMDD
7, 5465–5515, 2014ORACLE: an organic aerosol module
A. P. Tsimpidi et al.
Title Page
Abstract Introduction
Conclusions References
Tables Figures
◭ ◮
◭ ◮
Back Close
Full Screen / Esc
Printer-friendly Version Interactive Discussion
Discussion
P
a
per
|
Discus
sion
P
a
per
|
Discussion
P
a
per
|
Discussion
P
a
per
|
and Eastern US), where strong fossil and biofuel combustion related sources are lo-cated. The model predicts a continental background OA concentration of 1–2 µg m−3, which is mainly formed by the condensation of oxidized low volatility organic gases. These gases are formed from the photochemical aging of VOCs, IVOCs and SVOCs, which have been emitted in the gas phase and have been efficiently transported remote
5
from their sources. The effects of trade wind transport of bbOA offthe subtropical west coasts of Africa and America are discernible in Fig. 3. In these regions, the OA con-centration is increased by long-range transport of continental air masses to adjacent ocean areas.
4.2 Model performance evaluation
10
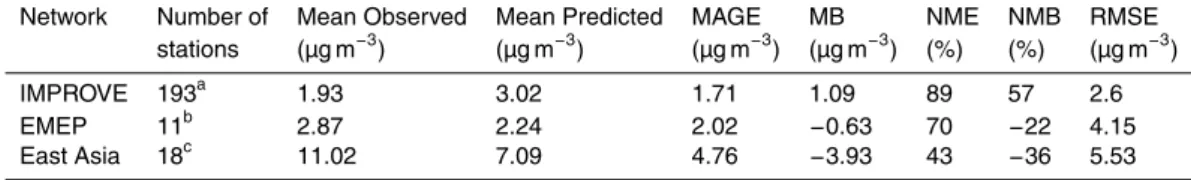
Figure 4 shows the comparison of model predictions of OA concentration against mea-surements from the European Monitoring and Evaluation Programme (EMEP; http: //nilu.no/projects/ccc/onlinedata/pm/) and the Interagency Monitoring of protected Vi-sual Environments (IMPROVE; http://vista.cira.colostate.edu/improve/Data/IMPROVE/ improve_data.htm), as well as against short-term measurement data collected over
15
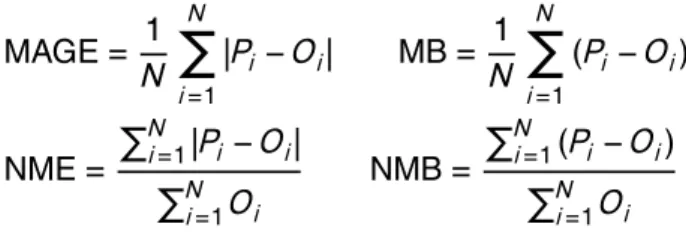
East Asia as summarized by Jo et al. (2013). Each point of the scatter plots repre-sents a monthly averaged value at a particular monitoring station. The mean bias (MB), mean absolute gross error (MAGE), normalized mean bias (NMB), normalized mean error (NME), and the root mean square error (RMSE) were also calculated (Table 6) to assess the model performance:
20
MAGE= 1
N
N
X
i=1
|Pi−Oi| MB=
1
N
N
X
i=1
(Pi−Oi)
NME=
PN
i=1|Pi−Oi|
PN
i=1Oi
NMB=
PN
i=1(Pi−Oi)
PN
GMDD
7, 5465–5515, 2014ORACLE: an organic aerosol module
A. P. Tsimpidi et al.
Title Page
Abstract Introduction
Conclusions References
Tables Figures
◭ ◮
◭ ◮
Back Close
Full Screen / Esc
Printer-friendly Version Interactive Discussion
Discussion
P
a
per
|
Discus
sion
P
a
per
|
Discussion
P
a
per
|
Discussion
P
a
per
|
RMSE=
"
1
N
N
X
i=1
(Pi−Oi)2
#12 ,
wherePi is the predicted value of the OA mass,Oi is the observed value of OA at the
same monthly averaged time, and N is the total number of data points used for the comparison. NME (in %) and MAGE (in µg m−3) provide an assessment of the overall
5
discrepancy between model predictions and observations, while NMB (in %) and MB (in µg m−3) are indicative of systematic errors. RMSE (in µg m−3) incorporates both the variance of the prediction and its bias. Both NME and MAGE inherently include the corresponding bias, which is the reason why their magnitude is equal or larger than NMB and MB respectively. For an unbiased prediction, NME and MAGE express the
10
variance. When NME and NMB or MAGE and MB, respectively, are close to each other in magnitude, the discrepancy is explained as a systematic bias rather than scatter. When the magnitude of NME/MAGE is larger than NMB/MB, part of the discrepancy between predictions and observations is explained as scatter.
The model, despite its coarse resolution, captures relative well the monthly average
15
concentrations of OA over the USA, Europe, and Asia (Table 6). This is rather encour-aging given the expected uncertainties in the emission inventory and in a number of parameters used by the model such as the emission fractions for POA from fuel com-bustion and biomass burning, the reaction rates and aerosol yields that accompany the formation of SOA from SVOCs, IVOCs, and VOCs, etc. In addition, the fact that the
for-20
mation of SOA from aqueous-phase reactions and heterogeneous reactions including processes, like oligomerization, have not been accounted for, adds to uncertainty. How-ever, despite the above weaknesses, the model predictions for total OA concentration are generally in reasonable agreement with the measurements. More precisely, over the USA, the model overpredicts the OA with a NMB of 57 %. The high NME (89 %)
in-25
GMDD
7, 5465–5515, 2014ORACLE: an organic aerosol module
A. P. Tsimpidi et al.
Title Page
Abstract Introduction
Conclusions References
Tables Figures
◭ ◮
◭ ◮
Back Close
Full Screen / Esc
Printer-friendly Version Interactive Discussion
Discussion
P
a
per
|
Discus
sion
P
a
per
|
Discussion
P
a
per
|
Discussion
P
a
per
|
station Ispra, located in a topographically pronounced part of Italy. The measurements of OA in Ispra are systematically high (up to 22 µg m−3) and are not captured by the model due to its low spatial resolution (Fig. 4b). Due to the small number of available measurement sites from the EMEP network, this discrepancy over Ispra significantly affects the statistics of the model evaluation over Europe. Similarly, over East Asia, the
5
model underpredicts OA concentrations with an NMB of−36 % since it cannot capture the high values measured over Beijing and Shijiazhuang (up to 32 µg m−3) due to its limited spatial resolution.
In contrast to highly populated areas, long-term observations of OA over forests are unavailable, therefore we have collected OA data measured during the short-term field
10
campaigns of DABEX, DODO, and AMMA over the subtropical West Africa (Capes et al., 2008, 2009), AMAZE-08 and SAMBBA over the Amazonian rainforest (Chen et al., 2009; Brito et al., 2014), and measurement data collected over the Canadian boreal forest (Schwartz et al., 2010; Takahama et al., 2011). Capes et al. (2008) per-formed aircraft measurements during the DABEX and DODO field experiments
(Jan-15
uary and February of 2006) over the subtropical West Africa at altitudes up to 4000 m. This period was characterized by intense agricultural fires in the sub-Sahelian part of West Africa resulting in high OA concentrations (4–16 µg m−3). EMAC agrees reason-ably well with the observations since the predicted OA concentrations during January and February of 2006 range between 2 and 12.5 µg m−3, mainly due to high biomass
20
burning emissions over the area. During the wet season of the same year (July and August 2006), Capes et al. (2009) carried out aircraft measurements over the subtrop-ical West Africa in the frame of the AMMA project. This period is characterized by low biomass burning emissions, therefore, OA consists according to EMAC mainly of bio-genic SOA. The observed median concentration is 1.1 µg m−3while EMAC predicts an
25
GMDD
7, 5465–5515, 2014ORACLE: an organic aerosol module
A. P. Tsimpidi et al.
Title Page
Abstract Introduction
Conclusions References
Tables Figures
◭ ◮
◭ ◮
Back Close
Full Screen / Esc
Printer-friendly Version Interactive Discussion
Discussion
P
a
per
|
Discus
sion
P
a
per
|
Discussion
P
a
per
|
Discussion
P
a
per
|
season (September 2012), Brito et al. (2014) reported an average OA concentration of 13.7 µg m−3in the Southwestern Amazon basin during the SAMBBA field experiment. Since this value is mostly affected by biomass burning emissions (which vary signifi-cantly interannually) and EMAC model applied emissions during the years 2005–2009, a direct comparison between observations and measurements is not possible.
How-5
ever, EMAC captures the increased concentrations during the dry seasons since OA is predicted to vary between 9.8 µg m−3and 30 µg m−3 over the same area during the months of September. Finally, Schwartz et al. (2010) and Takahama et al. (2011) per-formed measurements of OA over the boreal forest of British Columbia, Canada during May–June 2008 and March–September 2009, respectively. The reported values were
10
1.3 µg m−3 (May–June 2008), 0.6 µg m−3 (March–April 2009), and 4.1 µg m−3 (May– September 2009). The predicted OA concentrations by EMAC fit well with this range of observations with values of 1.4 µg m−3, 0.9 µg m−3, and 4.5 µg m−3, respectively.
4.3 Primary Organic Aerosol
POA is the fraction of the organic emissions that is emitted and contained in the aerosol
15
phase and has not undergone chemical reactions. POA in the present application is di-vided into fPOA and bbPOA depending on its source as described in Sect. 3.3. fPOA and bbPOA have high concentrations close to their sources; further downwind the con-centrations rapidly decrease due to dilution and evaporation (Fig. 5).
fPOA: the global average surface concentration of fPOA is 0.11 µg m−3 (Fig. 5a).
20
Fossil fuels and biofuels are used in the industrial, residential, and transport sectors, therefore the fPOA concentration peaks over densely populated and highly industrial-ized areas. In fact, the highest fPOA concentration is predicted over Eastern China (up to 8 µg m−3 over Beijing), India and Bangladesh (1–4 µg m−3). In Europe the highest concentration is predicted over Eastern European countries (1–2 µg m−3 over Poland
25
GMDD
7, 5465–5515, 2014ORACLE: an organic aerosol module
A. P. Tsimpidi et al.
Title Page
Abstract Introduction
Conclusions References
Tables Figures
◭ ◮
◭ ◮
Back Close
Full Screen / Esc
Printer-friendly Version Interactive Discussion
Discussion
P
a
per
|
Discus
sion
P
a
per
|
Discussion
P
a
per
|
Discussion
P
a
per
|
Addis Ababa, Kampala, and Johannesburg (0.5–1.5 µg m−3). Over North America, the highest fPOA levels are predicted over Los Angeles (0.5–1 µg m−3), northeastern USA (0.5–1.5 µg m−3), and Mexico City (0.5–1 µg m−3), while over South America, fPOA is high over Rio de Janeiro (0.5–1 µg m−3).
bbPOA: the global average surface concentration of bbPOA is 0.12 µg m−3(Fig. 5b).
5
The bbPOA levels are affected by emissions from forest, woodland, peatland, and sa-vannah fires as well as agricultural waste burning. Therefore, high concentrations are predicted over the tropical rainforest and savannas in the Amazon and Congo basins (5–10 µg m−3), Southeast Asia (3–6 µg m−3), and the boreal forests of Alaska, Canada, and Russia.
10
4.4 Secondary Organic Aerosol from SVOCs
SVOCs are emitted in both the aerosol and gas phases and can be transferred from phase to phase due to cooling and dilution as the air masses travel from their sources. SVOCs in the gas phase can be oxidized and possibly re-condense to the aerosol phase forming secondary organic aerosols (SOA-sv). In ORACLE, SOA-sv is
subdi-15
vided into fSOA-sv and bbSOA-sv depending on its source as described in Sect. 3.5. fSOA-sv and bbSOA-sv concentrations are high according to our simulation downwind of polluted urban areas and megacities and the major rainforests (Fig. 6). However, as most of the SVOCs are in the aerosol phase after emissions (as POA) and remain there without undergoing chemical reactions during their atmospheric lifetime, fSOA-sv and
20
bbSOA-sv concentrations are significantly lower compared to the corresponding fPOA and bbPOA concentrations (Figs. 5 and 6).
fSOA-sv: the global average surface concentration of fSOA-sv is 0.03 µg m−3 (Fig. 6a). fSOA-sv disperses over the continents but remains at low levels in most cases (lower than 0.2 µg m−3). The highest concentrations of fSOA-sv are predicted
25
GMDD
7, 5465–5515, 2014ORACLE: an organic aerosol module
A. P. Tsimpidi et al.
Title Page
Abstract Introduction
Conclusions References
Tables Figures
◭ ◮
◭ ◮
Back Close
Full Screen / Esc
Printer-friendly Version Interactive Discussion
Discussion
P
a
per
|
Discus
sion
P
a
per
|
Discussion
P
a
per
|
Discussion
P
a
per
|
bbSOA-sv: the domain average surface concentration of bbSOA-sv is 0.05 µg m−3 (Fig. 6b). bbSOA-sv has higher concentrations in the Southern Hemisphere where the main rainforests of the world are located (Amazon, Congo, SE Asia) and the meteo-rological conditions favor the partition of SVOC emissions into the gas phase where they are subject to oxidation. The highest bbSOA-sv concentrations (up to 1 µg m−3)
5
are predicted over the west coast of Central Africa, affected by the biomass burning emissions from the Congo Basin. These emissions are the source of the relatively high bbSOA-sv concentrations (0.3–0.7 µg m−3) that are predicted over the Southern Atlantic Ocean. The predicted concentration of bbSOA-sv over the Amazon basin is up to 0.7 µg m−3. The atmosphere over the Pacific and Indian Oceans is also affected by
10
biomass burning emissions from the Amazon rainforest and the rainforests of south-eastern Asia, respectively (bbSOA-sv concentration is 0.1–0.3 µg m−3). Over the boreal forests, bbSOA-sv reaches low levels (less than 0.1 µg m−3) as most of the biomass burning SVOCs are emitted directly into the aerosol phase forming bbPOA.
4.5 Secondary Organic Aerosol from IVOCs
15
IVOCs are emitted in the gas phase where they react with OH and produce SOA-iv, which is less volatile and more chemically processed secondary organic aerosol. SOA-iv is subdSOA-ivided into fSOA-SOA-iv and bbSOA-SOA-iv depending on the source as described in Sect. 3.5. In the current application, IVOC emissions are assumed to be 4 times higher than of SVOC (Table 4). Therefore, IVOCs are a significant source of SOA and the
SOA-20
iv concentration by far exceeds that of SOA-sv and POA (Figs. 5–7). Furthermore, the effective long-range transport of IVOCs results in the formation of significant SOA-iv amounts far from the sources (Fig. 7).
fSOA-iv: the global average surface concentration of fSOA-iv is 0.22 µg m−3(Fig. 7a). This is two times higher than the corresponding average surface concentration of
25
GMDD
7, 5465–5515, 2014ORACLE: an organic aerosol module
A. P. Tsimpidi et al.
Title Page
Abstract Introduction
Conclusions References
Tables Figures
◭ ◮
◭ ◮
Back Close
Full Screen / Esc
Printer-friendly Version Interactive Discussion
Discussion
P
a
per
|
Discus
sion
P
a
per
|
Discussion
P
a
per
|
Discussion
P
a
per
|
that fSOA-iv is more regionally distributed compared to fPOA, due to the effects of long-range transport of IVOC emissions on fSOA-iv formation. The model predicts a continental background of around 0.5 µg m−3 for fSOA-iv. The highest fSOA-iv con-centrations are predicted over India and Bangladesh (3–7 µg m−3), eastern China (1– 4 µg m−3) and western Africa (1–4 µg m−3). The Balkan Peninsula and eastern
Mediter-5
ranean are strongly influenced by long-range transport of IVOC emissions from Eastern Europe (the fSOA-iv concentration is 0.5–1 µg m−3). fSOA-iv concentrations are also significant over the Arabian Peninsula (around 1 µg m−3), eastern and South Africa (0.5–1 µg m−3). Over North America fSOA-iv concentrations are relatively high over a large area covering the eastern USA, the Californian Peninsula and North Mexico
10
(0.5–1 µg m−3), while over South America high fSOA-iv concentrations are predicted mostly over Rio de Janeiro (0.5–1 µg m−3). Long-range transport is also important for the predicted fSOA-iv concentrations over the oceans. This is mostly evident over the Arabian Sea where the fSOA-iv concentration is 1–2 µg m−3, due mainly to long-range transport of fSOA-iv from India. The Atlantic Ocean atmosphere is influenced by IVOC
15
emissions from western Africa and the fSOA-iv concentration over this region is pre-dicted at 0.5–1 µg m−3. Over the Pacific Ocean fSOA-iv is sensitive to long-range trans-port from the Los Angeles and Mexico City areas and from Beijing and other big cities in eastern China, resulting in significant concentrations offthe west coast of California (up to 0.5–1 µg m−3) and the Pacific Rim (up to 0.5–1.5 µg m−3).
20
bbSOA-iv: the predicted global average surface concentration of bbSOA-iv is 0.42 µg m−3 (Fig. 7b). Similar to fSOA-iv, bbSOA-iv is two times higher than bbPOA and disperses over a wide area covering most of South America, Central and South Africa, Eastern Russia, Southeastern Asia and Indonesia due to emissions from the major rainforests and savannas in the Southern Hemisphere, the tropics and the
bo-25
GMDD
7, 5465–5515, 2014ORACLE: an organic aerosol module
A. P. Tsimpidi et al.
Title Page
Abstract Introduction
Conclusions References
Tables Figures
◭ ◮
◭ ◮
Back Close
Full Screen / Esc
Printer-friendly Version Interactive Discussion
Discussion
P
a
per
|
Discus
sion
P
a
per
|
Discussion
P
a
per
|
Discussion
P
a
per
|
Africa, South America and Indonesia are strongly influenced by long-range transport of bbSOA-iv. The strongest transport effect is predicted over the Atlantic Ocean, where biomass burning IVOC emissions can travel thousands of kilometers from the sources (e.g., the Congo Basin), resulting in significant bbSOA-iv concentrations (2–6 µg m−3).
4.6 Secondary Organic Aerosol from VOCs
5
SOA-v is formed from the oxidation of biogenic and anthropogenic VOCs. Global VOC emissions are dominated by biogenic compounds from vegetated areas (Kanakidou et al., 2005). However, anthropogenic VOCs, emitted in urban areas, can also con-tribute significantly to SOA formation, especially considering the aging reactions of aSOA-v.
10
bSOA-v: the global average surface concentration of bSOA-v is 0.28 µg m−3 (Fig. 8a). EMAC predicts the highest bSOA-v concentrations over the Amazon basin (5–10 µg m−3) mostly due to the oxidation of isoprene. Over the Congo Basin, where isoprene emissions are similar to monoterpene emissions, the bSOA-v average sur-face concentration is 3–6 µg m−3. bSOA-v concentrations are also relatively high over
15
Southeast Asia (2–4 µg m−3), Southeast USA and Australia (2–5 µg m−3), and Europe (0.5–1.5 µg m−3).
aSOA-v: the global average surface concentration of aSOA-v is 0.23 µg m−3 (Fig. 8b). Photochemical aging adds significantly to aSOA-v since only 10 % of the predicted aSOA-v is formed from the first photooxidation step of aSOA-v. The
remain-20
der 90 % is formed through the continued oxidation of aSOA-v. The aggressive aging of aSOA-v results in a wider distribution of aSOA-v than bSOA-v and in a significant contribution of aSOA-v to the total SOA-v (45 %). The aSOA-v is predicted to have a continental background of around 0.5 µg m−3 and relatively high concentrations in the vicinity of urban areas. The highest concentrations are predicted over India and
25
GMDD
7, 5465–5515, 2014ORACLE: an organic aerosol module
A. P. Tsimpidi et al.
Title Page
Abstract Introduction
Conclusions References
Tables Figures
◭ ◮
◭ ◮
Back Close
Full Screen / Esc
Printer-friendly Version Interactive Discussion
Discussion
P
a
per
|
Discus
sion
P
a
per
|
Discussion
P
a
per
|
Discussion
P
a
per
|
(33 %), and olefines (2 %). However, these numbers do not proportionally reflect the VOC contributions to the aSOA-v formation since different types of aVOC have diff er-ent aerosol yields. Over Europe, the highest aSOA-v concer-entrations occur over the Mediterranean Basin (0.5–1 µg m−3) due to the long-range transport of aSOA-v from Central European emissions. Over the USA, aSOA-v concentrations are relatively high
5
over California and the eastern USA (around 1 µg m−3).
4.7 Chemical composition of OA
Table 7 summarizes the predicted global average chemical composition of OA at the surface. According to these results, most of OA is SOA (82 %) formed from the oxi-dation of organic compounds in the gas phase. SOA consists of 52 % SOA-iv, 42 %
10
SOA-v, and 6 % SOA-sv. The important contribution of SOA-iv to the overall SOA mass is attributed to the fact that high amounts of fuel combustion and biomass burning IVOC emissions react with atmospheric oxidants to form low volatility products that condense into the particle phase as SOA-iv. This result further emphasizes the importance of the oxidation of IVOCs as an additional source of OA and implies that global and regional
15
models that do not account for IVOCs could underestimate OA formation as much as by 40 %. In addition, the model results highlight the importance of anthropogenic emis-sions to the global OA formation. In particular, it predicts that one third of OA originates from anthropogenic sources. Even if this fraction may be overestimated due to the aggressive aging of IVOCs and aVOCs applied in this study, it corroborates the
find-20
ings of recent studies that highlight the potentially large impact of anthropogenic OA, especially SOA, on the global aerosol load (Carslaw et al., 2013; Lee et al., 2013).
At higher altitudes the production of SOA is enhanced since organic gases are effi -ciently transported vertically and can be oxidized forming lower volatile SOA (Fig. 9). In addition, the produced SOA in higher altitudes has a relatively long lifetime since it
25
GMDD
7, 5465–5515, 2014ORACLE: an organic aerosol module
A. P. Tsimpidi et al.
Title Page
Abstract Introduction
Conclusions References
Tables Figures
◭ ◮
◭ ◮
Back Close
Full Screen / Esc
Printer-friendly Version Interactive Discussion
Discussion
P
a
per
|
Discus
sion
P
a
per
|
Discussion
P
a
per
|
Discussion
P
a
per
|
troposphere is predicted to be higher than bSOA-v since the latter is not allowed to par-ticipate in additional photochemical reactions (Table 7). The predicted tropospheric bur-den of POA is 0.23 Tg, the sum of SOA-sv and SOA-iv is 1.57 Tg, and SOA-v is 1.2 Tg. Pye and Seinfeld (2010) predicted 0.03 Tg of POA, 0.90 Tg of SOA-sv and SOA-iv, and 0.71 Tg of v, while Jathar et al. (2011) predicted 0.09 Tg of POA, 1.25 Tg of
SOA-5
sv and SOA-iv, and 1.02 Tg of SOA-v. Farina et al. (2010) and Jo et al. (2013) did not account for SOA-sv and SOA-iv and predicted 1.1 Tg and 0.8 Tg of POA, respectively, and 0.98 Tg and 1.16 Tg of SOA-v, respectively.
5 Conclusions
A new module describing the organic composition of aerosols and its evolution in the
10
atmosphere has been developed and implemented into the EMAC global model. ORA-CLE treats fossil fuel, biofuel and biomass burning related aerosol emissions as semi-volatile and chemically reactive, and also accounts for the emissions and oxidation of IVOCs as an additionally important source of OA. Furthermore, it considers the forma-tion of SOA from the oxidaforma-tion of anthropogenic and biogenic VOC precursors. The
15
model employs the volatility basis set theory to simulate the emissions, chemical reac-tions and phase partitioning of all OA components.
The comparison of the model results with measured ambient OA mass concentra-tions illustrates that by treating fuel combustion and biomass burning aerosol emissions as semi-volatile and reactive, and accounting for emissions and oxidation of IVOCs and
20
traditional VOCs, the model realistically predicts the sources, chemistry and properties of OA, and reproduces the measured concentrations of OA over urban and forested areas. In contrast to previous CCMs that treat POA as non-volatile and non-reactive, the ORACLE module predicts that most of the OA is SOA (82 %). Furthermore, ap-proximately one third of OA is predicted to originate from anthropogenic sources. Such
25
GMDD
7, 5465–5515, 2014ORACLE: an organic aerosol module
A. P. Tsimpidi et al.
Title Page
Abstract Introduction
Conclusions References
Tables Figures
◭ ◮
◭ ◮
Back Close
Full Screen / Esc
Printer-friendly Version Interactive Discussion
Discussion
P
a
per
|
Discus
sion
P
a
per
|
Discussion
P
a
per
|
Discussion
P
a
per
|
On average, model calculated OA at the surface consists of 18 % POA, 5 % SOA-sv, 43 % SOA-iv, and 34 % SOA-v. The tropospheric burdens of OA components are pre-dicted to be 0.23 Tg POA, 0.16 Tg SOA-sv, 1.41 Tg SOA-iv and 1.2 Tg SOA-v. POA con-centrations are particularly high close to biomass burning regions (forest and savannah fires) and fuel combustion related sources (urban and industrial regions), though
de-5
crease rapidly during atmospheric transport. SOA-sv concentrations are four to five times lower than POA concentrations since most of the SVOCs are emitted directly in the aerosol phase. IVOCs, on the other hand, are predicted to be important SOA precursors, resulting in high SOA-iv concentrations that are widely dispersed over the continents and the tropical oceans, being subject to the long-range transport of IVOC
10
emissions. SOA-v accounts for 34 % of the total SOA concentration and originates from biogenic sources (55 %) and anthropogenic sources (45 %). In the current application, only anthropogenic SOA-v was allowed to participate in aging reactions, which consid-erably increases the predicted aSOA-v concentration.
The ORACLE module subdivides OA into several compounds allowing the
quantifi-15
cation of primary vs. secondary as well as biogenic vs. anthropogenic contributions to OA concentrations. Such fundamental information can shed light on long-term changes in OA abundance, and hence project the effects of OA on future air quality and climate. ORACLE is well suited for studying the climatic impact of OA as it captures the dy-namic aging of OA and its atmospheric evolution by becoming increasingly oxidized,
20
less volatile, and more hygroscopic. Future applications therefore also include the ef-fects on cloud condensation nuclei and indirect aerosol effects on climate. Furthermore, the detailed composition of OA, computed by ORACLE, can be used to directly com-pare model predictions with the latest aerosol mass spectrometer (AMS) factor analysis data, which is planned as a next application.
25
GMDD
7, 5465–5515, 2014ORACLE: an organic aerosol module
A. P. Tsimpidi et al.
Title Page
Abstract Introduction
Conclusions References
Tables Figures
◭ ◮
◭ ◮
Back Close
Full Screen / Esc
Printer-friendly Version Interactive Discussion
Discussion
P
a
per
|
Discus
sion
P
a
per
|
Discussion
P
a
per
|
Discussion
P
a
per
|
be used, along with AMS factor analysis data from around the world, to optimize the model configuration in order to further improve the estimates of OA concentrations and investigate their role in air quality and climate.
Acknowledgements. The research leading to these results has received funding from the
European Research Council under the European Union’s Seventh Framework Programme
5
(FP7/2007-2013)/ERC grant agreement no 226144. V. A. Karydis acknowledges support from a FP7 Marie Curie Career Integration Grant (project reference 618349).
The service charges for this open access publication have been covered by the Max Planck Society.
10
References
Aiken, A. C., Decarlo, P. F., Kroll, J. H., Worsnop, D. R., Huffman, J. A., Docherty, K. S., Ul-brich, I. M., Mohr, C., Kimmel, J. R., Sueper, D., Sun, Y., Zhang, Q., Trimborn, A., North-way, M., Ziemann, P. J., Canagaratna, M. R., Onasch, T. B., Alfarra, M. R., Prevot, A. S. H., Dommen, J., Duplissy, J., Metzger, A., Baltensperger, U., and Jimenez, J. L.: O/C and
15
OM/OC ratios of primary, secondary, and ambient organic aerosols with high-resolution time-of-flight aerosol mass spectrometry, Environ. Sci. Technol., 42, 4478–4485, 2008. Athanasopoulou, E., Vogel, H., Vogel, B., Tsimpidi, A. P., Pandis, S. N., Knote, C., and
Foun-toukis, C.: Modeling the meteorological and chemical effects of secondary organic aerosols during an EUCAARI campaign, Atmos. Chem. Phys., 13, 625–645,
doi:10.5194/acp-13-625-20
2013, 2013.
Bergström, R., Denier van der Gon, H. A. C., Prévôt, A. S. H., Yttri, K. E., and Simpson, D.: Modelling of organic aerosols over Europe (2002–2007) using a volatility basis set (VBS) framework: application of different assumptions regarding the formation of secondary organic aerosol, Atmos. Chem. Phys., 12, 8499–8527, doi:10.5194/acp-12-8499-2012, 2012.
25
GMDD
7, 5465–5515, 2014ORACLE: an organic aerosol module
A. P. Tsimpidi et al.
Title Page
Abstract Introduction
Conclusions References
Tables Figures
◭ ◮
◭ ◮
Back Close
Full Screen / Esc
Printer-friendly Version Interactive Discussion
Discussion
P
a
per
|
Discus
sion
P
a
per
|
Discussion
P
a
per
|
Discussion
P
a
per
|
Browne, E. C., Min, K.-E., Wooldridge, P. J., Apel, E., Blake, D. R., Brune, W. H., Cantrell, C. A., Cubison, M. J., Diskin, G. S., Jimenez, J. L., Weinheimer, A. J., Wennberg, P. O., Wisthaler, A., and Cohen, R. C.: Observations of total RONO2 over the boreal forest: NOx sinks and HNO3sources, Atmos. Chem. Phys., 13, 4543–4562, doi:10.5194/acp-13-4543-2013, 2013.
5
Capes, G., Johnson, B., McFiggans, G., Williams, P. I., Haywood, J., and Coe, H.: Aging of biomass burning aerosols over West Africa: aircraft measurements of chemical composi-tion, microphysical properties, and emission ratios, J. Geophys. Res.-Atmos., 113, D00C15, doi:10.1029/2008jd009845, 2008.
Capes, G., Murphy, J. G., Reeves, C. E., McQuaid, J. B., Hamilton, J. F., Hopkins, J. R.,
10
Crosier, J., Williams, P. I., and Coe, H.: Secondary organic aerosol from biogenic VOCs over West Africa during AMMA, Atmos. Chem. Phys., 9, 3841–3850, doi:10.5194/acp-9-3841-2009, 2009.
Carslaw, K. S., Lee, L. A., Reddington, C. L., Mann, G. W., and Pringle, K. J.: The magnitude and sources of uncertainty in global aerosol, Faraday Discuss., 165, 495–512, 2013.
15
Carter, W. P. L.: Documentation of the SAPRC-99 chemical mechanism for VOC reactivity as-sessment., Report to the California air resources board, available at: http://www.cert.ucr.edu/ ~carter/absts.htm#saprc99 (last access: 7 August 2014), 2000.
Chen, Q., Farmer, D. K., Schneider, J., Zorn, S. R., Heald, C. L., Karl, T. G., Guenther, A., Allan, J. D., Robinson, N., Coe, H., Kimmel, J. R., Pauliquevis, T., Borrmann, S., Poeschl, U.,
20
Andreae, M. O., Artaxo, P., Jimenez, J. L., and Martin, S. T.: Mass spectral characterization of submicron biogenic organic particles in the Amazon Basin, Geophys. Res. Lett., 36, L20806, doi:10.1029/2009gl039880, 2009.
Clarke, L., Edmonds, J., Jacoby, H., Pitcher, H., Reilly, J., and Richels, R.: Scenarios of green-house gas emissions and atmospheric concentrations (Part A) and review of integrated
sce-25
nario development and application (Part B). A report by the US climate change science program and the subcommittee on global change research, 2007.
de Meij, A., Pozzer, A., Pringle, K. J., Tost, H., and Lelieveld, J.: EMAC model evaluation and analysis of atmospheric aerosol properties and distribution with a focus on the Mediterranean region, Atmos. Res., 114, 38–69, 2012.
30