Atmos. Chem. Phys., 17, 2053–2065, 2017 www.atmos-chem-phys.net/17/2053/2017/ doi:10.5194/acp-17-2053-2017
© Author(s) 2017. CC Attribution 3.0 License.
Evaluation of anthropogenic secondary organic aerosol tracers from
aromatic hydrocarbons
Ibrahim M. Al-Naiema and Elizabeth A. Stone
Department of Chemistry, University of Iowa, Iowa City, IA 52242, USA Correspondence to:Elizabeth A. Stone (betsy-stone@uiowa.edu) Received: 8 September 2016 – Discussion started: 13 September 2016
Revised: 21 December 2016 – Accepted: 7 January 2017 – Published: 10 February 2017
Abstract. Products of secondary organic aerosol (SOA) from aromatic volatile organic compounds (VOCs) – 2,3-dihydroxy-4-oxopentanoic acid, dicarboxylic acids, ni-tromonoaromatics, and furandiones – were evaluated for their potential to serve as anthropogenic SOA tracers with respect to their (1) ambient concentrations and detectabil-ity in PM2.5 in Iowa City, IA, USA; (2) gas–particle
par-titioning behaviour; and (3) source specificity by way of correlations with primary and secondary source tracers and literature review. A widely used tracer for toluene-derived SOA, 2,3-dihydroxy-4-oxopentanoic acid was only detected in the particle phase (Fp=1) at low but consistently
mea-surable ambient concentrations (averaging 0.3 ng m−3). Four aromatic dicarboxylic acids were detected at relatively higher concentrations (9.1–34.5 ng m−3), of which phthalic acid was the most abundant. Phthalic acid had a low particle-phase fraction (Fp=0.26) likely due to quantitation
inter-ferences from phthalic anhydride, while 4-methylphthalic acid was predominantly in the particle phase (Fp=0.82).
Phthalic acid and 4-methylphthalic acid were both highly correlated with 2,3-dihydroxy-4-oxopentanoic acid (rs=
0.73, p=0.003; rs=0.80, p <0.001, respectively),
sug-gesting that they were derived from aromatic VOCs. Isoph-thalic and terephIsoph-thalic acids, however, were detected only in the particle phase (Fp=1), and correlations suggested
association with primary emission sources. Nitromonoaro-matics were dominated by particle-phase concentrations of 4-nitrocatechol (1.6 ng m−3) and 4-methyl-5-nitrocatechol (1.6 ng m−3) that were associated with biomass burning. Meanwhile, 4-hydroxy-3-nitrobenzyl alcohol was detected in a lower concentration (0.06 ng m−3)in the particle phase only (Fp=1) and is known as a product of toluene
pho-tooxidation. Furandiones in the atmosphere have only been
attributed to the photooxidation of aromatic hydrocarbons; however the substantial partitioning toward the gas phase (Fp≤0.16) and their water sensitivity limit their
applica-tion as tracers. The outcome of this study is the demonstra-tion that 2,3-dihydroxy-4-oxopentanoic acid, phthalic acid, 4-methylphthalic acid, and 4-hydroxy-3-nitrobenzyl alcohol are good candidates for tracing SOA from aromatic VOCs.
1 Introduction
Secondary organic aerosol (SOA) accounts for a large but un-defined fraction of organic matter in PM2.5, forming through
the photooxidation of biogenic and anthropogenic volatile organic compounds (VOCs) in the gas phase yielding low-vapour-pressure products that partition into the particle phase (Kroll and Seinfeld, 2008; Hallquist et al., 2009). The global fluxes of anthropogenic SOA are poorly constrained and highly uncertain, with a wide range of estimates from 2 to 25 Tg yr−1(Volkamer et al., 2006; Henze et al., 2008). Mea-surements suggest that anthropogenic precursors form more SOA than predicted by models (Heald et al., 2005; Volkamer et al., 2006; Matsui et al., 2009), likely due to incomplete model representation of SOA formation pathways (Henze et al., 2008), partitioning (Donahue et al., 2006), ambient con-ditions (Ng et al., 2007), and precursors (Robinson et al., 2007; Fu et al., 2008).
A tracer-based approach has been useful in identifying aerosol sources and source apportionment (Schauer et al., 1996). SOA can be linked to its precursor VOC follow-ing the SOA tracer approach introduced by Kleindienst et al. (2007) in which ambient concentration of tracers (or the sum of thereof) are converted to secondary organic carbon
(SOC) or SOA mass yields using OC or tracer-to-SOA ratios, respectively, that were determined in chamber studies. For biogenic SOA, relatively well defined and es-tablished tracers are employed, such as methyltetrols for iso-prene andβ-caryophyllinic acid forβ-caryophyllene (Klein-dienst et al., 2007). In contrast, the tracer-based approach for aromatic SOA relies on a single molecule (2,3-dihydroxy-4-oxopentanoic acid (DHOPA)) that is derived from toluene (Kleindienst et al., 2007). Advancing the tracer-based ap-proach to anthropogenic SOA apportionment should involve expanding the number of available tracers, particularly those that form from aromatic VOCs other than toluene.
Chamber experiments have been conducted to identify SOA products formed during the photooxidation of aromatic precursors associated with anthropogenic sources, such as benzene, toluene, ethylbenzene, xylenes (BTEX), and low-molecular-weight polycyclic aromatic hydrocarbons (PAHs). Furandiones have been identified as a major product of aro-matic VOC photooxidation in the presence of NOx(Bandow et al., 1985; Forstner et al., 1997; Hamilton et al., 2003; Koehler et al., 2004). Nitromonoaromatics (e.g. nitrophenols, methyl-nitrophenols, nitrocatechols, and nitrosalicylic acids) are likewise products of aromatic VOC photooxidation in the presence of NOx (Forstner et al., 1997; Jang and Kamens, 2001; Hamilton et al., 2005; Sato et al., 2012; Irei et al., 2015), but some of these species have also been detected in the primary emission from vehicles (Tremp et al., 1993) and biomass burning (Iinuma et al., 2010). While nitromonoaro-matics have been quantified in ambient aerosol (Dron et al., 2008; Kitanovski et al., 2012; Kahnt et al., 2013), the extent of their formation from primary and/or secondary sources has yet to be determined. Phthalic acid is a product of naphtha-lene photooxidation (Kautzman et al., 2010) and has been proposed as a tracer for naphthalene and methylnaphthalenes in PM2.5(Kleindienst et al., 2012). However, phthalic acid
has also been observed in the emission of motor exhaust (Kawamura and Kaplan, 1987), and thus both primary and secondary sources can contribute to its ambient concentra-tion. These three classes of compounds can be potentially used a tracers for SOA; however, further ambient studies are needed to evaluate their detectability, ambient concen-trations, and origins.
There are many desired characteristics for a molecule to be used as a source tracer. First, it should be unique to the source of origin. For example DHOPA was previously iden-tified as a unique product of toluene photooxidation in the presence of NOx(Kleindienst et al., 2004), and methyltetrols are unique to isoprene (Claeys et al., 2004a). Second, the tracer should be formed in reasonably high yields so it has sufficiently high concentrations in the atmosphere to allow for reliable quantification. Third, the tracer needs to be rea-sonably stable in the atmosphere, so that it is conserved be-tween formation and collection at a receptor location. Fourth, an efficient SOA tracer should have a low vapour pressure so that it primarily partitioned to the particle phase, which
min-imizes possible underestimation from loss to the gas phase. Thus, an effective SOA tracer will exhibit source specificity, consistent detectability, atmospheric stability, and partition-ing to the aerosol phase.
In this work, we examine and evaluate the efficacy of ni-tromonoaromatics, furandiones, and aromatic dicarboxylic acid isomers as potential SOA tracers in terms of their ambient concentration, gas–particle partitioning, and source specificity through correlations with established tracers, in-cluding levoglucosan for biomass burning (Simoneit et al., 1999), hopanes for vehicular emissions (Schauer et al., 1999), and DHOPA for anthropogenic SOA (Kleindienst et al., 2004). Sample preparation procedures were optimized for the simultaneous extraction of primary and potential sec-ondary source tracers, which were then quantified by gas chromatography–mass spectrometry (GC-MS). These meth-ods were applied to measure the ambient concentrations and gas–particle distributions for analytes in fine particulate mat-ter (PM2.5)collected in Iowa City, IA, in the autumn of 2015.
November was chosen for this study because, in a prior study at this site, biogenic SOA tracers were detected in this month (Jayarathne et al., 2016) and aromatic SOA tracers have a less pronounced seasonal variation than those that are bio-genic (Shen et al., 2015; Ding et al., 2012; Lewandowski et al., 2008). Developing and evaluating these tracers provide additional tools for better understanding the contribution of aromatic VOCs to ambient aerosol and will help to expand the current knowledge about the composition and sources of ambient aerosol, particularly in urban and peri-urban envi-ronments.
2 Experimental methods 2.1 Field sampling
Gas and particle (PM2.5)samples were simultaneously
col-lected daily for the period 4–15 November 2015 in Iowa City, IA, USA (41.6572◦N, 91.5035◦W). The sampler was in-stalled on a wooden platform, and the inlet was positioned 3.5 m above ground level. The sampling site was surrounded by an agricultural field and a university parking lot. Sample collection was preformed using a medium-volume URG air sampler (3000B, URG Corp.) with a cyclone (URG) operat-ing at a flow rate of 90 L min−1. Air flow rate was monitored before and after sampling using a rotameter (Gilmont Instru-ments). PM2.5 samples were collected on 90 mm quartz
I. M. Al-Naiema and E. A. Stone: Evaluation of anthropogenic secondary organic aerosol tracers 2055
apparatus is composed of a thick-walled borosilicate glass cylinder equipped with a polytetrafluoroethylene (PTFE) valve and PTFE plunger that was used to compress the sol-vent out of the PUF.
Samples were collected for 23 h, and filter changing was performed at 08:00 (local time). After sampling, filters were transferred to Petri dishes, lined with pre-baked aluminum foil, and sealed with Teflon tape. PUF samples were trans-ferred to pre-baked wide-mouth glass jars, capped with a Teflon-lined cap, and sealed with Teflon tape. Sampled filters and PUF were transported to the laboratory and stored frozen at−20◦C until analysis. One field blank was collected for every five samples following the same described procedure, except no air was pulled through the system.
2.2 Extraction
All glassware used in this experiment was first baked (500◦C
for 5 h) to remove organic contaminants and then silanized (using 5 % solution of dichlorodimethylsilane in toluene) to minimize the sorption of analytes to the glass surface (Ki-tanovski et al., 2012). Filters and PUF were spiked with isotopically labelled internal standards, representing the dif-ferent classes of organic compounds reported in this study. Adding internal standards prior to extraction corrects for loss of analyte during the extraction process, provided the inter-nal standard adequately represents the chemical and phys-ical properties of the analyte. Specifphys-ically, internal stan-dards and their corresponding analytes were 3-nitrosalicylic acid-D3 and 5-nitrosalicylic acid; 4-nitrophenol (4NP)-D4
and other nitromonoaromatics; maleic anhydride-D2for
2,5-furandione, and succinic anhydride-2,2,3,3-D4 for the three
other furandiones; levoglucosan13C6 for levoglucosan;
ke-topinic acid (KPA) for DHOPA; phthalic acid-D4 for
aro-matic dicarboxylic acids; and acenaphthene-D10,
pyrene-D10, benzo[a]anthracene-D12, coronene-D12 for PAHs. The
use of KPA as an internal standard for DHOPA builds upon prior work by Kleindienst et al. (2007).
Filters were extracted sequentially with three 10 mL por-tions of acetonitrile using ultrasonication (Branson 5510, 137 W) for 15 min at 60 sonics per minute. The combined three extracts were reduced to 2 mL by rotary evaporation at 30◦C, 120 rpm, and 200 mbar. The reduced extracts were filtered with a 0.25 µm PTFE syringe filters and stored frozen at
−20◦C until analysis. Immediately prior to analysis, the
ex-tracts were evaporated to 100 µL under a gentle stream of ultra-pure nitrogen at 30◦C. PUF samples were extracted by
three cycles of repeated compression using acetonitrile; ex-tracts were then combined, evaporated, filtered, and reduced to the final volume using the same conditions as filter ex-tracts.
2.3 Instrumental analysis
OC and elemental carbon (EC) were measured by thermal-optical analysis (Sunset Laboratory Inc.) on a 1 cm2 filter portion, following Schauer et al. (2003).
Organic species were analysed using an Agilent 7890A GC, coupled with 5975C MS (Agilent Technologies). 2,3-Dihydroxy-4-oxopentanoic acid (Toronto Research Chem-icals), phthalic acid isomers, levoglucosan, and bio-genic SOA tracers were trimethylsilylated with N,O-bis(trimethylsilyl)trifluoroacetamide (BSTFA-TMCS; Fluka Analytical 99 %) prior to analysis. The silylation reaction was performed by evaporating 10 µL of the extract under a gentle stream of nitrogen to dryness, adding 20 µL of the silylation agent and 10 µL of pyridine (Burdick & Jackson, Anhydrous), and heating to 70◦C for 3 h. A 2 µL aliquot of the silanized extract was introduced to the GC-MS equipped with a DB-5 column, electron ionization (EI) source (70 eV), and a GC inlet temperature of 300◦C. Nitromonoaromatics were also silylated using the same reagent but under differ-ent conditions, in which 20 µL of the extract was evaporated to dryness under a gentle stream of nitrogen, 10 µL of the silylation agent was added, and then the mixture was capped and heated for 90 min at 100◦C. The different silylation
pro-tocol used for nitromonoaromatics yielded more symmetri-cal peak shapes and higher intensities than the derivatization method used for levoglucosan and phthalic acid isomers that resulted in asymmetrical nitromonoaromatic peaks with low intensities. The GC injection volume was 1 µL, and the inlet conditions, column type, and MS parameters matched those previously described. Furandiones were analysed using the method developed in our previous work (Al-Naiema et al., 2017), and PAHs were analysed using a DB-5 column as de-scribed elsewhere (Al-Naiema et al., 2015).
Responses of the analytes were normalized to the corre-sponding isotopically labelled internal standards and quanti-fied using a linear calibration curve with a squared correla-tion coefficient (R2)≥0.995. Analytical uncertainties were propagated from the standard deviation of the field blank value and 10 % of the measured concentration. For analytes not detected in the field blank, instrument detection limits were used in error propagation. All measurements were field-blank-subtracted. Due to low recoveries of furandiones from PUF, gas-phase concentrations of furandiones were corrected for the recoveries of the authentic standards.
2.4 Particle-phase fraction calculation and model The fraction of a species in the particle phase (Fp)was
cal-culated from the ratio of concentration in the particle phase to the total concentration (sum of gas and particle), following Eq. (1).
Fp=
[particle]
gas
+ [particle] (1)
Fpwas modelled using the gas–particle partitioning
coeffi-cient (Eq. 2) from absorptive partitioning theory developed by Pankow (1994), and following Yatavelli et al. (2014):
Fp=
1+ 1
kom×COA
−1
, (2)
where COA is the concentration of the organic aerosol
(µg m−3)and kom is the partitioning coefficient (m3µg−1)
described as
kom=
RT
106PL0EMW, (3)
in which R is an ideal gas constant
(8.2×10⁻⁵m3atm mol−1K−1); T is temperature (av-eraging 9◦C during this study); 106 is a unit conversion factor (µg g−1);P0
L is the sub-cooled vapour pressure (atm),
obtained from the Estimation Program Interface suite™ version 4.11 from the Environmental Protection Agency (EPA); MW is the molar mass (g mol−1); and E is the activity coefficient (set equal to 0.3, 1, and 3).
2.5 Statistical analysis
Inter-species correlations were evaluated using Minitab soft-ware (version 16). The Anderson–Darling test for nor-mality indicated that neither ambient concentrations nor log-transformed concentrations were normally distributed. Hence, Spearman’s rho (rs)was used to assess correlations.
Correlations were interpreted as follows: very high (0.9–1.0), high (0.7–0.9), moderate (0.5–0.7), low (0.3–0.5), and neg-ligible (0.0–0.3) (Mukaka, 2012). The statistical significance of correlations was evaluated at the 95 % confidence interval (p≤0.05).
3 Results and discussion
3.1 Validation of gas–particle partitioning
PAHs with two to five rings span a range of high to low volatility, respectively. The accuracy of the measured gas– particle distributions were evaluated with PAHs that have been extensively discussed in the literature. The average fractions of PAH in the particle phase (Fp) measured in
Iowa City, IA, USA (Fig. 1), were∼5 % for 10–14 carbon atoms (two–three rings: naphthalene, acenaphthene, and an-thracene), 14 % for 16 carbon atoms (four rings: pyrene), 59 % for 18 carbons (four rings: benzo(ghi)fluoranthene), and >98 % for 20 carbon atoms (five rings: picene). The predictedFp values estimated using the Pankow absorption
model (1994) following Eqs. (1) and (2) and using param-eters in Table S1 in the Supplement follow the same trend (Fig. 1, dashed line), with a systematic underestimation for the predicted Fp by ≤12 % for most PAHs and 20 % for
Figure 1.Fraction of PAHs in the particle phase as a function of
the number of carbon atoms. Circles represent the daily measured
Fp (n=14), the red line represents averageFp, and the dotted line (black) is the predictedFp using the absorption model (Ta-ble S1). Select PAHs were used compare ambient measurements and model estimation: C10 is naphthalene, C12 is acenaphthene, C14 is anthracene, C16 is pyrene, C18 is benzo(ghi)fluoranthene, C20is benzo(b)fluoranthene, and C22is picene.
18 carbons. Such an underestimation has been widely docu-mented in comparison of theory to ambient partitioning stud-ies and is attributed to the omission of PAH sorption on el-emental carbon in the model (Dachs and Eisenreich, 2000; He and Balasubramanian, 2009; Wang et al., 2011). Ambient studies of gas–particle partitioning are influenced by many factors such as ambient temperatures (Terzi and Samara, 2004), relative humidity (Pankow et al., 1993), and sampling technique (reviewed by Kim and Kim, 2015), confounding direct comparisons between this and other studies. Overall, the general trends observed herein are consistent with prior studies that report PAHs with two–three aromatic rings (C10–
C14)mainly in the gas phase (Fp≥0.93), those with five or
more aromatic rings (≥ C20) mainly in the particle phase
(Fp≥0.9), and those with four aromatic rings (C16and C18)
partitioned between the two phases depending on their chem-ical structure and atmospheric conditions (Yamasaki et al., 1982; Williams et al., 2010; Ma et al., 2011; Kim and Kim, 2015).
Gas-phase sampling using QFF without a denuder upfront is subject to artefacts caused by vapour adsorption on the filter, resulting in underestimation of the concentration of the species in the gas phase, particularly for low-MW PAHs (Delgado-Saborit et al., 2014). However, comparing the par-titioning trend in this study to those sampled with a de-nuder during the same season (Possanzini et al., 2004) shows less than 5 % discrepancies for the low (C≤12) and high (C≥18) molecular weight PAHs, while for C14and C16our
Fp measurements were lower by 14 and 6 %, respectively.
These results show a slight underestimation ofFprather than
I. M. Al-Naiema and E. A. Stone: Evaluation of anthropogenic secondary organic aerosol tracers 2057
Figure 2.Mass spectrum of the trimethylsilylateted derivatives of
2,3-dihydroxy-4-oxopentanoic acid by electron impact ionization.
with our gas–particle partitioning measurements are ≤5 % for species predominantly in the particle phase (Fp>0.9) or
gas phase (Fp<0.1) and are in the range of 14 % for
semi-volatile species (0.1< Fp<0.9).
3.2 The toluene tracer (2,3-dihydroxy-4-oxopentanoic acid)
3.2.1 GC-MS identification
2,3-Dihydroxy-4-oxopentanoic acid (DHOPA, also known as T-3) has been identified as a product of toluene photooxida-tion by Kleindienst et al. (2004), and their chemical ioniza-tion mass spectrum has been used to identify this tracer in other studies. To support identification by the more common EI, the corresponding mass spectrum of its trimethylsily-lated (TMS) derivative is given in Fig. 2. The most abundant ions are m/z73 and 147, corresponding to Si(CH3)3+ and
(CH3)2Si=O Si(CH3)3+fragments, respectively; however,
these are common to the BSTFA-TMCS silylation reagent. Ions at m/z277, 349, 321, and 364 are unique to DHOPA and are recommended for quantification. Here, the m/z277 ion was used for quantification due to the high relative abun-dance and low background, and the other ions were used qualitatively. This mass spectrum obtained from a pure stan-dard builds upon the previous EI mass spectrum for the DHOPA in an aerosol sample by Hu et al. (2008) that in-cluded some spectral interferences from adipic acid that co-eluted.
3.2.2 Ambient concentration and gas–particle partitioning
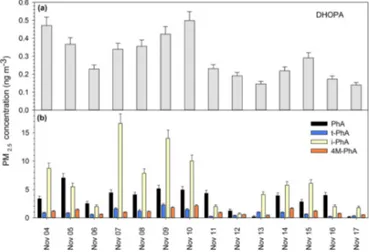
The average mass concentration of DHOPA ranged from 0.14 to 0.50 ng m−3 and averaged 0.29±0.12 ng m−3 (Fig. 3a). DHOPA was detected only in the particle phase (Table 2), although the 22.1±13.5 % extraction recoveries of this species from PUF limited the sensitivity of gas-phase measurements. Nonetheless, it is reasonable to conclude that this species does not appreciably partition to the gas phase.
Figure 3. Daily PM2.5 concentrations for
2,3-dihydroxy-4-oxopentanoic acid(a)and benzene dicarboxylic acids(b), where PhA is phthalic acid, t-PhA is terephthalic acid, i-PhA is isophthalic acid, and 4M-PhA is 4-methylphthalic acid.
The average concentrations of DHOPA in Iowa City were within the range of those observed in Bondville, IL, in au-tumn (Lewandowski et al., 2008) but were lower by a factor of 45 (on average) than what was detected in the Pearl River Delta, China, for the same season (Ding et al., 2012). Al-though an authentic standard for DHOPA was not previously available, prior measurements were based upon a surrogate standard response and are subject to bias.
The contribution of toluene SOA to OC was estimated based on the SOA tracer method introduced by Kleindi-enst et al. (2007), where the DHOPA mass fraction of SOC from toluene was 0.0079±0.0026. Following this es-timation method, toluene SOC was estimated to contribute 36.5±15.0 ngC m−3. The contribution of the estimated SOC to the total OC in this study ranged 0.3–7 % and averaged 2.2±1.6 %. In other studies, the concentration of toluene SOC was variable and influenced by seasonal variations and local emission sources (Kleindienst et al., 2007; Peng et al., 2013). Our estimated SOC levels were less than half of those observed in the rural Midwestern United States previously (0.09 µg m−3)during the same season; however the contri-bution of the estimated toluene SOC to the total OC was 6 % (Lewandowski et al., 2008), which is within the upper end of the range observed in this study. Although toluene SOC concentrations were much higher in the Pearl River Delta (1.65 µg m−3)(Ding et al., 2012), its relative contribution to OC (7 %) was comparable. Because toluene is only one of many aromatic VOC precursors to SOA, additional tracers are needed to better evaluate the impact of aromatic VOCs on SOA.
3.3 Benzene dicarboxylic acids
Three isomers of benzene dicarboxylic acid and one methyl derivative were detected in all PM samples. The total (gas
Table 1.Method performance parameters for nitromonoaromatics, including GC retention time (tR), instrument detection limit (IDL), in-strument quantitation limit (IQL), and mean extraction recoveries (±1 standard deviation forn=3).
Nitromonoaromatic tR Base peak∗ Linear range Linear regression IDL IQL Extraction recovery
Filter PUF
(min) (m/z) (µg L−1) R2 (µg L−1) (µg L−1) (%) (%)
4-Nitrophenol-D4 (IS) (4NP-D4) 9.66 200 – – – – – –
4-Nitrophenol (4NP) 9.69 196 50–5000 0.999 13.2 43.9 100.5±2.2 97.9±2.2
4-Methyl-2-nitrophenol (4M-2NP) 9.71 210 10–5000 0.999 2.7 8.8 96.7±2.8 100.3±0.6
4-Methyl-3-nitrophenol (4M-3NP) 9.71 208 40–5000 0.999 11.4 38.0 100.2±0.5 97.1±3.2
2-Methyl-4-nitrophenol (2M-4-NP) 11.08 210 50–5000 0.999 14.5 48.2 99.7±0.8 99.0±1.6
4-Nitroguaiacol (4NG) 12.08 211 50–5000 0.999 14.9 49.5 94.2±2.4 97.9±2.2
5-Nitroguaiacol (5NG) 12.40 211 30–5000 0.998 6.7 22.4 96.2±3.3 97.4±1.7
4-Nitrocatechol (4NC) 13.13 284 40–5000 0.999 10.1 33.8 102.5±2.9 49.9±17.0
4-Methyl-5-nitrocatechol (4M-5NC) 13.66 313 40–5000 0.999 9.1 30.3 108.1±1.8 41.5±24.8 4-Hydroxy-3-nitrobenzyl alcohol (4H-3NB) 14.23 298 20–5000 0.998 6.3 21.0 95.6±2.5 103.3±3.5
3-Nitrosalicylic acid-D3 (IS) (3NSA-D3) 14.08 315 – – – – – –
5-Nitrosalicylic acid (5NSA) 15.11 312 20–5000 0.996 5.1 16.9 100.2±1.0 95.0±3.1
∗m/zare given for trimethylsilylated derivatives of all analytes.
plus particle) concentration of phthalic acid (PhA), the most abundant isomer, ranged from 4.9 to 21.5 ng m−3 and av-eraged 13.0±4.3 ng m−3, while isophthalic acid (i-PhA), terephthalic acid (t-PhA) and 4-methylphthalic acid (4M-PhA) had increasingly lower concentrations in the range of 0.2 to 6.6 ng m−3(Fig. 3b). Similar relative abundancies for
these species were observed in other studies, with PhA con-sistently being the predominant isomer (Fraser et al., 2003; Mirivel et al., 2011; Mkoma and Kawamura, 2013). The relatively high ambient mass concentrations of these dicar-boxylic acid isomers at levels that allow for consistent de-tection make them promising candidates for tracing aromatic SOA.
The majority of PhA was estimated to be in the gas phase (Fp=0.26), in contrast to i-PhA and t-PhA (Fp=1) and
4-M-PhA (Fp=0.82, Table 2). Vapour pressure values and
partitioning theory (Table S1 in the Supplement) cannot ex-plain the observed lower fraction of PhA in the particle phase compared to i-PhA and t-PhA (Fp=1). Instead, the
gas-phase measurement of PhA is expected to be positively bi-ased due to interference by phthalic anhydride, which yields identical products to PhA when derivatized, hydrolysed, or exposed to high temperatures (like those encountered in GC analysis). For example, under the conditions employed in this study, phthalic anhydride and PhA have identical GC reten-tion time and silylated MS spectra (Fig. S1 in the Supple-ment). Phthalic anhydride is a gas-phase product of naph-thalene photooxidation (Chan et al., 2009; Kautzman et al., 2010) and has much higher vapour pressure (7.5×10⁻⁶atm) than that of PhA (8.9×10⁻⁸atm) (EPA, 2012). As such, ph-thalic anhydride will partition to a greater extent to the gas phase, which is supported by the absorption model estima-tions (Fp=4.9×10⁻⁵), shown in Table S1. Thus, PhA
con-centrations reported here and in prior studies that involve the use of GC inlet temperatures≥150◦C, derivatization, or hy-drolysis (which is common in liquid chromatography) reflect
the sum of PhA and phthalic anhydride. Because phthalic an-hydride is primarily in the gas phase, this causes gas-phase PhA concentrations to be overestimated andFpestimates for
PhA to be erroneously low. An accurate determination ofFp
for PhA requires collection and analysis of acid and anhy-drides separately by in situ derivatization on veratrylamine-coated glass fibre filters (OSHA, 1991).
Although PhA and 4M-PhA can be emitted directly from primary sources such as motor vehicle engines (Kawamura and Kaplan, 1987), there is a lack of evidence for significant primary source contributions to these species in ambient air. In contrast, naphthalene, a precursor for secondary forma-tion of PhA (Kautzman et al., 2010; Kleindienst et al., 2012), was found to be the most abundant PAH from many combus-tion sources (Oanh et al., 1999; Al-Naiema et al., 2015). As shown in Table S3, the concentrations of PhA and 4M-PhA in the particle phase are highly and significantly correlated with DHOPA (rs=0.73,p=0.003;rs=0.79,p=0.001,
re-spectively), but they do not correlate with hopane (rs=0.19,
I.
M.
Al-Naiema
and
E.
A.
Stone:
Ev
aluation
of
anthr
opogenic
secondary
or
ganic
aer
osol
tracers
2059
Table 2.Summary table of ambient concentrations of organic species in gas and particle phases, measured fraction in the particle phase (Fp), frequency of detection in the particle phase (FODp), and sources reported in the literature.
Compound Mean ambient concentration (±SD) Fp(%) FODp(%) Some of the reported
(ng m−3) emission sources in the literature
Particle Gas Secondary photooxidation Biomass burning Vehicle emissions
2,3-Dihydroxy-4-oxopentanoic acid 0.29 (0.12) ND 100 100 Kleindienst et al. (2004)
Phthalic acid 3.42 (1.92) 9.62 (3.70) 26 100 Kleindienst et al. (2012) Kawamura and Kaplan (1987)
Terephthalic acid 0.90 (0.58) ND 100 100
Isophthalic acid 6.21 (4.82) ND 100 100 Kleindienst et al. (2012)
4-Methylphthalic acid 1.08 (0.51) 0.23 (0.22) 82 100 Kleindienst et al. (2012) Kawamura and Kaplan (1987)
4-Nitrophenol 0.63 (0.48) 1.47 (1.95) 30 100 Forstner et al. (1997) Tremp et al. (1993)
4-Methyl-2-nitrophenol 0.26 (0.09) 5.13 (8.57) 5 100 Forstner et al. (1997) Tremp et al. (1993) 2-Methyl-4-nitrophenol 0.08 (0.05) 0.16 (0.15) 33 93 Forstner et al. (1997) Tremp et al. (1993)
4-Nitroguaiacol 0.08 (0.02) 0.66 (0.76) 11 86 Iinuma et al. (2007)
4-Nitrocatechol 1.60 (2.88) 0.09 (0.07) 95 93 Lin et al. (2015) Iinuma et al. (2007) 4-Methyl-5-nitrocatechol 1.61 (1.77) 0.08 (0.06) 95 86 Lin et al. (2015) Iinuma et al. (2007) 4-Hydroxy-3-nitrobenzyl alcohol 0.06 (0.06) ND 100 71 Hamilton et al. (2005)
5-Nitrosalicylic acid 0.14 (0.08) 0.04 (0.03) 78 100 Jang and Kamens (2001) Kitanovski et al. (2012)
2,5-Furandione 0.60 (0.58) NR NR 36 Forstner et al. (1997)
Dihydro-2,5-furandione 1.57 (1.34) 5.71 (3.33) 0.16 100 Forstner et al. (1997) 3-Methyl-2,5-furandione 0.44 (0.67) 7.19 (4.55) 0.03 79 Forstner et al. (1997) Dihydro-3-methyl-2,5-furandione 0.63 (0.97) 5.10 (3.99) 0.02 71 Hamilton et al. (2005) 2-Methylglyceric acid 0.68 (0.80) 0.12 (0.08) 85 100 Claeys et al. (2004b) 2-Methylthreitol 9.90 (12.16) 5.82 (3.89) 63 100 Claeys et al. (2004a) 2-Methylerythritol 12.07 (15.51) 7.20 (4.74) 63 100 Claeys et al. (2004a) cis-Pinonic acid 2.56 (3.11) 1.57 (1.80) 62 100 Yu et al. (1999)
Levoglucosan 109.68 (68.12) ND 100 100 Simoneit et al. (1999)
ND – not detected; NR – not reported (see the text)
www
.atmos-chem-ph
ys.net/17/2053/2017/
Atmos.
Chem.
Ph
ys.,
17,
2053–
2065
,
Figure 4. Selected ion chromatogram for a mixture of ni-tromonoaromatics standard (5 ng mL−1), where 4M-2NP is
4-methyl-2-nitrophenol, 4NP is 4-nitrophenol, 4NP-D4 is
4-nitrophenol-D4, 4M-3NP is 4-methyl-3-nitrophenol, 2M-4-NP is 2-methyl-4-nitrophenol, 4NG is 4-nitroguaiacol, NG is 5-nitroguaiacol, 4NC is 4-nitrocatechol, 4M-5NC is 4-methyl-5-nitrocatechol, 3NSA-D3is 3-nitrosalicylic acid-D3, 4H-3NB is 4-hydroxy-3-nitrobenzyl alcohol, and 5NSA is 5-nitrosalicylic acid.
3.4 Nitromonoaromatic compounds 3.4.1 Analytical method performance
While many techniques for quantifying nitrophenols in vari-ous sample matrices have been developed and were reviewed by Harrison et al. (2005), our goal was to quantify these com-pounds in parallel to other primary and secondary source tracers using GC-MS and single-filter extraction protocol. Using GC with a DB-5 column, a baseline separation was achieved for 10 nitromonoaromatic analytes as trimethylsi-lylated esters (Fig. 4), with highly symmetrical and narrow peak shapes. Mass spectrometry was used for identification by comparison of retention times and mass spectra, and quan-tification was done based on base peak area (Table S2). Nitromonoaromatic mass spectra (Table S2) included mass fragments with m/z[M-60]+ (from the loss of NO2 and
CH3), where M is molecular ion for the trimethylsilylated
es-ter. Save for nitroguiacols and 4-methyl-5-nitrocatechol, ni-tromonoaromatics’ mass spectra included a mass fragment of [M-15]+ (loss of CH3). The mass spectra for the
co-eluting peaks (Fig. 4) indicate that potential interferences for the 4NP-D4, 4NP, and 4M-2NP are not appreciably strong
(<1 %), and thus interferences are expected to be negligible. There is potential for 4M-3NP to interfere with detection of 4M-2NP, because the former shows a relatively strong signal form/z210 (at 38 % of the base peak signal) that is used to quantify the latter; however 4M-3NP was not detected in this study, so no interference is expected in this dataset.
The performance of the GC-MS method was evaluated with respect to linearity, detection and quantification limits of target analytes, and extraction efficiency (Table 1). The normalized response for the nitromonoaromatics was linear
Figure 5. Time series of ambient PM2.5 concentration of
lev-oglucosan, 4-nitrocatechol (4-NC), 4-methyl-5-nitrocatechol (4-M-5NC), and 5-nitrosalicylic acid (5NSA).
(R2≥0.996) from 10 to 5000 µg L−1with a constant inter-nal standard concentration of 10 000 µg L−1. This wide range of linearity indicates the suitability of this method to deter-mine nitromonoaromatics in different applications. The limit of detection ranges from 2.7 to 14.9 µg L−1 for the 10 ni-tromonoaromatic compounds. These method detection limits are higher than those obtained from liquid chromatography coupled with tandem mass spectrometry (0.1–0.25 µg L−1) (Kitanovski et al., 2012) but are sufficient to detect the inves-tigated species in ambient air. Filter extraction recoveries av-eraged 99.4±3.8 %, demonstrating high accuracy and preci-sion of the filter extraction with acetonitrile and reduction in volume under reduced pressure with rotary evaporation. For PUF extraction, very high recovery (>97 %) was achieved for most compounds (Table 1); however two nitrocatechols, 4NC and 4M-5NC, had significantly lower (<50 %) and much more variable (relative standard deviation (RSD): 34– 60 %) recoveries. Similarly low recoveries of 4NC and 4M-5NC have been reported previously (Hawthorne et al., 1989), which is attributed to the strong interactions of phenols with the polymeric chains of the PUF. Consequently, gas-phase measurements of 4NC and 4M-5NC are biased low and sub-ject to high uncertainty, such that their levels and gas–particle partitioning are not reported. Otherwise, the extraction and analysis method provides high accuracy and reliable preci-sion for nitromonoaromatics from filters and PUF.
3.4.2 Ambient concentration, gas–particle partitioning, and potential sources
Total concentrations of eight nitromonoaromatics ranged from 0.7 to 17 ng m−3in the particle phase and from 0.6 to 40 ng m−3 in the gas phase (Figs. 5 and S3). Average con-centrations andFpare summarized in Table 2, with dailyFp
shown in Fig. S2.
I. M. Al-Naiema and E. A. Stone: Evaluation of anthropogenic secondary organic aerosol tracers 2061
a biomass burning marker (levoglucosan) in this and prior studies. Nitrocatechols were the most abundant particle-phase species within this compound class, with average con-centrations (±standard deviation) of 1.6±2.9 ng m−3 and 1.6±1.8 ng m−3for 4NC and 4M-5NC, respectively. These two species have been previously associated with biomass burning in PM10, via their correlations with levoglucosan
(Iinuma et al., 2010; Kahnt et al., 2013). The strong cor-relation of these two species with levoglucosan extends to PM2.5 in Iowa City (Fig. 5) with very high correlations
with levoglucosan for 4NC (rs=0.90,p <0.001) and
4M-5NC (rs=0.85,p <0.001). Although nitrocatechol can be
formed from the toluene photooxidation (Lin et al., 2015), 4NC correlates weakly with DHOPA (rs≤0.2) lacking
sta-tistical significance (Table S3), suggesting that toluene pho-tooxidation is negligible in relation to biomass burning. Sim-ilarly, 5NSA (Fp=0.73) was highly correlated with
levoglu-cosan (rs=0.76,p=0.002) but moderately correlated with
DHOPA (rs=0.49,p=0.078), also suggesting its primary
origin to be biomass burning (Kitanovski et al., 2012; Zhang et al., 2013) rather than photooxidation (Jang and Kamens, 2001), in agreement with prior studies. Consequently, these three species are characteristic of biomass burning, rather than anthropogenic SOA.
Nitroguaiacol was detected in low concentrations relative to other nitromonoaromatics. The concentrations of 4NG in PM2.5 ranged from below the detection limit (BDL) to
0.11 ng m−3, with a frequency of detection of 86 % (Table 2). Similarly low concentrations were also reported elsewhere (Kitanovski et al., 2012). In the gas phase, 4NG was not detected on most of the days, except for 14–16 November, when gas concentrations reached 0.5–2.1 ng m−3 (Fig. S2). On 14 November, outdoor festivities, barbecues, and slow-moving traffic occurred near the sampling site. The possibil-ity of multiple sources and the low ambient concentrations suggest that this is not a suitable tracer for anthropogenic SOA.
4H-3NB was detected only in the particle phase (Fp=1),
with a frequency of 71 % and relatively low concentrations ranging from BDL to 0.2 ng m−3. 4H-3NB was identified as a low-abundance product of toluene photooxidation with hy-droxyl radicals (Hamilton et al., 2005; Fang et al., 2011). Other than toluene photooxidation, there are no other known emission sources for 4H-3NB. The specificity of 4H-3NB is supported by the lack of correlation with other biogenic or anthropogenic tracers (Table S3). Because it is detected only in the particle phase and is likely specific to toluene photoox-idation, it has potential to be a unique nitromonoaromatic tracer for anthropogenic VOC photooxidation. However, due to the small number of samples and the frequency of detec-tion for this tracer, further investigadetec-tion is recommended to evaluate its detectability in other environments and source specificity.
In addition, 4NP was consistently detected, with summed gas and particle concentration of 4NP ranging from 0.3
Figure 6. Time series of the measured furandiones
(2,5-furandione (FD), dihydro-2,5-(2,5-furandione (DFD), 3-methyl-2,5-furandione (MFD), and dihydro-3-methyl-2,5-3-methyl-2,5-furandione (DMFD)) detected in gas and particle phases, with the measured fraction in the particle phase (Fp). Furandiones were not detected in the gas phase on 4 November 2015. Due to poor extraction recoveries, the gas-phase concentration of FD was not reported.
to 7.3 ng m−3 and averaging 1.8±2.1 ng m−3. Likewise, two methyl-nitrophenol isomers (4M-2NP and 2M-4NP) av-eraged 0.3±1.6 ng m−3 and 5.3±8.5 ng m−3, respectively (Table 2 and Fig. S3). The higher concentration of 4M-2NP with the higher standard deviation is largely driven by the aforementioned local source influences on 14 November (32.5 ng m−3), shown in Fig. S2. These three nitromonoaro-matics showed substantial partitioning in the gas phase, with Fp≤0.33 (Table 2). The very high correlation of 4NP with
2M-4NP (rs=0.90, p <0.001) and with 4M-2NP (rs=
0.81,p <0.001) indicates a similar source of origin. These three compounds have previously been shown to be products from the photooxidation of the monoaromatic compounds in the presence of NOx (Forstner et al., 1997; Harrison et al., 2005; Sato et al., 2007) as well as components of vehicle emissions (Tremp et al., 1993). However, no significant cor-relations were observed between these tracers with hopane or DHOPA. Because of their lack of source specificity and the significant partitioning in the gas phase, these three nitrophe-nols are not recommended for use as tracers of anthropogenic SOA.
3.5 Furandiones
Ambient gas and particle concentrations for the sum of four furandiones and their Fp are shown in Fig. 6, with
indi-vidual species data in Fig. S4. The total furandiones con-centration detected in the particle phase ranged from 0.3 to 4.3 ng m−3 and averaged 1.6±1.1 ng m−3. These con-centrations were lower than those detected in our previous study (9.3±3.0 ng m−3)(Al-Naiema et al., 2017), which is likely due to the rainy and foggy weather in the autumn of 2015. In the presence of water, anhydrides undergo hydra-tion and ring opening to form the carboxylic acid deriva-tives. The relative rate of hydrolysis for 2,5-furandione (FD) and 3-methyl-2,5-furandione (MFD) are 6 times higher than dihydro-2,5-furandione (DFD) and
furandione (DMFD) (Trivedi and Culbertson, 1982). The highest stability against water hydrolysis might explain the higher concentration of DFD detected in this study compared to other furandiones. The sum of the gas-phase concentra-tion for the furandiones (DFD, MFD, and DMFD) averaged 18.0±10.7 ng m−3.
Furandiones were almost entirely in the gas phase (Fig. S4). The measured Fp values were 0.31 for DFD,
0.08 for MFD, and 0.05 for DMFD, while this value is not reported for FD, which showed poor extraction recovery (<10 %) from the PUF. LowFpvalues are expected for
fu-randiones due to their high vapour pressures (Table S1). The measuredFpvalues were substantially higher than those
pre-dicted by Pankow’s absorption model by 2 orders of mag-nitude (Tables 2 and S1). It is possible that higher-than-predictedFpvalues were driven by furandione adsorption on
the front filter or breakthrough from the PUF (Chuang et al., 1987).
Although no sources other than photooxidation of anthro-pogenic VOCs are known to influence the atmospheric con-centration of furandiones (Forstner et al., 1997; Hamilton et al., 2005), only a moderate correlation (rs=0.50,p=0.064)
was observed between the particle concentrations of furan-diones with DHOPA (Table S3). This may be due to the fact that DHOPA is a tracer specific to toluene, while furandiones can also form from other aromatic VOCs (Forstner et al., 1997). Overall, we conclude that furandiones hold a signif-icant importance to serve as indicators for atmospherically processed aromatic VOCs due to their source specificity; however the substantial partitioning toward the gas phase and their water sensitivity limit their application as SOA tracers.
4 Conclusions
This study evaluates, for the first time, the influence of the source specificity, ambient concentration, and gas–particle partitioning on the efficacy of the use of nitromonoaromat-ics, benzene dicarboxylic acids, furandiones, and DHOPA as tracers for SOA from anthropogenic VOCs. First and fore-most, DHOPA was detected consistently and only in particle phase and is specific to toluene photooxidation, making it a good tracer for toluene SOA despite its relatively low con-centrations. Second, PhA is the most abundant benzene di-carboxylic acid isomer and correlates highly with DHOPA. Similarly, 4M-PhA correlates highly with DHOPA. Although the measuredFpvalues suggest partitioning to the gas phase
for these two species, this is likely due to instrumental inter-ferences from the corresponding anhydrides. Their particle-phase concentration, nonetheless, are expected to be useful in tracing naphthalene-derived SOA. Third, 4H-3NB was de-tected only in the particle phase and found to be specific to toluene photooxidation at low levels of NOx. Because of their unique sources, detectability, and partitioning to-wards the particle phase, these species are expected to
pro-vide much needed insight to SOA from anthropogenic ori-gins, which can support a better understanding of the sources of atmospheric aerosols.
While the above-described species are proposed as trac-ers of anthropogenic SOA, structurally similar compounds are largely associated with primary sources and are not suit-able tracers of SOA. For example, t-PhA, 4NC, 4M-5NC, and 5NSA were highly correlated with levoglucosan and known to be biomass burning products. Other species such as furan-diones hold significant potential to be used as an indicator of processed aromatic VOCs in the atmosphere due to their source specificity but are not recommended as SOA tracers because of their substantial partitioning in the gas phase and water sensitivity. These findings underscore the importance of evaluating and quantifying potential SOA tracers on an in-dividual species level, as some species within a compound class may provide source specificity, while others do not. Given the limited time and geographic distribution for the samples analysed in this study, further investigation is needed to realize the value of these compounds as tracers of anthro-pogenic SOA more broadly.
5 Data availability
All ambient measurements used in this paper are available as Supplemental data.
The Supplement related to this article is available online at doi:10.5194/acp-17-2053-2017-supplement.
Competing interests. The authors declare that they have no conflict of interest.
Acknowledgements. This work was supported by the National Science Foundation (NSF) through AGS grant number 1405014. We thank Carter Madler and Candice Smith for their assistance in the laboratory preparations, and Md. Robiul Islam for help with sample collection.
Edited by: J. Roberts
Reviewed by: two anonymous referees
References
I. M. Al-Naiema and E. A. Stone: Evaluation of anthropogenic secondary organic aerosol tracers 2063
Al-Naiema, I. M., Roppo, H. M., and Stone, E. A.: Quantification of furandiones in ambient aerosol, Atmos. Environ., 153, 41–46, doi:10.1016/j.atmosenv.2017.01.002, 2017.
Bandow, H., Washida, N., and Akimoto, H.: Ring-cleavage reactions of aromatic-hydrocarbons studied by FTIR spec-troscopy: Photooxidation of toluene and benzene in the nox-air system, Bull. Chem. Soc. Jpn., 58, 2531–2540, doi:10.1246/bcsj.58.2531, 1985.
Chan, A. W. H., Kautzman, K. E., Chhabra, P. S., Surratt, J. D., Chan, M. N., Crounse, J. D., Kürten, A., Wennberg, P. O., Flagan, R. C., and Seinfeld, J. H.: Secondary organic aerosol formation from photooxidation of naphthalene and alkylnaph-thalenes: implications for oxidation of intermediate volatility or-ganic compounds (IVOCs), Atmos. Chem. Phys., 9, 3049–3060, doi:10.5194/acp-9-3049-2009, 2009.
Chuang, J. C., Hannan, S. W., and Wilson, N. K.: Field compari-son of polyurethane foam and XAD-2 resin for air sampling for polynuclear aromatic-hydrocarbons, Environ. Sci. Technol., 21, 798–804, doi:10.1021/es00162a011, 1987.
Claeys, M., Graham, B., Vas, G., Wang, W., Vermeylen, R., Pashyn-ska, V., Cafmeyer, J., Guyon, P., Andreae, M. O., Artaxo, P., and Maenhaut, W.: Formation of secondary organic aerosols through photooxidation of isoprene, Science, 303, 1173–1176, doi:10.1126/science.1092805, 2004a.
Claeys, M., Wang, W., Ion, A. C., Kourtchev, I., Gelencser, A., and Maenhaut, W.: Formation of secondary organic aerosols from isoprene and its gas-phase oxidation products through reac-tion with hydrogen peroxide, Atmos. Environ., 38, 4093–4098, doi:10.1016/j.atmosenv.2004.06.001, 2004b.
Dachs, J. and Eisenreich, S. J.: Adsorption onto aerosol soot carbon dominates gas-particle partitioning of polycyclic aro-matic hydrocarbons, Environ. Sci. Technol., 34, 3690–3697, doi:10.1021/es991201+, 2000.
Delgado-Saborit, J. M., Stark, C., and Harrison, R. M.: Use of a ver-satile high efficiency multiparallel denuder for the sampling of pahs in ambient air: Gas and particle phase concentrations, par-ticle size distribution and artifact formation, Environ. Sci. Tech-nol., 48, 499–507, doi:10.1021/es402937d, 2014.
Ding, X., Wang, X.-M., Gao, B., Fu, X.-X., He, Q.-F., Zhao, X.-Y., Yu, J.-Z., and Zheng, M.: Tracer-based estimation of secondary organic carbon in the Pearl River Delta, south China, J. Geophys. Res.-Atmos., 117, D05313, doi:10.1029/2011jd016596, 2012. Donahue, N. M., Robinson, A. L., Stanier, C. O., and Pandis,
S. N.: Coupled partitioning, dilution, and chemical aging of semivolatile organics, Environ. Sci. Technol., 40, 2635–2643, doi:10.1021/es052297c, 2006.
Dron, J., Abidi, E., El Haddad, I., Marchand, N., and Wortham, H.: Precursor ion scanning-mass spectrometry for the de-termination of nitro functional groups in atmospheric par-ticulate organic matter, Anal. Chim. Acta, 618, 184–195, doi:10.1016/j.aca.2008.04.057, 2008.
EPA: Estimation Programs Interface Suite™for Microsoft® Win-dows, v 4.11 or insert version used, United States Environmental Protection Agency, Washington, DC, USA, 2012.
Fang, W., Gong, L., Shan, X., Liu, F., Wang, Z., and Sheng, L.: Thermal desorption/tunable vacuum-ultraviolet time-of-flight photoionization aerosol mass spectrometry for investigating sec-ondary organic aerosols in chamber experiments, Anal. Chem., 83, 9024–9032, doi:10.1021/ac201838e, 2011.
Forstner, H. J. L., Flagan, R. C., and Seinfeld, J. H.: Secondary or-ganic aerosol from the photooxidation of aromatic hydrocarbons: Molecular composition, Environ. Sci. Technol., 31, 1345–1358, doi:10.1021/es9605376, 1997.
Fraser, M. P., Cass, G. R., and Simoneit, B. R. T.: Air quality model evaluation data for organics. 6. C-3-C-24 organic acids, Environ. Sci. Technol., 37, 446–453, doi:10.1021/es0209262, 2003. Fu, T. M., Jacob, D. J., Wittrock, F., Burrows, J. P.,
Vrekous-sis, M., and Henze, D. K.: Global budgets of atmospheric gly-oxal and methylglygly-oxal, and implications for formation of sec-ondary organic aerosols, J. Geophys. Res.-Atmos., 113, D15303, doi:10.1029/2007jd009505, 2008.
Hallquist, M., Wenger, J. C., Baltensperger, U., Rudich, Y., Simp-son, D., Claeys, M., Dommen, J., Donahue, N. M., George, C., Goldstein, A. H., Hamilton, J. F., Herrmann, H., Hoff-mann, T., Iinuma, Y., Jang, M., Jenkin, M. E., Jimenez, J. L., Kiendler-Scharr, A., Maenhaut, W., McFiggans, G., Mentel, Th. F., Monod, A., Prévôt, A. S. H., Seinfeld, J. H., Surratt, J. D., Szmigielski, R., and Wildt, J.: The formation, properties and im-pact of secondary organic aerosol: current and emerging issues, Atmos. Chem. Phys., 9, 5155–5236, doi:10.5194/acp-9-5155-2009, 2009.
Hamilton, J. F., Lewis, A. C., Bloss, C., Wagner, V., Henderson, A. P., Golding, B. T., Wirtz, K., Martin-Reviejo, M., and Pilling, M. J.: Measurements of photo-oxidation products from the reaction of a series of alkyl-benzenes with hydroxyl radicals during EX-ACT using comprehensive gas chromatography, Atmos. Chem. Phys., 3, 1999–2014, doi:10.5194/acp-3-1999-2003, 2003. Hamilton, J. F., Webb, P. J., Lewis, A. C., and Reviejo,
M. M.: Quantifying small molecules in secondary or-ganic aerosol formed during the photo-oxidation of toluene with hydroxyl radicals, Atmos. Environ., 39, 7263–7275, doi:10.1016/j.atmosenv.2005.09.006, 2005.
Harrison, M. A. J., Barra, S., Borghesi, D., Vione, D., Ar-sene, C., and Olariu, R. L.: Nitrated phenols in the
atmosphere: a review, Atmos. Environ., 39, 231–248,
doi:10.1016/j.atmosenv.2004.09.044, 2005.
Hawthorne, S. B., Krieger, M. S., Miller, D. J., and Mathiason, M. B.: Collection and quantitation of methoxylated phenol tracers for atmospheric-pollution from residential wood stoves, Environ. Sci. Technol., 23, 470–475, doi:10.1021/es00181a013, 1989. He, J. and Balasubramanian, R.: A study of gas/particle partitioning
of SVOCs in the tropical atmosphere of Southeast Asia, Atmos. Environ., 43, 4375–4383, doi:10.1016/j.atmosenv.2009.03.055, 2009.
Heald, C. L., Jacob, D. J., Park, R. J., Russell, L. M., Huebert, B. J., Seinfeld, J. H., Liao, H., and Weber, R. J.: A large organic aerosol source in the free troposphere missing from current models, Geo-phys. Res. Lett., 32, L18809, doi:10.1029/2005gl023831, 2005. Henze, D. K., Seinfeld, J. H., Ng, N. L., Kroll, J. H., Fu, T.-M.,
Jacob, D. J., and Heald, C. L.: Global modeling of secondary organic aerosol formation from aromatic hydrocarbons: high-vs. low-yield pathways, Atmos. Chem. Phys., 8, 2405–2420, doi:10.5194/acp-8-2405-2008, 2008.
Hu, D., Bian, Q., Li, T. W. Y., Lau, A. K. H., and Yu, J. Z.: Con-tributions of isoprene, monoterpenes, beta-caryophyllene, and toluene to secondary organic aerosols in Hong Kong during the summer of 2006, J. Geophys. Res.-Atmos., 113, D22206, doi:10.1029/2008jd010437, 2008.
Iinuma, Y., Brueggemann, E., Gnauk, T., Mueller, K., Andreae, M. O., Helas, G., Parmar, R., and Herrmann, H.: Source char-acterization of biomass burning particles: The combustion of selected European conifers, African hardwood, savanna grass, and German and Indonesian peat, J. Geophys. Res.-Atmos., 112, D08209, doi:10.1029/2006jd007120, 2007.
Iinuma, Y., Boege, O., Graefe, R., and Herrmann, H.: Methyl-nitrocatechols: Atmospheric tracer compounds for biomass burn-ing secondary organic aerosols, Environ. Sci. Technol., 44, 8453–8459, doi:10.1021/es102938a, 2010.
Irei, S., Rudolph, J., Huang, L., Auld, J., Collin, F., and Hastie, D.: Laboratory studies of carbon kinetic isotope effects on the pro-duction mechanism of particulate phenolic compounds formed by toluene photooxidation: A tool to constrain reaction pathways, J. Phys. Chem. A, 119, 5–13, doi:10.1021/jp5104609, 2015. Jang, M. S. and Kamens, R. M.: Characterization of secondary
aerosol from the photooxidation of toluene in the presence of NOx and 1-propene, Environ. Sci. Technol., 35, 3626–3639,
doi:10.1021/es010676+, 2001.
Jayarathne, T., Rathnayake, C. M., and Stone, E. A.: Lo-cal source impacts on primary and secondary aerosols in the Midwestern United States, Atmos. Environ., 130, 74–83, doi:10.1016/j.atmosenv.2015.09.058, 2016.
Kahnt, A., Behrouzi, S., Vermeylen, R., Shalamzari, M. S., Ver-cauteren, J., Roekens, E., Claeys, M., and Maenhaut, W.: One-year study of nitro-organic compounds and their relation to wood burning in PM10aerosol from a rural site in Belgium, Atmos. En-viron., 81, 561–568, doi:10.1016/j.atmosenv.2013.09.041, 2013. Kautzman, K. E., Surratt, J. D., Chan, M. N., Chan, A. W. H., Hersey, S. P., Chhabra, P. S., Dalleska, N. F., Wennberg, P. O., Flagan, R. C., and Seinfeld, J. H.: Chemical Com-position of Gas- and Aerosol-Phase Products from the Pho-tooxidation of Naphthalene, J. Phys. Chem. A, 114, 913–934, doi:10.1021/jp908530s, 2010.
Kawamura, K. and Kaplan, I. R.: Motor exhaust emissions as a pri-mary source for dicarboxylic-acids in los-angeles ambient air, Environ. Sci. Technol., 21, 105–110, doi:10.1021/es00155a014, 1987.
Kim, Y.-H. and Kim, K.-H.: A simple methodological valida-tion of the gas/particle fracvalida-tionavalida-tion of polycyclic aromatic hydrocarbons in ambient air, Scientific Reports, 5, 11679, doi:10.1038/srep11679, 2015.
Kitanovski, Z., Grgic, I., Vermeylen, R., Claeys, M., and Maenhaut, W.: Liquid chromatography tandem mass spectrometry method for characterization of monoaromatic nitro-compounds in at-mospheric particulate matter, J. Chromatogr. A, 1268, 35–43, doi:10.1016/j.chroma.2012.10.021, 2012.
Kleindienst, T. E., Conver, T. S., McIver, C. D., and Ed-ney, E. O.: Determination of secondary organic aerosol prod-ucts from the photooxidation of toluene and their impli-cations in ambient PM2.5, J. Atmos. Chem., 47, 79–100, doi:10.1023/b:joch.0000012305.94498.28, 2004.
Kleindienst, T. E., Jaoui, M., Lewandowski, M., Offenberg, J. H., Lewis, C. W., Bhave, P. V., and Edney, E. O.: Estimates of the contributions of biogenic and anthropogenic hydrocarbons to secondary organic aerosol at a southeastern US location, Atmos. Environ., 41, 8288–8300, doi:10.1016/j.atmosenv.2007.06.045, 2007.
Kleindienst, T. E., Jaoui, M., Lewandowski, M., Offenberg, J. H., and Docherty, K. S.: The formation of SOA and chemical tracer compounds from the photooxidation of naphthalene and its methyl analogs in the presence and absence of nitrogen oxides, Atmos. Chem. Phys., 12, 8711–8726, doi:10.5194/acp-12-8711-2012, 2012.
Koehler, C. A., Fillo, J. D., Ries, K. A., Sanchez, J. T., and De Haan, D. O.: Formation of secondary organic aerosol by reactive con-densation of furandiones, aldehydes, and water vapor onto inor-ganic aerosol seed particles, Environ. Sci. Technol., 38, 5064– 5072, doi:10.1021/es034672b, 2004.
Kroll, J. H. and Seinfeld, J. H.: Chemistry of secondary ganic aerosol: Formation and evolution of low-volatility or-ganics in the atmosphere, Atmos. Environ., 42, 3593–3624, doi:10.1016/j.atmosenv.2008.01.003, 2008.
Lewandowski, M., Jaoui, M., Offenberg, J. H., Kleindienst, T. E., Edney, E. O., Sheesley, R. J., and Schauer, J. J.: Pri-mary and secondary contributions to ambient PM in the mid-western United States, Environ. Sci. Technol., 42, 3303–3309, doi:10.1021/es0720412, 2008.
Lin, P., Liu, J., Shilling, J. E., Kathmann, S. M., Laskin, J., and Laskin, A.: Molecular characterization of brown carbon (BrC) chromophores in secondary organic aerosol generated from photo-oxidation of toluene, Phys. Chem. Chem. Phys., 17, 23312–23325, doi:10.1039/c5cp02563j, 2015.
Ma, W.-L., Sun, D.-Z., Shen, W.-G., Yang, M., Qi, H., Liu, L.-Y., Shen, J.-M., and Li, Y.-F.: Atmospheric concentrations, sources and gas-particle partitioning of PAHs in Beijing after the 29th Olympic Games, Environ. Pollut., 159, 1794–1801, doi:10.1016/j.envpol.2011.03.025, 2011.
Matsui, H., Koike, M., Takegawa, N., Kondo, Y., Griffin, R. J., Miyazaki, Y., Yokouchi, Y., and Ohara, T.: Secondary organic aerosol formation in urban air: Temporal variations and possible contributions from unidentified hydrocarbons, J. Geophys. Res.-Atmos., 114, D04201, doi:10.1029/2008jd010164, 2009. Mirivel, G., Riffault, V., and Galloo, J.-C.: Analysis of phthalic,
isophthalic and long-chain (C-4-C-12) dicarboxylic acids in at-mospheric aerosols by UPLC/ESI/ToF-MS, Analytical Methods, 3, 1172–1179, doi:10.1039/c0ay00677g, 2011.
Mkoma, S. L. and Kawamura, K.: Molecular composition of di-carboxylic acids, ketodi-carboxylic acids, a-dicarbonyls and fatty acids in atmospheric aerosols from Tanzania, East Africa dur-ing wet and dry seasons, Atmos. Chem. Phys., 13, 2235–2251, doi:10.5194/acp-13-2235-2013, 2013.
Mukaka, M. M.: Statistics Corner: A guide to appropriate use of Correlation coefficient in medical research, Malawi Med. J., 24, 69–71, 2012.
Ng, N. L., Kroll, J. H., Chan, A. W. H., Chhabra, P. S., Flagan, R. C., and Seinfeld, J. H.: Secondary organic aerosol formation from m-xylene, toluene, and benzene, Atmos. Chem. Phys., 7, 3909–3922, doi:10.5194/acp-7-3909-2007, 2007.
Oanh, N. T. K., Reutergardh, L. B., and Dung, N. T.: Emission of polycyclic aromatic hydrocarbons and particulate matter from domestic combustion of selected fuels, Environ. Sci. Technol., 33, 2703–2709, 1999.
I. M. Al-Naiema and E. A. Stone: Evaluation of anthropogenic secondary organic aerosol tracers 2065
Pankow, J. F.: An absorption-model of the gas aerosol partition-ing involved in the formation of secondary organic aerosol, At-mos. Environ., 28, 189–193, doi:10.1016/1352-2310(94)90094-9, 1994.
Pankow, J. F., Storey, J. M. E., and Yamasaki, H.: Effects of relative-humidity on gas-particle partitioning of semivolatile organic-compounds to urban particulate matter, Environ. Sci. Technol., 27, 2220–2226, doi:10.1021/es00047a032, 1993.
Peng, J., Li, M., Zhang, P., Gong, S., Zhong, M., Wu, M., Zheng, M., Chen, C., Wang, H., and Lou, S.: Investigation of the sources and seasonal variations of secondary organic aerosols in PM2.5 in Shanghai with organic tracers, Atmos. Environ., 79, 614–622, doi:10.1016/j.atmosenv.2013.07.022, 2013.
Possanzini, M., Di Palo, V., Gigliucci, P., Concetta, M., Sciano, T., and Cecinato, A.: Determination of phase-distributed PAH in Rome ambient air by denuder/GC-MS method, Atmos. Environ., 38, 1727–1734, doi:10.1016/j.atmosenv.2003.12.024, 2004. Robinson, A. L., Donahue, N. M., Shrivastava, M. K., Weitkamp,
E. A., Sage, A. M., Grieshop, A. P., Lane, T. E., Pierce, J. R., and Pandis, S. N.: Rethinking organic aerosols: Semivolatile emissions and photochemical aging, Science, 315, 1259–1262, doi:10.1126/science.1133061, 2007.
Rogge, W. F., Ondov, J. M., Bernardo-Bricker, A., and Sevi-moglu, O.: Baltimore PM2.5 Supersite: highly time-resolved organic compounds-sampling duration and phase distribution-implications for health effects studies, Anal. Bioanal. Chem., 401, 3069–3082, doi:10.1007/s00216-011-5454-9, 2011. Sato, K., Hatakeyama, S., and Imamura, T.: Secondary organic
aerosol formation during the photooxidation of toluene: NOx
dependence of chemical composition, J. Phys. Chem. A, 111, 9796–9808, doi:10.1021/jp071419f, 2007.
Sato, K., Takami, A., Kato, Y., Seta, T., Fujitani, Y., Hikida, T., Shi-mono, A., and Imamura, T.: AMS and LC/MS analyses of SOA from the photooxidation of benzene and 1,3,5-trimethylbenzene in the presence of NOx: effects of chemical structure on SOA
aging, Atmos. Chem. Phys., 12, 4667–4682, doi:10.5194/acp-12-4667-2012, 2012.
Schauer, J. J., Rogge, W. F., Hildemann, L. M., Mazurek, M. A., Cass, G. R., and Simoneit, B. R. T.: Source apportion-ment of airborne particulate matter using organic compounds as tracers, Atmos. Environ., 30, 3837–3855, doi:10.1016/1352-2310(96)00085-4, 1996.
Schauer, J. J., Kleeman, M. J., Cass, G. R., and Simoneit, B. R. T.: Measurement of emissions from air pollution sources. 2. C-1 through C-30 organic compounds from medium duty diesel trucks, Environ. Sci. Technol., 33, 1578–1587, doi:10.1021/es980081n, 1999.
Schauer, J. J., Mader, B. T., Deminter, J. T., Heidemann, G., Bae, M. S., Seinfeld, J. H., Flagan, R. C., Cary, R. A., Smith, D., Huebert, B. J., Bertram, T., Howell, S., Kline, J. T., Quinn, P., Bates, T., Turpin, B., Lim, H. J., Yu, J. Z., Yang, H., and Keywood, M. D.: ACE-Asia intercomparison of a thermal-optical method for the determination of particle-phase organic and elemental carbon, Environ. Sci. Technol., 37, 993–1001, doi:10.1021/es020622f, 2003.
Shen, R.-Q., Ding, X., He, Q.-F., Cong, Z.-Y., Yu, Q.-Q., and Wang, X.-M.: Seasonal variation of secondary organic aerosol tracers in Central Tibetan Plateau, Atmos. Chem. Phys., 15, 8781–8793, doi:10.5194/acp-15-8781-2015, 2015.
Simoneit, B. R. T., Schauer, J. J., Nolte, C. G., Oros, D. R., Elias, V. O., Fraser, M. P., Rogge, W. F., and Cass, G. R.: Levoglu-cosan, a tracer for cellulose in biomass burning and atmospheric particles, Atmos. Environ., 33, 173–182, doi:10.1016/s1352-2310(98)00145-9, 1999.
Terzi, E. and Samara, C.: Gas-particle partitioning of polycyclic aromatic hydrocarbons in urban, adjacent coastal, and continen-tal background sites of western Greece, Environ. Sci. Technol., 38, 4973–4978, doi:10.1021/es040042d, 2004.
Tremp, J., Mattrel, P., Fingler, S., and Giger, W.: Phenols and nitro-phenols as tropospheric pollutants – emissions from automobile exhausts and phase-transfer in the atmosphere, Water Air Soil Poll., 68, 113-123, doi:10.1007/bf00479396, 1993.
Trivedi, B. C., and Culbertson, B. M.: Maleic Anhydride, Springer Science+Business Media, New York, 1982.
Volkamer, R., Jimenez, J. L., San Martini, F., Dzepina, K., Zhang, Q., Salcedo, D., Molina, L. T., Worsnop, D. R., and Molina, M. J.: Secondary organic aerosol formation from anthropogenic air pollution: Rapid and higher than expected, Geophys. Res. Lett., 33, L17811, doi:10.1029/2006gl026899, 2006.
Wang, W., Simonich, S. L. M., Wang, W., Giri, B., Zhao, J., Xue, M., Cao, J., Lu, X., and Tao, S.: Atmospheric polycyclic aromatic hydrocarbon concentrations and gas/particle partitioning at back-ground, rural village and urban sites in the North China Plain, Atmos. Res., 99, 197–206, doi:10.1016/j.atmosres.2010.10.002, 2011.
Williams, B. J., Goldstein, A. H., Kreisberg, N. M., and Hering, S. V.: In situ measurements of gas/particle-phase transitions for atmospheric semivolatile organic compounds, Proc. Natl. Acad. Sci. USA, 107, 6676–6681, doi:10.1073/pnas.0911858107, 2010.
Yamasaki, H., Kuwata, K., and Miyamoto, H.: Effects of
ambient-temperature on aspects of airborne polycyclic
aromatic-hydrocarbons, Environ. Sci. Technol., 16, 189–194, doi:10.1021/es00098a003, 1982.
Yatavelli, R. L. N., Stark, H., Thompson, S. L., Kimmel, J. R., Cubi-son, M. J., Day, D. A., Campuzano-Jost, P., Palm, B. B., Hodzic, A., Thornton, J. A., Jayne, J. T., Worsnop, D. R., and Jimenez, J. L.: Semicontinuous measurements of gas-particle partitioning of organic acids in a ponderosa pine forest using a MOVI-HRToF-CIMS, Atmos. Chem. Phys., 14, 1527–1546, doi:10.5194/acp-14-1527-2014, 2014.
Yu, J. Z., Cocker, D. R., Griffin, R. J., Flagan, R. C., and Se-infeld, J. H.: Gas-phase ozone oxidation of monoterpenes: Gaseous and particulate products, J. Atmos. Chem., 34, 207–258, doi:10.1023/a:1006254930583, 1999.
Zhang, X., Lin, Y.-H., Surratt, J. D., and Weber, R. J.: Sources, com-position and absorption angstrom exponent of light-absorbing or-ganic components in aerosol extracts from the los angeles basin, Environ. Sci. Technol., 47, 3685–3693, doi:10.1021/es305047b, 2013.