www.atmos-chem-phys.net/9/2973/2009/ © Author(s) 2009. This work is distributed under the Creative Commons Attribution 3.0 License.
Chemistry
and Physics
High formation of secondary organic aerosol from the
photo-oxidation of toluene
L. Hildebrandt1, N. M. Donahue1, and S. N. Pandis1,2
1Center for Atmospheric Particle Studies, Carnegie Mellon University, 5000 Forbes Ave., Pittsburgh, PA 15213, USA 2Institute of Chemical Engineering and High Temperature Chemical Processes (ICE-HT), Foundation of Research and
Technology (FORTH), Patra, Greece
Received: 31 October 2008 – Published in Atmos. Chem. Phys. Discuss.: 9 January 2009 Revised: 6 April 2009 – Accepted: 29 April 2009 – Published: 7 May 2009
Abstract. Toluene and other aromatics have long been viewed as the dominant anthropogenic secondary organic aerosol (SOA) precursors, but the SOA mass yields from toluene reported in previous studies vary widely. Experi-ments conducted in the Carnegie Mellon University envi-ronmental chamber to study SOA formation from the photo-oxidation of toluene show significantly larger SOA produc-tion than parameterizaproduc-tions employed in current air-quality models. Aerosol mass yields depend on experimental con-ditions: yields are higher under higher UV intensity, under low-NOx conditions and at lower temperatures. The extent
of oxidation of the aerosol also varies with experimental con-ditions, consistent with ongoing, progressive photochemical aging of the toluene SOA. Measurements using a thermode-nuder system suggest that the aerosol formed under high- and low-NOx conditions is semi-volatile. These results suggest
that SOA formation from toluene depends strongly on ambi-ent conditions. An approximate parameterization is proposed for use in air-quality models until a more thorough treatment accounting for the dynamic nature of this system becomes available.
1 Introduction
Fine particles affect climate (IPCC, 2007) and human health (Dockery et al., 1993; Davidson et al., 2005). The organic component of aerosol particles comprises about one half of the fine-particle mass on average (Kanakidou et al., 2005; Zhang et al., 2007). Recent work has shown that most of the organic-aerosol mass is oxygenated organic aerosol (OOA)
Correspondence to:S. Pandis (spyros@andrew.cmu.edu)
(Volkamer et al., 2006). Most of the OOA is expected to be secondary organic aerosol (SOA), which is produced when volatile organic compounds (VOCs) or semi-volatile organic compounds (SVOCs) are oxidized in the gas phase, form-ing less volatile products that can then partition to the parti-cle phase. Thus, SOA is expected to comprise a significant fraction of the atmospheric fine-particle mass. Air-quality models currently under-predict the concentrations of organic aerosol in the atmosphere, especially in the summer and in urban areas (Volkamer et al., 2006; Goldstein and Galbally, 2007; Karydis et al., 2007), suggesting that we do not under-stand anthropogenic SOA formation well.
Toluene (methylbenzene) and other light aromatics are thought to be the dominant anthropogenic SOA precursors (Pandis et al., 1992; Koo et al., 2003; Vutukuru et al., 2006). The emissions of toluene in the US are approximately 1 Tg C yr−1, and seasonal variations are small (LADCO,
1999). In addition to being an important SOA precursor it-self, toluene serves as a model system to study the formation of SOA from other aromatic VOCs.
et al. (2007) reported a yield of 11% at 23µg m−3 under
high-NOx conditions ([Toluene]0/[NO]0∼3.5 (ppbC/ppb),
[Toluene]0/[NO]0∼1.5 (ppbC/ppb)) and an approximately
constant yield of 30% under low-NOx conditions. Ng et
al. (2007) suggested that the constant yield with aerosol loading under low-NOx conditions implies that the SOA
formed can be represented as a single product with very low volatility. Takekawa et al. (2003) found a yield of 20% at 283 K and 97µg m−3 ([Toluene]0/[NO]0∼240 (ppbC/ppb),
[Toluene]0/[NO]0∼80 (ppbC/ppb)) and a yield about
a factor of 2 smaller at 303 K and 57µg m−3 ([Toluene]0/[NO]0∼208 (ppbC/ppb), [Toluene]0/ [NO]0∼
69 (ppbC/ppb)).
Differences in experimental conditions may cause these differences in measured aerosol yields. For example, Hur-ley et al. (2001) did not use seed aerosol in their exper-iments, which can affect the losses of semi-volatile com-pounds to the chamber walls (Kroll et al., 2007; Pathak et al., 2007). Forstner (1996), Stern (1988), Kleindienst et al. (1999), Takekawa et al. (2003) and Hurley et al. (2001) conducted “classical” photo-oxidation experiments, starting with a toluene/NOxmixture plus propylene or CH3ONO,
ex-pecting that propylene would enhance photochemistry by in-creasing OH concentrations. Song et al. (2007) have shown that propylene does not enhance the concentration of OH in chamber experiments – it actually reduces them. More recent studies of toluene photo-oxidation have used direct OH sources: HOOH in low-NOx experiments and HONO
in high-NOxexperiments (e.g. Ng et al., 2007). Takekawa et
al. (2003) did not add OH enhancers in their high-NOx
ex-periments. Several studies have suggested that the SOA from toluene is formed from further oxidation of initial toluene photo-oxidation products (Hurley et al., 2001; Takekawa et al., 2003), implying that several oxidation steps are required before aerosol can be formed. The presence of multiple gen-erations of oxidation products could well explain the vari-ability among various experiments. For example, using a more direct OH source such as HOOH or HONO may result in higher OH concentrations and therefore faster oxidation, leading to more functionalized products with lower volatil-ity, resulting in higher aerosol mass yields.
Temperature is also an important factor in determining aerosol yields (Takekawa et al., 2003). Stern (1988) and Forstner (1996) conducted their experiments in an outdoor chamber without temperature control, resulting in average temperatures as high as 49◦C. These high temperatures are
expected to result in lower aerosol mass yields. In addition, none of the studies mentioned above accounted for the loss of condensable vapors to the walls of the chambers. Over the course of each chamber experiment, organic mass builds up on the walls of the chamber by the deposition of parti-cles. Organic vapors can then condense on this organic wall mass. This effect is expected to increase over the course of an experiment, so it might be particularly significant for long experiments with slowly reacting VOCs like toluene. The
amount of liquid water in the aerosol seed also appears to affect the aerosol mass yield, but the magnitude of this ef-fect remains uncertain (Edney et al., 2000; Hennigan et al., 2008; Volkamer et al., 2009). The organic aerosol yields do not seem to be affected by acidities typically found in the atmosphere (Ng et al., 2007).
This work addresses a number of questions raised by the previous studies. Toluene photo-oxidation experiments are performed under different conditions in order to:
1. Investigate the discrepancy between the low yields mea-sured in earlier studies (less than 3% for ambient tions) and the higher values (10–30% for similar condi-tions) reported more recently.
2. Propose and apply a method to correct aerosol mass yields for the loss of organic vapors to the walls of the chamber.
3. Study the dependence of aerosol mass yields on UV in-tensity, temperature and the level of NOx.
4. Directly measure the volatility of the organic aerosol us-ing a thermodenuder system.
5. Characterize organic aerosol formed under the different experimental conditions for extent of oxidation. 6. Suggest new parameters to be used in air-quality models
for aerosol yields from toluene and other small aromatic compounds.
2 Materials and methods
2.1 Experimental setup
Batch experiments were conducted in the environmental chamber of Carnegie Mellon’s Center for Atmospheric Particle Studies (CAPS). The chamber is a 12 m3 Teflon bag (Welch Fluorocarbon) suspended inside a temperature-controlled room. Before each experiment, the bag was cleaned with dry, clean air created by passing compressed air through high-efficiency particulate air (HEPA) filters and activated-carbon filters to remove particles and organic va-pors, and through silica gel to remove moisture. For each experiment, hydrogen peroxide (H2O2)was then introduced
into the chamber by bubbling clean, heated air through a 50/50 solution of H2O2 in water (Sigma Aldrich).
Intro-ducing H2O2into the chamber also introduced water vapor,
resulting in modest variability in relative humidity between experiments (Table 1). Ammonium sulfate ((NH4)2SO4,
Sigma Aldrich, 99.99%) seed particles were created using a constant-output atomizer (TSI, model 3075) and were passed through a diffusion dryer and a neutralizer into the chamber. Nitric oxide (NO) was added to the chamber for high-NOx
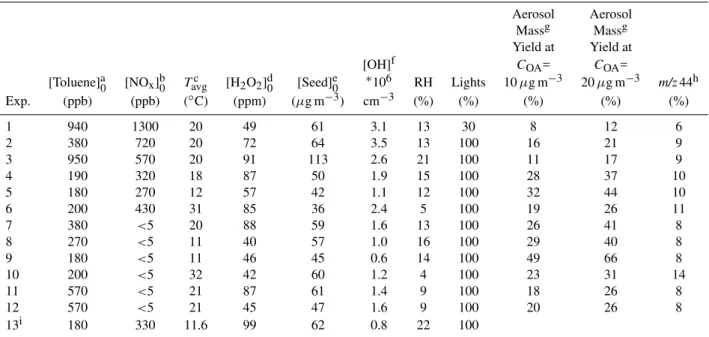
Table 1.Experimental conditions and summary of results.
Aerosol Aerosol
Massg Massg
Yield at Yield at
[OH]f COA= COA=
[Toluene]a0 [NOx]b0 Tavgc [H2O2]d0 [Seed]e0 ∗
106 RH Lights 10µg m−3 20µg m−3 m/z44h
Exp. (ppb) (ppb) (◦C) (ppm) (µg m−3) cm−3 (%) (%) (%) (%) (%)
1 940 1300 20 49 61 3.1 13 30 8 12 6
2 380 720 20 72 64 3.5 13 100 16 21 9
3 950 570 20 91 113 2.6 21 100 11 17 9
4 190 320 18 87 50 1.9 15 100 28 37 10
5 180 270 12 57 42 1.1 12 100 32 44 10
6 200 430 31 85 36 2.4 5 100 19 26 11
7 380 <5 20 88 59 1.6 13 100 26 41 8
8 270 <5 11 40 57 1.0 16 100 29 40 8
9 180 <5 11 46 45 0.6 14 100 49 66 8
10 200 <5 32 42 60 1.2 4 100 23 31 14
11 570 <5 21 87 61 1.4 9 100 18 26 8
12 570 <5 21 45 47 1.6 9 100 20 26 8
13i 180 330 11.6 99 62 0.8 22 100
aSubscript 0 denotes initial condition (immediately before UV lights are turned on). bNO
xwas initially present as NO, but was converted to NO2within minutes after the UV lights were turned on.
cTemperature averaged for the duration of the experiment. Temperature fluctuations during the experiment are less than 2◦
C.
dH
2O2concentrations are not measured directly but are approximated from H2O2interference in a UV photometric ozone monitor. eInitial seed concentrations from SMPS measurements, using density of 1.77 g cm−3(dry (NH
4)2SO4).
fOH concentrations were not measured directly but are approximated from the first-order decay of toluene observed in the PTR-MS. gMass concentration and aerosol mass yield of SOA calculated from the AMS for case 2.
hCalculated from relative organic spectra from the AMS. Reported values are averaged for hours 1–3 of each photo-oxidation experiment.
The variation ofm/z44 during this time period was minimal in all experiments.
iExperiment was not used for yield calculations due to poor AMS calibration that day. The calibration does not affectfsus, used for volatility
calculations.
of 0.01% NO in N2 (Valley National Gas). NO2 was
pro-duced via the NO+O3reaction and was not directly added to
the chamber. Toluene (Sigma-Aldrich, 99%) was introduced to the chamber via a septum injector in which clean air was passed over the injected liquid toluene to vaporize and trans-fer it to the chamber. The walls of the temperature-controlled room are lined with UV lights (General Electric model 10526 black). After the particles and gases were injected into the chamber and allowed to mix, the UV lights were turned on to initiate photo-oxidation reactions and SOA formation.
Particle number and volume inside of the chamber were measured using a scanning mobility particle sizer (SMPS, TSI classifier model 3080, CPC model 3071 or 3010). In or-der to convert the SMPS volume measurements to mass con-centrations, an organic mass density of 1.4 g cm−3was used
based on literature data (Ng et al., 2007). Particle mass was also measured directly by a Quadrupole Aerosol Mass Spec-trometer (Q-AMS, Aerodyne Research, Inc.). The Q-AMS alternated between operating in mass spectrum (MS) scan-ning mode and in particle time-of-flight (PToF) mode every fifteen seconds (Jayne et al., 2000; Jimenez et al., 2003). The sample averaging time was set at five minutes, and the
Concentrations of toluene were monitored using a proton-transfer reaction mass spectrometer (PTR-MS, Ionicon Ana-lytik GmbH). PTR-MS measurements of toluene were cor-rected for ion-source intensity and humidity as suggested by de Gouw et al. (2003) using their measured, compound-specific parameter for toluene. Toluene measurements were calibrated in two different ways: 1) Offline, by compari-son to toluene concentrations measured via gas chromatogra-phy with a flame ionization detector (GC-FID, Perkin-Elmer AutoSystem XL; J&W Scientific DB-624 capillary column, 30 m×0.530 mm) after preconcentration (Entech 7100A); and, 2) Online, by comparison to the toluene volume injected into the chamber. Online calibrations were preformed for each experiment; offline calibrations were performed period-ically, and they agreed well with online calibrations. A sen-sitivity factor (ppb toluene/normalized counts measured by the PTR-MS) was thus calculated and applied to all experi-ments. The first-order decay of toluene was used to estimate hydroxyl radical concentrations.
Ozone and NOx concentrations were measured by
gas-phase analyzers (Monitor Labs model 8410, API model 200A). Temperature and relative humidity were mea-sured using thermistors and a commercial humidity sensor (Vaisala). Initial hydrogen peroxide concentrations were es-timated from interference in a UV photometric ozone ana-lyzer (Dasibi model 1008 PC). Table 1 summarizes the ex-perimental conditions of the experiments presented here.
The volatility of SOA produced from the photo-oxidation of toluene was analyzed using the thermodenuder system de-scribed by An et al. (2007). The SOA generated in the cham-ber passes alternatively through the thermodenuder, heated to a predefined temperature, or a bypass line. The aerosol flow direction is controlled by two 3-way valves. Activated charcoal is used in the cooling stage to adsorb the organic vapors and thereby avoid recondensation. Particles are sent through the same sampling line to an SMPS for measurement of the online particle size distribution and to the Q-AMS for real-time measurement of the aerosol chemical composition. The volatility is then determined by comparing the resid-ual aerosol after the thermodenuder to the aerosol that was passed through the bypass.
2.2 Quantifying SOA production
The aerosol mass yield,Y, is defined as the ratio of the con-centration of aerosol formed, divided by the mass of VOC reacted:
Y = COA
1Ctol
(1) whereCOAis the total mass concentration of organic aerosol
in the system and1Ctol is the change in the mass
concen-tration of toluene. The objective of an experiment is thus to measure the above two quantities and therefore the aerosol mass yield.
The SOA is assumed to be in equilibrium, and the parti-tioning of organic compounds between the gas and particle phase can be characterized by an effective saturation mass concentrationCi∗. The fraction of a given compoundiin the condensed (particle) phase is given by Donahue et al. (2006):
ξi =
1+ C
∗ i
COA
−1
withCOA=
X
i
Ciξi (2)
whereCi is the concentration of compoundiin the particle
phase.
2.2.1 Calculating the total SOA concentration in the chamber
Observations of the suspended particle mass concentration must be corrected for losses to the chamber walls. Wall losses come in two forms: direct deposition of particles to the walls, and mass transfer of condensable vapors to the walls – most probably onto previously deposited particles. Deposition of particles has been addressed extensively be-fore (Crump and Seinfeld, 1981; McMurry and Rader, 1985; Pierce et al., 2008). Mass transfer of organic vapors to the walls has not received as much attention, and it is a more vexing problem because it is not directly constrained by mea-surements.
The presence of inorganic seeds allows us to formulate the problem in terms of the mass balance of inorganic and or-ganic material. The mass of the inoror-ganic material changes only due to deposition of particles to the walls, consequently,
d
dt[C
sus
seed] = −kw(t )Cseedsus (3)
whereCseedsus is the concentration of seed aerosol in suspen-sion andkw(t )is the time-dependent rate constant for mass
loss due to particle deposition onto the walls (henceforth re-ferred to as wall deposition constant). Similarly, the change in the seed-particle mass on the walls is:
d
dt[C
wall
seed] =kw(t )Cseedsus (4)
The change in the suspended organic particle mass in the chamberCOAsusis:
d
dt[C
sus
OA] = −kw(t )CsusOA+P sus
(5) wherekw(t )CsusOAis the loss rate of organic particle mass to
the chamber walls due to deposition andPsusis the net rate of mass transfer of organic vapors to the suspended particles (condensation – evaporation). In the above equation we im-plicitly assume that the wall deposition constantkw(t )of the
The change in organic particle mass on the wallsCOAwallis given by:
d dt[C
wall
OA] =kw(t )COAsus+Pwall (6)
wherePwallis the net rate of mass transfer of organic vapors to the chamber walls. The methods to determinePsus and
Pwallfrom SMPS and AMS data are described in more detail below. The goal is to determine the total organic aerosol con-centration,COA=COAsus+COAwall, so that we can use it in Eq. (1)
to calculate the corresponding aerosol mass yield. COAwalland
Cseedwallare ratios of the mass on the wall to the volume of the chamber and therefore have units ofµg m−3.
The wall deposition constant depends on the particle size and charge distribution and the level of turbulence inside the chamber. It is estimated semi-empirically here by fitting the observed wall loss before and after each experiment, using measurements when the UV lights are turned off and wall loss is the only process changing the total suspended particle mass in the chamber. To account for wall loss throughout the experiment,kw is interpolated linearly with time for the
duration of the experiment.
2.2.2 Condensation of organic vapors to chamber walls
To determinePwall, we assume that condensable vapors are not lost to the clean Teflon walls, but instead condense onto particles that have been deposited to the walls. This is a com-plex process, so here we will limit our analysis to constrain-ing the problem with two limitconstrain-ing cases. Case 1 assumes that the condensable products only partition to the suspended par-ticles, so there is no wall condensation andPwall=0. Previ-ous wall-loss treatments that only account for particle deposi-tion onto the chamber walls are consistent with this assump-tion. Case 2 assumes that condensation to the particles on the walls is not slowed by any additional mass-transfer resis-tances, so the particles on the walls are in equilibrium with the organic vapors and behave exactly as if they were sus-pended. There is no obvious reason why particles deposited to the chamber walls should completely lose contact with the vapors in the chamber, a conclusion supported by the precur-sor spiking experiments of Weitkamp et al. (2007). However, we cannot rule out a mass-transfer limitation to the walls, and a conservative approach is to treat these two limiting cases, while noting that the true behavior of the system may be somewhere in between. Mass transfer of organic vapors to the walls (Pwall)in case 2 scales with the particle mass frac-tion on the walls. Therefore, the limiting cases diverge and uncertainty in the observed SOA production increases during an experiment.
2.2.3 Estimating SOA production based on SMPS data
Usingkw(t )estimated as explained above, the initial
inor-ganic seed aerosol concentration measured by the SMPS and
the inorganic densityρseed, the predicted seed aerosol mass
in suspension throughout the experiment is
Cseedsus(t )=ρseedVsusseed(0)exp[− t
Z
0
kw(t )dt] (7)
The suspended organic-aerosol mass concentration measured by the SMPS is proportional to the difference between the measured volume,VSMPS, and the inorganic aerosol volume:
COAsus(t )=ρOA
VSMPS(t )−
Cseedsus(t ) ρseed
(8)
An inorganic density ofρseed=1.77 g/cm−3(dry ammonium
sulfate) and organic density ofρOA=1.4 g/cm−3based on
lit-erature data (Ng et al., 2007) is used to convert aerosol vol-ume to suspended aerosol mass concentrations.
In the two limiting cases, the calculations are straight-forward. Neglecting condensation onto the walls (case 1),
Pwall(t )=0 and
COA(t )=COAsus(t )+ t
Z
0
kw(t )COAsus(t )dt (9)
where the second term is just the integral of Eq. (6). This case provides a lower limit for SOA formation, and it is by far the most widely applied in the literature. For case 2, the organic to sulfate ratio remains the same for the suspended and wall-deposited particles because there are no mass-transfer limi-tations between the particles in suspension and those on the walls. Because the mass of ammonium sulfate is conserved in the combined system (suspended + walls): dtd [Cseed]=0,
the amount of organic aerosol formed can be calculated by multiplying the ratio of suspended organic aerosol to inor-ganic seed aerosol by the total initial mass of seed aerosol. Thus,
COA(t )=
COAsus(t ) Cseedsus(t )C
sus
seed(t =0) (10)
where t=0 corresponds to the time when the lights were turned on, starting photochemistry and the formation of or-ganic aerosol.
2.2.4 Estimating SOA production from AMS data
1.5
1.0
0.5
0.0
Suspended C
OA
/ C
seed
3 2
1 0
Time (hours) since start of photolysis
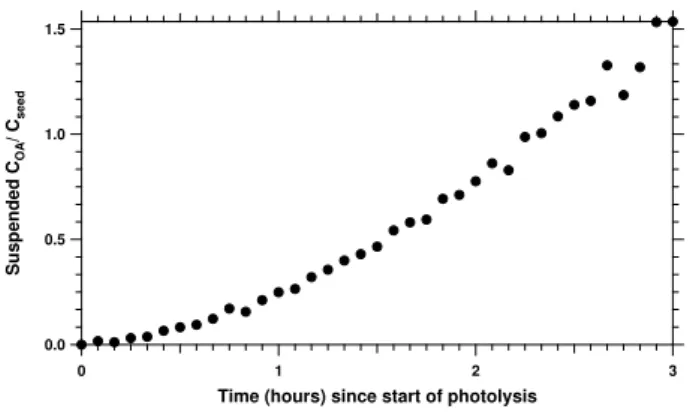
Fig. 1. Evidence for sustained SOA production: time series mea-surements of the ratio of organic to seed mass as measured by the AMS for experiment 12.
forming on the seed particles, presumably because the or-ganic material reduces particle bounce on the vaporizer of the instrument. This variation of CE in the AMS and the associated uncertainty in the absolute mass measurement is why we do not use the AMS to calculateCOAfor case 1. For
case 2, where the wall-deposited particles behave as if they were suspended, the amount of aerosol formed can be cal-culated by Eq. (10). The SMPS measurement of the initial ammonium sulfate concentration is used for this calculation since it is not prone to uncertainties regarding the collection efficiency and is thus deemed to be more accurate.
Figure 1 showsCOAsusCseedsus measured using the AMS dur-ing a typical low-NOxexperiment (Experiment 12). The
ini-tial ammonium sulfate concentration was 47µg m−3. Af-ter 80 min of photo-oxidation, 126µg m−3 of toluene had been oxidized and CsusOACseedsus ∼1, so 47µg m−3 of SOA had been formed, and the SOA mass yield was 37% for this case.
2.3 Composition of organic aerosol – extent of oxidation
Relative spectra, the fractional contributions of the organic fragment at eachm/zto the total organic mass, are calculated from the Q-AMS data. The mass fragment atm/z44 mostly corresponds to the CO+2 ion (Aiken et al., 2008) and can therefore be used as a semi-empirical measure of the extent of oxidation in the system. Aiken et al. (2008) have shown that the fraction of organic mass atm/z44 can be used to ap-proximate the oxygen to carbon (O/C) ratio in the organic aerosol. They found significant correlation between O/C and m/z44 described by the following least-squares fit:
(O/C)=3.82[m/z44](µg m
−3)
COA(µg m−3)
+0.0794 (11)
This correlation was mostly derived from ambient measure-ments in Mexico City, so the applicability to the data pre-sented here is uncertain. However, it can still provide an es-timate of the O/C ratio of the organic aerosol formed in these
experiments, and the fraction of the organic signal atm/z44 is still expected to be correlated with the extent of oxidation of the SOA.
2.4 Volatility of SOA
The volatility of the organic aerosol can be calculated from changes infsus≡COAsusCseedsus measured by the AMS, com-paring fTDsus(TTD), the organic fraction of the aerosol after
it was sent through the thermodenuder at temperatureTTD,
tofbypasssus (Tbypass), the organic fraction of the aerosol after it
was sent through the bypass, maintained at a constant tem-peratureTbypass (room temperature). The mass fraction
re-maining (MFR) after volatilization in the thermodenuder is given by:
MFR(TTD)=
fTDsus(TTD)
fbypasssus (Tbypass)
(12) Using the organic fractionsfsusrather than the total organic aerosol mass to calculate MFR removes the need for a wall-loss correction and avoids the associated uncertainties.
2.5 Parameterizing aerosol yields
Even simple SOA systems involve 10’s to 100’s of chemical products, and often relatively small mass yields of aerosol are important. This means that the compounds contributing to SOA formation may be numerous and also relatively mi-nor reaction products. Furthermore, they may evolve over time, and their physical properties, such as vapor pressures and activity coefficients, are usually not known. Because of this, we characterize SOA formation with an empirical ap-proach known as the Volatility Basis Set (VBS), in which products are separated based on their most relevant property – volatility – given byC∗. Equation (2) suggests thatC∗
is simply the organic aerosol mass concentration at which a given compound is found 50% in the gas phase and 50% in the particle phase. It is convenient to separate products into volatility bins that are regularly spaced by factors of 10 in
C∗-space (Donahue et al., 2006). The exact set depends on
the problem at hand, and here we shall consider 4 bins rang-ing from 1µg m−3to 1000µg m−3, because that is the ap-proximate range of SOA mass covered in these experiments. We can then describe an SOA forming reaction in terms of mass yields αi of productsPi. The product yieldsαi are
related to the aerosol yieldY by
Y =X
i
αiξi (13)
whereξi is the mass fraction of biniin the condensed phase,
as given by Eq. (2). The simplest case is one in which a sin-gle reaction connects the precursor to first-generation prod-ucts with yieldsαithat do not change over time. The product
concentrationsPi are then just a simple product of the
pre-cursor consumption1Cprec:
50
40
30
20
10
0
Aerosol Mass (
m
g/m
3 )
3 2
1 0
Time (hours) since start of photolysis Modeled (NH4)2SO4
Measured (NH4)2SO4 + SOA
SOA (case 2)
SOA (case 1) UV lights on
Fig. 2.Aerosol mass calculated from SMPS measurements for ex-periment 12, showing the modeled decay of inorganic seed, the slower decay of measured mass, and the mass of organic aerosol formed assuming no wall condensation (case 1) and wall conden-sation without additional mass-transfer limitations (case 2). The shaded area represents the uncertainty in the wall loss correction.
An example is the ozone +α-pinene system (Presto and Don-ahue, 2006). In this case, Odum et al. (1996) showed that one can simply observe the SOA mass yields as a function of SOA concentration in one or a succession of experiments, obtainingY (COA)and invert these data using Eqs. (1) and (2)
to obtain the αi. This can be accomplished via nonlinear
least-squares fitting (Stanier et al., 2008).
However, when progressive oxidation (aging) occurs, as with OH oxidation experiments such as the ones presented here, the product distribution may not be constant, and the simple fit mentioned above may not be valid. The situa-tion is more complicated when the aging is continuous, es-pecially when the precursor is relatively non-reactive and the oxidation products are significantly more reactive, which is probably the case here. Several generations of products will emerge and change in concentration continuously over the course of an experiment. Here, we approximate basis-set pa-rameters for this system for use in air-quality models until a more thorough treatment of these dynamic systems becomes available. These parameters do not capture the full dynamic evolution of the toluene SOA (the aging), but they do reason-ably reproduce the chamber data.
3 Results
The increasing organic to ammonium sulfate ratio shown in Fig. 1 implies that organic mass is transferred to the sus-pended particles (those we measure with the AMS) through-out the experiment. The aerosol mass concentrations cal-culated from SMPS volume measurements for this experi-ment (Eqs. 9 and 10) are shown in Fig. 2. Time is refer-enced to the onset of photolysis (t=0). The total suspended aerosol mass (black solid line) declines continuously due to wall losses, even as the organic to ammonium sulfate ratio
40
30
20
10
0
d
M
/dlog
Dva
(µg m
-3 )
100
2 3 4 5 6 7 8 9
1000
2 3
Vacuum Aerodynamic Diameter (nm) Sulfate
Organics
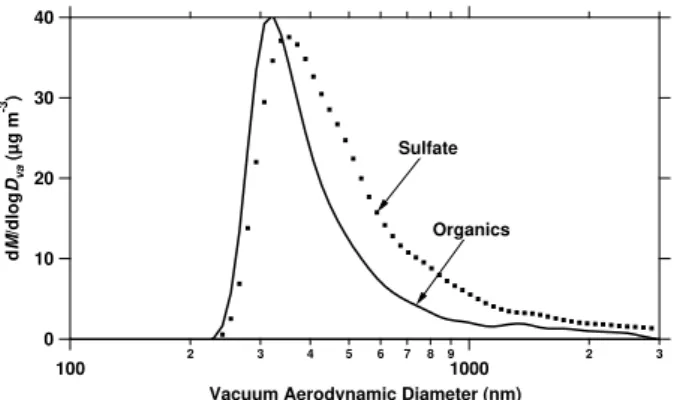
Fig. 3. AMS particle time-of-flight aerodynamic size distribution for experiment 12, averaged between 1 and 2 h after the onset of photolysis. The organic mass appears on the existing sulfate mode, though shifted to smaller sizes. This suggests that the SOA con-denses onto the seed particles but does not form a perfect mixture with them.
increases. Fort <0 the aerosol is entirely inorganic seed and its evolution is entirely due to wall losses. The modeled inor-ganic suspended aerosol mass (black dotted line) calculated from Eq. (8) thus tracks the total suspended massCOAsus(t )for
t <0. When the UV-lights are turned on, initiating toluene
oxidation, the measured mass deviates from the modeled in-organic mass, consistent with net condensation of in-organic aerosol andCOAsus(t )>0 (Eq. 9).
0.6
0.5
0.4
0.3
0.2
0.1
0.0 COA
/D
Ctol
1
2 3 4 5 6 7 8 9
10
2 3 4 5
COA(mg m -3
) case 1 suggested
case 1 conventional case 2
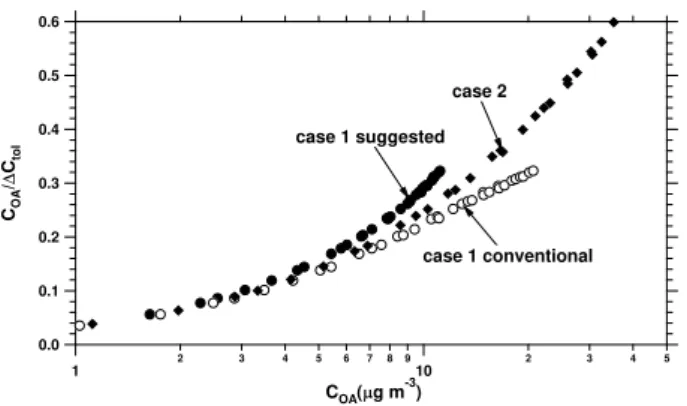
Fig. 4.Aerosol yield for experiment 7 as a function of total aerosol concentration,COA, calculated from SMPS volume measurements,
assuming no interaction between vapors and particles deposited on the walls (case 1, circles) and facile interaction between vapors and particles deposited on the walls (case 2, solid diamonds). Two dif-ferent conventions are used for the case 1 aerosol mass calculation: using total organic mass on the x-axis (open circles, conventional method but inconsistent) and using only suspended organic mass on the x-axis (solid circles, suggested to be more consistent).
The offset in the aerodynamic size distributions of organic and inorganic material shown in Fig. 3 suggests thatfsus, the fraction of suspended organic mass to suspended seed mass, does depend on particle size. The assumption thatkw is the
same for ammonium sulfate and organics may thus introduce some error in the mass yield calculations. If particle wall loss is dependent on particle size, ammonium sulfate and or-ganics will be lost at slightly different rates. The wall loss of organics is probably higher than that of ammonium sul-fate since the aerodynamic size distribution of the organics is shifted to smaller sizes relative to that of ammonium sul-fate, and smaller particles in this size range are expected to have higher wall-loss rates. This introduces a negative bias in the organic aerosol mass yield calculations. Given that the difference in the mode diameters was less than 0.1µm (aerodynamic diameter; the difference is smaller in mobil-ity diameter) and that the depositional loss curve is relatively flat in this size region (Pierce et al., 2008), we estimate that the error introduced by assuming a commonkwis only a few
percent.
3.1 Quantifying SOA production
Assumptions regarding the wall-loss correction represent the largest uncertainty for quantifying the SOA production. To illustrate this uncertainty, the two extreme estimates of the wall-loss corrected mass are shown in Fig. 2, where the un-certainty in the wall correction is represented by the area be-tween these two curves. The area increases throughout the experiment as the uncertainty due to the wall-condensation correction increases. Because of this increasing uncertainty with time, we focus on yield data for the first 3 h of each experiment.
Using the wall-loss corrected masses presented in Fig. 2 and the decay of toluene measured by the PTR-MS (not shown), we can calculate the fractional aerosol mass yield for these two bounding cases (Fig. 4). When presented as a function of COA, the uncertainty resulting from the wall
correction is smaller. This is because neglecting wall con-densation results in smaller aerosol yields (y-axis), but also in smallerCOA(x-axis). This is reassuring since traditional
air-quality models as well as newer formulations using the basis-set approach (Donahue et al., 2006) essentially model the formation of aerosol as a function of the total organic aerosol concentration. In addition, the uncertainty is even smaller forCOA<10µg m−3, which is the more
atmospheri-cally relevant range of organic aerosol concentrations. The yield data for the case of no wall condensation (case 1) are presented in two different ways in Fig. 4. One (open circles) is consistent with previous studies: the total or-ganic aerosol massCOA(t )=COAsus(t )+COAwall(t )is used for the
aerosol mass yield calculations (Eq. 1) and as the dependent variable (x-axis). However, there is a logical flaw in this representation: neglecting wall condensation assumes that there are no interactions between organic vapors in suspen-sion and the organic vapors deposited on the walls. There-fore, whileCwallOA(t )describes organic-aerosol mass that was formed and should therefore be included in the calculation of mass yield, it is assumed to not affect the partitioning be-havior in the system and should therefore not be included on the x-axis. A consistent representation of this case would plotY=C
sus
OA+C
wall OA
1CVOC as a function ofC sus
OA. Plotting the case 1
mass yield data in this way for experiment 7 results in case 1 yields (no wall condensation, solid circles) that are higher than case 2 yields (wall-vapor equilibrium, solid diamonds). Note from Fig. 4 that the difference in either of the case 1 models and the case 2 model is small. The remaining analy-sis will utilize the case 2 aerosol mass yields, which are not only more consistent with equilibrium thermodynamics but also with earlier studies (Weitkamp et al., 2007).
Figure 5 compares the aerosol mass yields in experiment 7, calculated from the SMPS data and the AMS data, assuming wall-vapor equilibrium (Eq. 10). Note that these measure-ments agree very well for this experiment. However, the agreement between yields calculated from SMPS data and those calculated from AMS data is not always this good. The agreement in the yields as a function of time calculated from both instruments is usually within 50%; the agreement is bet-ter for yields as a function ofCOA. However, in low-mass
experiments in which total organic aerosol loading andfsus
0.6
0.5
0.4
0.3
0.2
0.1
0.0 COA
/D
Ctol
1
2 3 4 5 6 7 8 9
10
2 3 4 5
COA(mg m -3
)
SMPS yield AMS yield
Fig. 5.Aerosol yields calculated from AMS data (solid circles) and SMPS data (open circles) agree well for experiment 7. Both yield calculations assume facile interaction between the vapors and the particles deposited on the wall (case 2).
data are based on the directly measured organic to sulfate mass ratio, while the calculations from SMPS data rely on computing the small difference between two number size dis-tribution measurements. Furthermore, the mass yields calcu-lated from the SMPS are strongly dependent on the measured particle wall deposition constantkw(t ), which introduces
ad-ditional uncertainty and potential for error. Consider, for ex-ample, experiments 11 and 12, which were run at very simi-lar conditions and are hence expected to give simisimi-lar results (Fig. 6). The AMS yields calculated from these two exper-iments agree well; however, the SMPS yields do not agree well, especially in the later stages of the experiment. This difference might be due to the estimated wall deposition con-stant:kw of experiment 11 increased by almost a factor of 2
during the experiment, whilekw of experiment 12 changed
by less than 10%, which is more consistent with other exper-iments. This high measuredkwin experiment 11 leads to an
overestimation of the wall loss and therefore an overestima-tion of the organic aerosol formed. Considering the superior precision of the AMS data for this system, we use the aerosol mass yields calculated from the AMS for the remaining anal-ysis. Comparing experiments conducted under similar exper-imental conditions in this work (experiments 11 and 12) and consistent with previous work (Pathak et al., 2007), we es-timate that our experimental error in aerosol mass yields is
±10%.
3.2 Dependence on experimental conditions
The yields measured in this study clearly depend on experi-mental conditions. In this section we shall compare exper-iments where a single parameter (e.g. temperature) varies while other conditions remain the same or similar. We are thus experimentally determining partial derivatives of this complex yield surface.
0.7
0.6
0.5
0.4
0.3
0.2
0.1
0.0
COA
/
D
Ctol
10
2 3 4 5 6 7 8 9
100
COA(mg m-3) Experiment 11 - SMPS
Experiment 12 - SMPS Experiment 12 - AMS Experiment 11 - AMS
Fig. 6.Reproducibility of experiments is better for AMS data (solid symbols) than for SMPS data (open symbols). Experiments 11 (di-amonds) and 12 (circles) were conducted under very similar con-ditions. All yield calculations assume facile interaction between vapors and particles deposited on the walls (case 2).
0.5
0.4
0.3
0.2
0.1
0.0 COA
/
D
Ctol
1
2 3 4 5 6 7 8 9
10
2 3 4 5 6 78 9
100
COA(mg m -3
) jNO2= 0.06 min
-1
, m/z 44~ 6% jNO2= 0.18 min
-1
, m/z 44~ 9%
0.2
0.1
0.0
m/z
44 (% of C
OA
)
7 6 5 4 3 2 1 0
Time (hours) since start of photolysis Experiment 3
Fig. 7. Effect of UV intensity on aerosol mass yield for two high-NOxexperiments. The yield in experiment 3 (high UV, solid
gles) is higher than the yield in experiment 1 (1/3 UV, open trian-gles). Inset: %m/z44 does not change over the course of a long photo-oxidation experiment such as experiment 3.
Figure 7 shows the effect of the UV intensity on the aerosol yield under high-NOxconditions: when all UV lights
are used (experiment 3) the aerosol mass yield is higher than when one third of the UV lights are used (experiment 1). The NO2photolysis rate, measured in separate experiments, was
0.18 min−1 when all UV lights were used and 0.06 min−1 when one third of the UV lights were used, thus the photol-ysis rate is proportional to the number of UV lights used, as expected. Even though less SOA is formed under the less active photochemical conditions (fewer UV lights used), the OH levels (based on the observed toluene decay rate) are not significantly lower at lower UV intensity. Other factors (pho-tolysis of organic hydroperoxide intermediates, HO2levels)
0.8
0.7
0.6
0.5
0.4
0.3
0.2
0.1
0.0 COA
/
D
Ctol
1
2 3 4 5 6 7 8 9
10
2 3 4 5
COA(mg m -3
)
32ºC, m/z 44 ~ 14% 11ºC, m/z 44 ~ 8%
Low NOx
0.8
0.7
0.6
0.5
0.4
0.3
0.2
0.1
0.0 COA
/
D
Ctol
1
2 3 4 5 6 7 8 9
10
2 3 4 5
COA(mg m -3
)
32ºC, m/z 44 ~ 11% 11ºC, m/z ~ 10%
High NOx
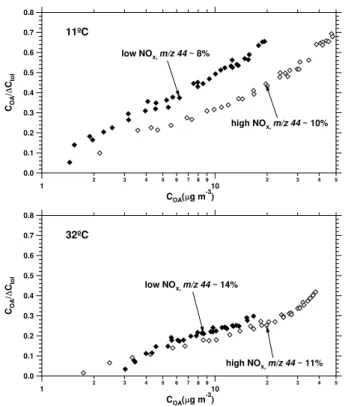
Fig. 8.Temperature effect on aerosol yield for low-NOx(top panel,
Expt. 9: 11◦C, Expt. 10: 32◦C) and high-NOx (bottom panel,
Expt. 5: 11◦C, Expt. 6: 32◦C) experiments. In both cases yields are significantly higher at lower temperatures.
zenith angle 70◦, Carter et al., 2005); hence all UV lights were used in experiments 2 to 13. A summary of the aerosol mass yields at 10µg m−3and 20µg m−3 measured for the different experiments is presented in Table 1.
Figure 8 compares experiments conducted at different temperatures. The aerosol yield data from experiments 9 and 10 show the temperature dependence under low-NOx
conditions: at 10µg m−3 organic aerosol loading aerosol
yields are 120% higher at 11◦C (experiment 9) than at 32◦C (experiment 10). Experiments 5 and 6 show the tempera-ture dependence under high-NOxconditions: at 10µg m−3
organic aerosol loading, aerosol yields are 80% higher at 11◦C (experiment 5) than at 32◦C (experiment 6). Aerosol yields are higher at lower temperature under both low-NOx
and high-NOxconditions. This is consistent with equilibrium
partitioning of semi-volatile products.
Figure 9 compares the yields at different NOxlevels. At
11◦C (top panel), the aerosol mass yield at 10µg m−3
or-ganic aerosol loading is 50% higher in experiment 9 (low NOx)than in experiment 5 (high NOx); at 20◦C (not shown),
the aerosol mass yield at 10µg m−3 is 30% higher in ex-periment 7 (low NOx)than in experiment 2 (high NOx); at
32◦C (bottom panel), the aerosol mass yield at 10µg m−3 is 20% higher in experiment 10 (low NOx)than in
experi-ment 6 (high NOx). Thus, at all temperatures investigated,
0.8
0.7
0.6
0.5
0.4
0.3
0.2
0.1
0.0 COA
/
D
Ctol
1
2 3 4 5 6 7 8 9
10
2 3 4 5
COA(mg m -3
)
high NOx, m/z 44~ 10%
low NOx, m/z 44~ 8%
11ºC
0.8
0.7
0.6
0.5
0.4
0.3
0.2
0.1
0.0 COA
/D
Ctol
1 2 3 4 5 6 7 8 910 2 3 4 5
COA(mg m -3
)
high NOx, m/z 44~ 11%
low NOx, m/z 44~ 14%
32ºC
Fig. 9.NOxeffect on aerosol yield at 11◦C (top panel, Expt. 9: low
NOx, Expt. 5: high NOx)and 32◦C (bottom panel, Expt. 10: low
NOx, Expt. 6: high NOx). Yields from low-NOxexperiments (solid
diamonds) are higher than yields from high-NOxexperiments (open
diamonds).
aerosol yields are lower under high-NOx conditions,
sug-gesting that the products formed under high-NOxconditions
may be more volatile than those formed under low-NOx
con-ditions. The NOx level appears to have a smaller effect at
higher temperatures.
3.3 Composition of organic aerosol – extent of oxidation
The oxidation state of the organic aerosol, presented as the percent of the organic signal due to mass atm/z44 (hence-forth referred to as %44) is presented in the inset of Fig. 7 for a long toluene photo-oxidation experiment (experiment 3). Note that the oxidation state of the aerosol does not change appreciably throughout the experiment. The same was ob-served in most other experiments presented in this study. In experiments 1, 2 and 6, %44 increased slightly during the first hour of photo-oxidation; but after the first hour, %44 remained constant in all experiments. This is in contrast to “simple” SOA cases such as terpenes + ozone (Zhang et al., 2006; Grieshop et al., 2007), where the oxidation state de-creases markedly asCOArises. Those simple cases are
that case increasedCOAwill result in a reduced %44.
Con-versely, in oxidized systems that are already dominated by low-volatility material (for example diesel emission), %44 increases withCOA (Sage et al., 2007). The signature of a
fixed product distribution (i.e. ozone + terpenes) is thus often a decrease in %44 with a large increase inCOAwhile the
sig-nature of chemical aging (i.e. evaporated primary emissions) is a sharp increase in %44 with a modest increase inCOA.
It appears that the toluene system may be a mixture of these two phenomena.
Even though %44 does not change after the first hour of an experiment, there is significant variability in %44 between experiments, as noted in Figs. 7–9 and summarized in Ta-ble 1. The oxidation state of the aerosol, represented by %44, is higher for experiments conducted at higher temperature (Experiment 6 vs. 5 and experiment 10 vs. 9). This is con-sistent with the notion that less oxidized compounds (lower %44) have higher volatility, resulting in less net condensa-tion of these products to the aerosol phase. There is no clear trend in %44 in the low- versus high-NOxexperiments of this
study. This is not inconsistent with the mass-yield data since lower volatility (and therefore higher mass yields) can be caused by increased branching, not just increased oxidation of the aerosol products. Aerosol formed under higher pho-tochemical activity (more UV lights, experiment 3) is more oxidized (higher %44) than aerosol formed under lower pho-tochemical activity (experiment 1). This variation in %44 be-tween experiments indicates that the product distribution of SOA formed from toluene photo-oxidation may depend on experimental conditions. The range of different %44 mea-sured in these experiments (6% to 14%), corresponds to an approximate range in O/C of 0.3 to 0.6 using Eq. (11), and they are within the range of %44 observed in the ambient atmosphere (∼3%–25%, Aiken et al., 2008).
3.4 Volatility of SOA
Volatility measurements show that the aerosol formed under low- and high-NOxconditions is clearly semi-volatile.
Un-der high-NOxconditions, approximately 60% of the
organic-aerosol mass evaporates at 38◦C and 16.5 s centerline resi-dence time (experiment 13). Under low-NOxconditions
ap-proximately 55% of the organic aerosol mass evaporates at 39◦C and 16.5 s residence time (experiment 8) and more than 90% of the organic aerosol mass evaporates at 52◦C. This
be-havior is inconsistent with the suggestion of Ng et al. (2007) that the toluene SOA under low-NOxconditions could be
de-scribed by a single, non-volatile product. This illustrates the difficulty of interpreting yield data for this complex system. The observation that the aerosol is semi-volatile is consis-tent with the presence of a yield-dependence on temperature. The product distribution of the SOA seems to change upon heating, as %44 is higher in the aerosol after the thermod-enuder than in the aerosol after the bypass line. In exper-iment 8, %44 was about 20% higher in the thermodenuder
0.6
0.5
0.4
0.3
0.2
0.1
0.0 COA
/
D
Ctol
1
2 3 4 5 6 7 8 9
10
2 3 4 5 6 78 9
100
COA(mg m -3
)
Experimental Data Suggested New Parameters
Historical Parameters
Low NOx
Ng et al 2007
0.6
0.5
0.4
0.3
0.2
0.1
0.0 COA
/
D
Ctol
1
2 3 4 5 6 7 8 9
10
2 3 4 5 6 78 9
100
COA(mg m -3
)
Historical Parameters
Experimental Data Suggested New Parameters
High NOx
Ng et al 2007
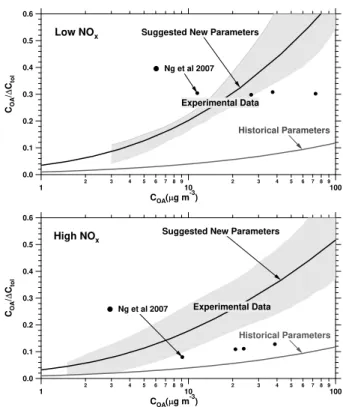
Fig. 10. Summary of experimental data at 20◦C under low-NOx
(top panel) and high-NOx(bottom panel) conditions. The yield
pa-rameters consistent with these data (suggested new papa-rameters) are much higher than those currently used in air-quality models (histor-ical parameters). Histor(histor-ical organic aerosol yields (y-axis) and total organic aerosol concentration (x-axis) used for the historical yield curve were multiplied by an organic aerosol density of 1.4 g cm−3 for better comparison with the experimental data, which were de-rived from direct mass measurements.
aerosol than in the bypass aerosol when the thermodenuder temperature was 52◦C, and about 10% higher when the tem-perature was 39◦C. We plan to characterize the volatility of organic aerosol formed from toluene photo-oxidation more thoroughly in future work.
3.5 Comparison to previous studies
The yields observed in these experiments are higher than those reported previously. Potential explanations for differ-ences between older studies and the more recent studies were addressed in Sect. 1.1. Here we shall focus on the relatively smaller differences between the present study and the recent studies of Ng et al. (2007, solid circles).
The top panel of Fig. 10 compares the results from our low-NOxexperiments conducted at 20◦C and the low-NOx
Table 2.SOA mass yields using a four-product volatility basis set.
Saturation concentration
(µg m−3) 1 10 100 1000
Historical∗ 0.01 0.03 0.075 0.25
Low NOx, 20◦C 0.01 0.24 0.7 0.7
High NOx, 20◦C 0.01 0.24 0.45 0.7
∗Historical parameters assuming OA density of 1 g cm−3(Lane et
al., 2007).
aerosol concentration while the yields observed by Ng et al. (2007) are constant.
The bottom panel of Fig. 10 compares the results from this study’s high-NOx experiments conducted at 20◦C and
the high-NOxexperiments conducted by Ng et al. (2007)
un-der similar conditions. The yields reported in this study are higher than those reported in the previous study. One differ-ence between these experiments is that, in the present study, NOxis present mostly as NO2since all NO is quickly
con-verted to NO2in a few minutes after the UV lights are turned
on. Therefore, while the experiments are conducted under high-NOxconditions, the conditions are low-NO for most of
the time, which may affect gas-phase chemistry. A mixture of NO and NO2more closely resembles typical atmospheric
conditions; therefore, the experiments by Ng et al. (2007) may capture this aspect of the system better. A further differ-ence is that the average temperatures in the experiments of Ng et al. (2007) were slightly higher and less controlled than in the experiments reported here. Finally, the yields reported by the previous study were not corrected for the condensa-tion of organic vapors onto wall particles. Applying this cor-rection is expected to result in higher organic aerosol yields. Aerosol mass yields appear to be highly sensitive to experi-mental conditions as well as corrections of the data for losses to the chamber walls.
3.6 Aerosol yield parameterizations
Volatility basis set (VBS) parameters consistent with the data at 20◦C are presented in Table 2 for low-NOxand high-NOx
conditions, and yield curves resulting from these parameter-izations are shown in Fig. 10. These basis-set parameters do not account for the dynamic nature of the system. A new framework and application for dynamic basis-set parameters will be presented in a future publication.
Table 2 also records “historical parameters”, the parame-ters currently used in air-quality models for small aromatic anthropogenic VOCs such as toluene (Lane et al., 2008), and the resulting VBS yield curves are shown in Fig. 10. Note that the parameters consistent with the data presented in this paper far exceed the historical parameters. This means that
air-quality models employing these new parameters will pre-dict significantly more anthropogenic SOA, partially closing the mass gap between model predictions and ambient obser-vations (Volkamer et al., 2006).
4 Conclusions
The SOA yields from the photo-oxidation of toluene are higher than previously reported values. Though the SOA yields show variability consistent with complex toluene pho-tochemistry, in all cases they are significantly higher than current model parameterizations predict. The main differ-ences between this study and previous studies which reported lower yields are: first, experimental conditions such as tem-perature, the levels of NO and NO2and the amount of UV
lights used, which affect measured SOA mass yields. Sec-ond, the use of the AMS to calculate SOA mass yields. Yields calculated from the SMPS are frequently not reliable, especially when organic aerosol loading and/or the ratio of suspended organic mass to inorganic mass is low. And third, the correction for the condensation of organic vapors to the walls of the chamber. We are the first to apply this correction, which is more important in this dynamic, slowly reacting sys-tem. The correction is also more important for experiments conducted without seed aerosol, and experiments conducted in smaller environmental chambers. We suggest yield pa-rameters consistent with these data which should be used in air-quality models as an approximation of a more thorough treatment of this dynamic system.
Acknowledgements. This research was supported by the EPA STAR program through the National Center for Environmental Research (NCER). This paper has not been subject to EPA’s required peer and policy review, and therefore does not necessarily reflect the views of the Agency. No official endorsement should be inferred. Lea Hildebrandt was supported by a National Science Foundation Graduate Research Fellowship.
Edited by: G. McFiggans
References
Aiken, A. C., DeCarlo, P. F., Kroll, J. H., Worsnop, D. R., Huff-man, J. A., Docherty, K., Ulbrich, I. M., Mohr, C., Kimmel, J. R., Sueper, D., Sun, Y., Zhang, Q., Trimborn, A. M., Northway, M. J., Ziemann, P. J., Canagaratna, M. R., Alfarra, M. R., Prevot, A. S. H., Dommen, J., Duplissy, J., Metzger, A., Baltensperger, U., and Jimenez, J. L.: O/C and OM/OC ratios of primary, sec-ondary, and ambient organic aerosols with high resolution time-of-flight aerosol mass spectrometry, Environ. Sci. Technol., 42, 4478–4485, 2008.
spectra from aerodyne aerosol mass spectrometer data, J. Aerosol Sci., 35, 909–922, 2004.
An, W. J., Pathak, R. K., Lee, B.-H., and Pandis, S. N.: Aerosol volatility measurement using an improved thermodenuder: Ap-plication to secondary organic aerosol, J. Aerosol Sci., 38, 305– 314, 2007.
Carter, W. P. L., Cocker, D. R., Fitz, D. R., Malkina, I. L., Bu-miller, K., Sauer, C. G., Pisano, J. T., Bufalino, C., and Song, C.: A new environmental chamber for evaluation of gas-phase chemical mechanisms and secondary aerosol formation, Atmos. Environ., 39, 7768–7788, 2005.
Crump, J. G. and Seinfeld, J. H.: Turbulent Deposition and Grav-itational Sedimentation of an Aerosol in a Vessel of Arbitrary Shape, J. Aerosol Sci., 12, 405–415, 1981.
Davidson, C. I., Phalen, R. F., and Solomon, P. A.: Airborne partic-ulate matter and human health: A review, Aerosol Sci. Tech., 39, 737–749, 2005.
de Gouw, J. A., Goldan, P. D., Warneke, C., Kuster, W. C., Roberts, J. M., Marchewka, M., Bertman, S. B., Pszenny, A. A. P., and Keene, W. C.: Validation of proton transfer reaction-mass spec-trometry (PTR-MS) measurements of gas-phase organic com-pounds in the atmosphere during the New England Air Quality Study (NEAQS) in 2002, J. Geophys. Res.- Atmos., 108, 4682, doi:10.1029/2003jd003863, 2003.
Dockery, D. W., Pope, C. A., Xu, X. P., Spengler, J. D., Ware, J. H., Fay, M. E., Ferris, B. G., and Speizer, F. E.: An association be-tween air-pollution and mortality in 6 United-States cities, New Engl. J. Med., 329, 1753–1759, 1993.
Donahue, N. M., Robinson, A. L., Stanier, C. O., and Pandis, S. N.: Coupled partitioning, dilution, and chemical aging of semivolatile organics, Environ. Sci. Technol., 40, 2635–2643, 2006.
Edney, E. O., Driscoll, D. J., Speer, R. E., Weathers, W. S., Klein-dienst, T. E., Li, W., and Smith, D. F.: Impact of aerosol liquid water on secondary organic aerosol yields of irradiated toluene/propylene/NOx/(NH4)2SO4/air mixtures, Atmos.
Envi-ron., 34, 3907–3919, 2000.
Forstner, H. J. L.: Aerosol Formation from Atmospheric Hydrocar-bon Photooxidation, Doctor of Philosophy, Chemical Engineer-ing, California Institute of Technology, Pasadena, USA, 381 pp., 1996.
Goldstein, A. H. and Galbally, I. E.: Known and unexplored organic constituents in the Earth’s atmosphere, Environ. Sci. Technol., 41, 1515–1521, 2007.
Grieshop, A. P., Donahue, N. M., and Robinson, A. L.: Is the gas-particle partitioning in alpha-pinene secondary or-ganic aerosol reversible?, Geophys. Res. Lett., 34, L14810, doi:10.1029/2007gl029987, 2007.
Hennigan, C. J., Bergin, M. H., Dibb, J. E., and Weber, R. J.: Enhanced secondary organic aerosol formation due to wa-ter uptake by fine particles, Geophys. Res. Lett., 35, L18801, doi:10.1029/2008gl035046, 2008.
Hurley, M. D., Sokolov, O., Wallington, T. J., Takekawa, H., Kara-sawa, M., Klotz, B., Barnes, I., and Becker, K. H.: Organic aerosol formation during the atmospheric degradation of toluene, Environ. Sci. Technol., 35, 1358–1366, 2001.
IPCC: Climate Change 2007 – The Physical Science Basis. Contri-bution of Working Group I to the Fourth Assessment Report of the IPCC, 2007.
Izumi, K. and Fukuyama, T.: Photochemical aerosol formation from aromatic-hydrocarbons in the presence of NOx, Atmos.
En-viron. A-Gen., 24, 1433–1441, 1990.
Jayne, J. T., Leard, D. C., Zhang, X. F., Davidovits, P., Smith, K. A., Kolb, C. E., and Worsnop, D. R.: Development of an aerosol mass spectrometer for size and composition analysis of submi-cron particles, Aerosol Sci. Tech., 33, 49–70, 2000.
Jimenez, J. L., Jayne, J. T., Shi, Q., Kolb, C. E., Worsnop, D. R., Yourshaw, I., Seinfeld, J. H., Flagan, R. C., Zhang, X., Smith, K. A., Morris, J. W., and Davidovits, P.: Ambient aerosol sam-pling using the Aerodyne Aerosol Mass Spectrometer, J. Geo-phys. Res.- Atmos., 108, 8425–8437, 2003.
Kanakidou, M., Seinfeld, J. H., Pandis, S. N., Barnes, I., Dentener, F. J., Facchini, M. C., Van Dingenen, R., Ervens, B., Nenes, A., Nielsen, C. J., Swietlicki, E., Putaud, J. P., Balkanski, Y., Fuzzi, S., Horth, J., Moortgat, G. K., Winterhalter, R., Myhre, C. E. L., Tsigaridis, K., Vignati, E., Stephanou, E. G., and Wilson, J.: Organic aerosol and global climate modelling: a review, Atmos. Chem. Phys., 5, 1053–1123, 2005,
http://www.atmos-chem-phys.net/5/1053/2005/.
Karydis, V. A., Tsimpidi, A. P., and Pandis, S. N.: Evaluation of a three-dimensional chemical transport model (PMCAMx) in the eastern United States for all four seasons, J. Geophys. Res.-Atmos., 112, D14211, doi:10.1029/2006jd007890, 2007. Kleindienst, T. E., Smith, D. F., Li, W., Edney, E. O., Driscoll, D.
J., Speer, R. E., and Weathers, W. S.: Secondary organic aerosol formation from the oxidation of aromatic hydrocarbons in the presence of dry submicron ammonium sulfate aerosol, Atmos. Environ., 33, 3669–3681, 1999.
Kleindienst, T. E., Conver, T. S., McIver, C. D., and Edney, E. O.: Determination of secondary organic aerosol products from the photooxidation of toluene and their implications in ambient PM2.5, J. Atmos. Chem., 47, 79–100, 2004.
Koo, B. Y., Ansari, A. S., and Pandis, S. N.: Integrated approaches to modeling the organic and inorganic atmospheric aerosol com-ponents, Atmos. Environ., 37, 4757–4768, 2003.
Kroll, J. H., Chan, A. W. H., Ng, N. L., Flagan, R. C., and Sein-feld, J. H.: Reactions of semivolatile organics and their effects on secondary organic aerosol formation, Environ. Sci. Technol., 41, 3545–3550, 2007.
LADCO – The Lake Michigan Air Directors Consortium: Midwest Regional Planning Organization: Base E Modeling Inventory, online available at: www.ladco.org, 1999.
Lane, T. E., Donahue, N. M., and Pandis, S. N.: Simulating sec-ondary organic aerosol formation using the volatility basis-set approach in a chemical transport model, Atmos. Environ., 42, 7439–7451, doi:10.1016/j.atmosenv.2008.06.026, 2008. McMurry, P. H. and Rader, D. J.: Aerosol wall losses in electrically
charged chambers, Aerosol Sci. Tech., 4, 249–268, 1985. Ng, N. L., Kroll, J. H., Chan, A. W. H., Chhabra, P. S., Flagan,
R. C., and Seinfeld, J. H.: Secondary organic aerosol formation from m-xylene, toluene, and benzene, Atmos. Chem. Phys., 7, 3909–3922, 2007,
http://www.atmos-chem-phys.net/7/3909/2007/.
Odum, J. R., Hoffmann, T., Bowman, F., Collins, D., Flagan, R. C., and Seinfeld, J. H.: Gas/particle partitioning and secondary organic aerosol yields, Environ. Sci. Technol., 30, 2580–2585, 1996.
Sec-ondary organic aerosol formation and transport, Atmos. Environ. A-Gen., 26, 2269–2282, 1992.
Pathak, R. K., Stanier, C. O., Donahue, N. M., and Pandis, S. N.: Ozonolysis of alpha-pinene at atmospherically rele-vant concentrations: Temperature dependence of aerosol mass fractions (yields), J. Geophys. Res.-Atmos., 112, D03201, doi:10.1029/2006jd007436, 2007.
Pierce, J. R., Engelhart, G. J., Hildebrandt, L., Weitkamp, E. A., Pathak, R. K., Donahue, N. M., Robinson, A. L., Adams, P. J., and Pandis, S. N.: Constraining particle evolution from wall losses, coagulation, and condensation-evaporation in smog-chamber experiments: Optimal estimation based on size dis-tribution measurements, Aerosol Sci. Tech., 42, 100–1015, doi:10.1080/02786820802389251, 2008.
Presto, A. A. and Donahue, N. M.: Investigation of a-pinene + ozone secondary organic aerosol formation at low total aerosol mass, Environ. Sci. Technol., 40, 3536–3543, 2006.
Sage, A. M., Weitkamp, E. A., Robinson, A. L., and Donahue, N. M.: Evolving mass spectra of the oxidized component of organic aerosol: results from aerosol mass spectrometer analyses of aged diesel emissions, Atmos. Chem. Phys., 8, 1139–1152, 2008, http://www.atmos-chem-phys.net/8/1139/2008/.
Song, C., Na, K., Warren, B., Malloy, Q., and Cocker, D. R.: Ipact of propene on secondary organic aerosol formation from m-xylene, Environ. Sci. Technol., 41, 6990–6995, 2007.
Stanier, C. O., Donahue, N., and Pandis, S. N.: Pa-rameterization of secondary organic aerosol mass fractions from smog chamber data, Atmos. Environ., 42, 2276–2299, doi:10.1016/j.atmosenv.2007.12.042, 2008.
Stern, J. E.: Aerosol Formation and Growth in Aromatic Hydrocarbon/NOx Systems, Doctor of Philosophy, Chemical
Engineering, California Institute of Technology, Pasadena, USA, 632 pp., 1988.
Takekawa, H., Minoura, H., and Yamazaki, S.: Temperature depen-dence of secondary organic aerosol formation by photo-oxidation of hydrocarbons, Atmos. Environ., 37, 3413–3424, 2003.
Volkamer, R., Jimenez, J. L., San Martini, F., Dzepina, K., Zhang, Q., Salcedo, D., Molina, L. T., Worsnop, D. R., and Molina, M. J.: Secondary organic aerosol formation from anthropogenic air pollution: Rapid and higher than expected, Geophys. Res. Lett., 33, L17811, doi:10.1029/2006gl026899, 2006.
Volkamer, R., Ziemann, P. J., and Molina, M. J.: Secondary Or-ganic Aerosol Formation from Acetylene (C2H2): seed effect on
SOA yields due to organic photochemistry in the aerosol aque-ous phase, Atmos. Chem. Phys., 9, 1907–1928, 2009,
http://www.atmos-chem-phys.net/9/1907/2009/.
Vutukuru, S., Griffin, R. J., and Dabdub, D.: Simulation and anal-ysis of secondary organic aerosol dynamics in the South Coast Air Basin of California, J. Geophys. Res.-Atmos., 111, D10S12, doi:10.1029/2005jd006139, 2006.
Weitkamp, E. A., Sage, A. M., Pierce, J. R., Donahue, N. M., and Robinson, A. L.: Organic aerosol formation from photochemi-cal oxidation of diesel exhaust in a smog chamber, Environ. Sci. Technol., 41, 6969–6975, doi:10.1021/es070193r, 2007. Zhang, J. Y., Hartz, K. E. H., Pandis, S. N., and Donahue, N. M.:
Secondary organic aerosol formation from limonene ozonoly-sis: Homogeneous and heterogeneous influences as a function of NOx, J. Phys. Chem. A, 110, 11053–11063, 2006.