INFLUENCE OF SOIL PH ON INORGANIC
PHOSPHORUS SORPTION AND DESORPTION IN
A HUMID BRAZILIAN ULTISOL
(1)Shinjiro Sato(2) & Nicholas Brian Comerford(3)
SUMMARY
Liming is a common practice to raise soil pH and increase phosphorus (P) bioavailability in tropical regions. However, reports on the effect of liming on P sorption and bioavailability are controversial. The process of phosphorus desorption is more important than P sorption for defining P bioavailability. However few studies on the relationship between soil pH and P desorption are available, and even fewer in the tropical soils. The effects of soil pH on P sorption and desorption in an Ultisol from Bahia, Brazil, were investigated in this study. Phosphorus sorption decreased by up to 21 and 34 % with pH increases from 4.7 to 5.9 and 7.0, respectively. Decreasing Langmuir K parameter and decreasing
partition coefficients (Kd) with increasing pH supported this trend. Phosphorus
desorption was positively affected by increased soil pH byboth the total amount of P desorbed and the ratio of desorbed P to initially sorbed P. A decreased K
parameter and increased Kd value, particularly at the highest pH value and
highest P-addition level, endorsed this phenomenon. Liming the soil had the double effect of reducing P sorption (up to 4.5 kg ha-1 of remaining P in solution)
and enhancing P desorption (up to 2.7 kg ha-1 of additionally released P into
solution).
Index terms: liming, phosphorus bioavailability, Langmuir, partition coefficients, and Atlantic Forest.
(1) Parte da Tese de Doutorado do primeiro autor junto à Universidade de Florida, Gainesville, Florida, EUA. Recebido para publica-ção em março de 2004 e aprovado em julho de 2005.
(2) Pós-Doutor do Departamento de Ciências de Cultura e Solo – Universidade de Cornell. 1022 Bradfield Hall, Cornell University, Ithaca, NY 14853 USA. E-mail: [email protected]
(3) Professor do Departamento de Ciência de Solo e Água – Universidade de Florida. 2169 McCarty Hall, Box 110290, University of Florida, Gainesville, Florida 32611 USA. E-mail: [email protected]
RESUMO: INFLUÊNCIA DO PH DO SOLO NA ADSORÇÃO E DESSORÇÃO DE FÓSFORO NUM ULTISOL ÚMIDO BRASILEIRO
A calagem é uma prática comum para elevar o pH do solo e aumentar a biodisponibilidade de fósforo (P) nas regiões tropicais. Todavia, o efeito da calagem na adsorção e biodisponibilidade de fósforo tem sido relatado de forma controversa. A dessorção de fósforo é um processo mais importante do que a adsorção para definir a biodisponibilidade de fósforo. Apesar disso, poucos estudos sobre a relação entre pH do solo e dessorção de fósforo são disponíveis, sobretudo nos solos tropicais. Os efeitos do pH do solo na adsorção e dessorção de fósforo num Ultissolo da Bahia, Brasil, foram investigados. A adsorção de fósforo diminuiu até 21 e 34 % com o aumento do pH de 4,7 para 5,9 e 7,0, respectivamente.
O parâmetro K da equação de Langmuir diminuiu e os coeficientes de partição (Kd)
diminuíram junto com o pH, mantendo esta tendência. A dessorção de fósforo foi positivamente influenciada pelo aumento do pH, como reflexo da quantidade total de fósforo dessorvido e da taxa dessorvida do fósforo inicialmente adsorvido. O parâmetro K diminuiu
e o valor de Kd aumentou, especialmente no valor de pH mais alto e no nível mais alto de
adição de fósforo, reforçando a ocorrência do fenômeno. A calagem deste solo teve efeitos
duplos de reduzir a adsorção de fósforo (até 4,5 kg ha-1 de P na solução) e de aumentar a
dessorção de fósforo (até 2,7 kg ha-1 de P liberado adicionalmente para a solução).
Termos de indexação: calagem, biodisponibilidade de fósforo, Langmuir, coeficientes de partição e Mata Atlântica.
INTRODUCTION
In tropical regions, liming is frequently used to raise soil pH and increase phosphorus bioavailability (Sanchez & Uehara, 1980). However, published results regarding the effect of liming on P sorption and bioavailability are conflicting (Haynes, 1982). Phosphorus sorption has been shown to both decrease (Ernani et al., 1996) and increase (Pereira & De Faria, 1998) with increasing pH. Still others have shown no significant pH influence (Arias & Fernandez, 2001).
Liming three acid soils from southern Brazil increased the P sorption up to a pH of 5.0, at which point P sorption decreased (Anjos & Rowell, 1987). Raising the pH of a Cerrado Oxisol with an initial pH of 4.5 also reduced P sorption by 18 to 24 % (Smyth & Sanchez, 1980). The authors attributed the reduced P sorption to increased hydroxyl concentration and increased competition between hydroxyl and phosphate ions for specific adsorption sites on mineral surfaces. Several authors thought that decreased P sorption was due to the neutralization and precipitation of Al3+ and
hydroxy-Al as hydroxy-Al hydroxide during liming, thereby decreasing the number of P sorption sites (Naidu et al., 1990). Haynes (1982) added that the mineral surface became increasingly negative with increasing pH, resulting in greater electrostatic repulsion and decreased P sorption.
In contrast, Chen & Barber (1990) showed that adjusting acid weathered soils from pH 4.2 up to pH 8.3 increased sorbed P up to pH of about 6.0, then decreased sorption at higher pH values. The
initial increase in P sorption was explained as the formation of amorphous hydroxyl Al with highly active sorbing surfaces. The subsequent decrease in P sorption was attributed to increased competition of hydroxyl with phosphate for sorption sites. Similar conclusions were drawn from Nigerian acid soils (Mokwunye, 1975) and Al organic matter complexes (e.g., Al-peat and Al-humate) (Haynes & Swift, 1989).
Few investigations have focused on soil pH and P desorption. The few that exist have obtained results ranging from increased P desorption with increasing pH (De Smet et al., 1998) to decreasing pH in others (Barrow, 2002). Rupa et al. (2001) desorbed P from three Indian surface soils using six consecutive dilution extractions at pH values varying from 4.2 to 8.0. Phosphorus desorption increased for all soils up to a pH of 5.5, and then decreased at pH values of 6.7 and 8.0. It was thought that decreased desorption at high pH values was due to P precipitation as a Ca-phosphate, since the soils were high in exchangeable Ca2+ plus Mg2+ (4.3
to 41.2 cmolc kg-1).
Phosphorus desorption is a key process determining inorganic P bioavailability. However, in order to use the desorption process in nutrient uptake models such as described by Smethurst & Comerford (1993), a P desorption isotherm is required. An isotherm describes the amount of P on the solid phase relative to the solution P concentration with the slope of this relationship termed the partition coefficient, Kd. The Kd values
b = θ + ρKd (1)
where b is the soil buffer power, θ is volumetric water content (cm3 of water per cm3 of soil), and ρ is soil
bulk density (g cm-3). Both K
d and b are critical
parameters for computer-based nutrient uptake models because of their role when calculating diffusion as a nutrient-supply mechanism. For many soil conditions, diffusion is the mechanism supplying 90 to 98 % of P absorbed by roots (Barber, 1980). The overall objective of this study was to investigate the influence of pH on P desorption from an Ultisol from the Atlantic Forest of Brazil. Much of the soil in this area has been degraded by deforestation and subsequent extensive management for pasture and row crops. Phosphorus management is a crucial component of rehabilitating these degraded soils.
Specific objectives were to study this soil and its properties as related to the effect of soil pH on P sorption and desorption. The first hypothesis was that P sorption was a function of pH with evidently decreasing sorption with pH increasing from 4.7 to 7.0. This soil is inherently low in exchangeable Al3+,
so the mechanism of amorphous Al-OH creating new surface for sorption was considered unimportant. Understanding the influence of liming on P sorption for these soils should play a role in the management of their P bioavailability. The second hypothesis was that P desorption was a function of pH, with increasing desorption as pH increases. The degree to which liming influences P desorption is another important aspect of P management that is virtually unknown.
MATERIALS AND METHODS
Soil Material and Its Characterization
The soil studied was the surface horizon (0 to 30 cm depth) of a Kandiudult (Soil Survey Staff, 1999), known as an Argissolo Vermelho/Vermelho-Amarelo distrófico in the Brazilian system (Oliveira et al., 1992). It was taken from under a native Atlantic Forest cover type near the city of Una, Bahia, Brazil. Using a shovel, the material was collected from a 1 ha area. Approximately 20 sampling points were combined. The soil was air-dried, passed through a 2 mm sieve, and stored in plastic bags.
Soil characterization was performed as follows: pH using a glass-electrode pH meter, Orion Model 720A; organic carbon using a Walkley-Black method (Nelson & Sommers, 1982); particle-size distribution using a pipette method (Gee & Bauder,
1986); exchangeable cations using 1 mol L-1
ammonium acetate (pH 4) as displacing solution, with Ca2+, Mg2+, K+, and Na+ measured by atomic
absorption spectroscopy; 1 mol L-1
KCl-exchangeable Al3+ and 1 mol L-1 ammonium
acetate-exchangeable Fe3+ measured by atomic absorption
spectroscopy; acid ammonium-oxalate- and sodium citrate-dithionite-extractable Al3+ and Fe3+
determined by the method of McKeague & Day (1966); water-extractable P using 50 mmol L-1 KCl;
Mehlich-1 extractable P (Mehlich, 1953); total P by digestion with H2SO4 and 30 % H2O2 as described
by Grierson et al. (1999); and clay mineralogy and its quantification determined by X ray diffraction and thermogravimetric analysis, respectively.
Phosphorus sorption isotherms
Two 100 g sub-samples were taken from the bulk soil sample and adjusted to pH 5.9 and 7.0 from the original pH of 4.7. Each sub-sample received the appropriate volume of NaOH solution to increase soil pH, based on an acid base titration curve for the soil (data not shown). The sub-samples were then air-dried at room temperature.
Phosphorus sorption isotherms were produced for each of the three pH levels. Solution pH was not controlled during the sorption process. Triplicate 2 g soil samples were weighed into 50 mL centrifuge tubes and 20 mL of 50 mmol L-1 KCl containing 2,
4, 6, 8, 10, 12, 14, 16, 18, or 20 µg mL-1 P as KH 2PO4
were added to each tube. Triplicate blanks of 20 mL of 50 mmol L-1 KCl without soil and without P were
included as well. The tubes were shaken horizontally for 20 h, and centrifuged for 15 min at 2,500 rpm for the pH 4.7 and 5.9 samples, and for 15 min at 10,000 rpm for the pH 7.0 sample in order to clear the supernatant solution. The supernatant was filtered through Whatman No 5 filter paper and
measured for soluble reactive P by the method of Murphy & Riley (1962). Soluble reactive P as measured by this method was operationally defined as inorganic P. The same centrifugation scheme, the same filter paper-size, and P determination were used for all experiments in this study. Sorbed P was calculated based on the difference between the initial solution concentration and the final concentration in the filtrate.
Phosphorus desorption isotherms using the multiple AEM method
For the Multiple AEM Method, the soil pH was adjusted as described for the P sorption-isotherms study. The pH was only adjusted at the beginning of the experiments and was not controlled throughout the experiments because pH control during P desorption was not expected to have a significant effect on the P desorption process (Bhatti & Comerford, 2002).
Phosphorus desorption isotherms were initiated from three different sorption points at each pH. Phosphorus was sorbed onto the soil using 40, 80, or 180 µg g-1 P soil. These levels were chosen
broadcast and incorporated into the top 3 cm of soil). The desorption procedure was accomplished by weighing triplicate 2 g soil samples from each pH level into six sets of triplicate centrifuge tubes. The initial weight of tube + soil was recorded. Twenty milliliters of 50 mmol L-1 KCl containing 4, 8 or
18 µg mL-1 P as KH
2PO4 were added to each tube,
and the total initial weight of tube + soil + solution was recorded. Tubes were shaken for 20 h and centrifuged. The supernatant solution was filtered, and P in the filtrate was determined.
After decanting the supernatant, weights of tube + soil were recorded. Each tube then was filled with 50 mmol L-1 KCl to its initial tube + soil + solution
weight. Anion exchange membrane (AEM) strips (1.88 x 7.50 cm; Type AR204 SZRA-412, Ionics Inc., Watertown, MA) prepared in KCl solution were rinsed with double-deionized water, and 1, 2, 3, 4, 5, or 6 strips were inserted into each of six sets of triplicate tubes. The tubes were shaken for 2 h, then the strips were removed from the tubes, rinsed with double-deionized water, and placed in six other sets of triplicate tubes filled with 15 mL of 2 mol L-1 KCl
for the 1-, 2-, and 3-strip tubes and with 30 mL for the 4-, 5-, and 6-strip tubes. These tubes were shaken for 30 min, then filtered. Phosphorus in the filtrate was measured as described above. The original tubes containing soil were shaken for 20 h and centrifuged. The supernatant solution was filtered and P in the filtrate was determined.
The first step of the described procedure was to reduce desorbable P on the solid phase through the use of AEMs. The subsequent equilibration step was required to develop a desorption isotherm because the soil must come into an equilibrium or quasi-equilibrium to measure an equilibrium solution concentration. The entire procedure of the previous paragraph was repeated twice, resulting in a total of three desorption steps and yielding 18 points on a desorption isotherm for each pH in 4 days.
Equation for P sorption and desorption isotherms
The Langmuir equation was fit to all data for both the sorption and desorption isotherms. The following form of the equation was used:
l l s C K 1 C b K C + = (2)
where Cs is the amount of P sorbed onto the solid
phase per unit mass of soil in µg g-1 of P of soil; C l is
the equilibrium concentration of P in solution in µg mL-1 of P; K is the affinity index expressed in
mL µg-1 of P; and b is the sorption maximum with
unit of µg g-1 of P of soil. Both K and b are empirical
constants that can be calculated from a linear form of the equation plotted as Cl/Cs against Cl:
b K 1 b C C C l s
l = +
(3)
where 1/b and 1/Kb are the slope and intercept of the linear regression, respectively.
The ability of the solid phase to buffer Cl was
described numerically using the partition coefficient,
Kd. This reflects the rate of change of the ratio of
sorbed P to solution P, and is the first derivative of equation (2) with respect to the solution concentration: 2 l d l s ) C K 1 ( b K K C d C d + = = (4) Statistical analysis
Statistical differences among different linear regression lines were tested using the General Linear Models procedure in the Statistical Analysis System framework (SAS Institute, 1988). Analysis of variance (ANOVA) was used to test differences among regression line parameters. Significance of the difference among means was determined by t-tests at the p = 0.05 level. Means and standard deviations were used to summarize the data from P sorption and desorption isotherms where applicable.
RESULTS
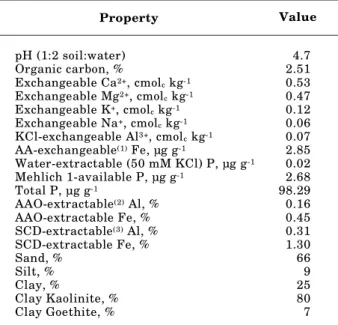
The soil was acidic with low cation exchange capacity and with low water-soluble and Mehlich-1
Table 1. Surface soil (0–30 cm) properties for the Atlantic Forest soil, Bahia, Brazil
Property Value
pH (1:2 soil:water) 4.7
Organic carbon, % 2.51
Exchangeable Ca2+, cmolc kg-1 0.53
Exchangeable Mg2+, cmolc kg-1 0.47
Exchangeable K+, cmolc kg-1 0.12
Exchangeable Na+, cmolc kg-1 0.06
KCl-exchangeable Al3+, cmolc kg-1 0.07
AA-exchangeable(1) Fe, µg g-1 2.85
Water-extractable (50 mM KCl) P, µg g-1 0.02
Mehlich 1-available P, µg g-1 2.68
Total P, µg g-1 98.29
AAO-extractable(2) Al, % 0.16
AAO-extractable Fe, % 0.45
SCD-extractable(3) Al, % 0.31
SCD-extractable Fe, % 1.30
Sand, % 66
Silt, % 9
Clay, % 25
Clay Kaolinite, % 80
Clay Goethite, % 7
extractable P. Its 25 % clay content was dominated by kaolinite. The iron content was greater than the Al content in both the amorphous and crystalline oxide forms (Table 1).
Phosphorus sorption pH envelope
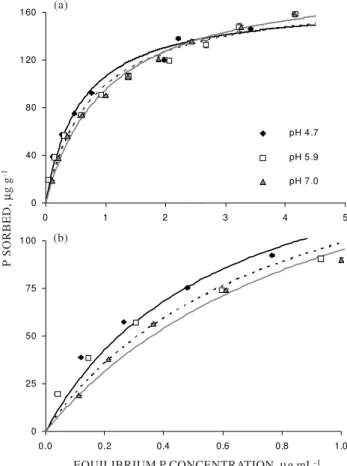
Phosphorus sorption was a function of initial soil pH, with sorption decreasing with increasing pH when equilibrium P concentrations were less than about 3 µg mL-1 P (Figure 1a). Phosphorus sorption
decreased by up to 21 % when pH was increased from 4.7 to 5.9, and decreased by up to 34 % when pH was increased from 4.7 to 7.0. Above 3 µg mL-1
P, there were no sorption differences between pH treatments.
The Langmuir equation fit P sorption data for all three pH levels (r2 = 0.970 to 0.993, Table 2), with
Langmuir parameters such as K and b values being affected by pH levels. As pH increased, K values decreased significantly and b values increased significantly.
The relationship of changes in Kd values and
equilibrium P concentration proved to be a function of soil pH (Figure 2). The Kd values at the higher
pH levels were lower than at the original pH, once the equilibrium concentration was reduced to below about 0.5 µg mL-1 P. The K
d values were as much
as 22 and 34 % lower at pH 5.9 and 7.0, respectively, than at pH 4.7.
Phosphorus desorption pH envelope
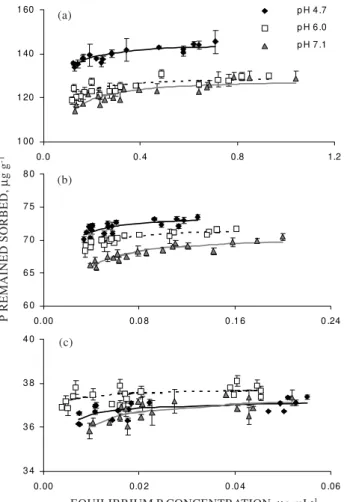
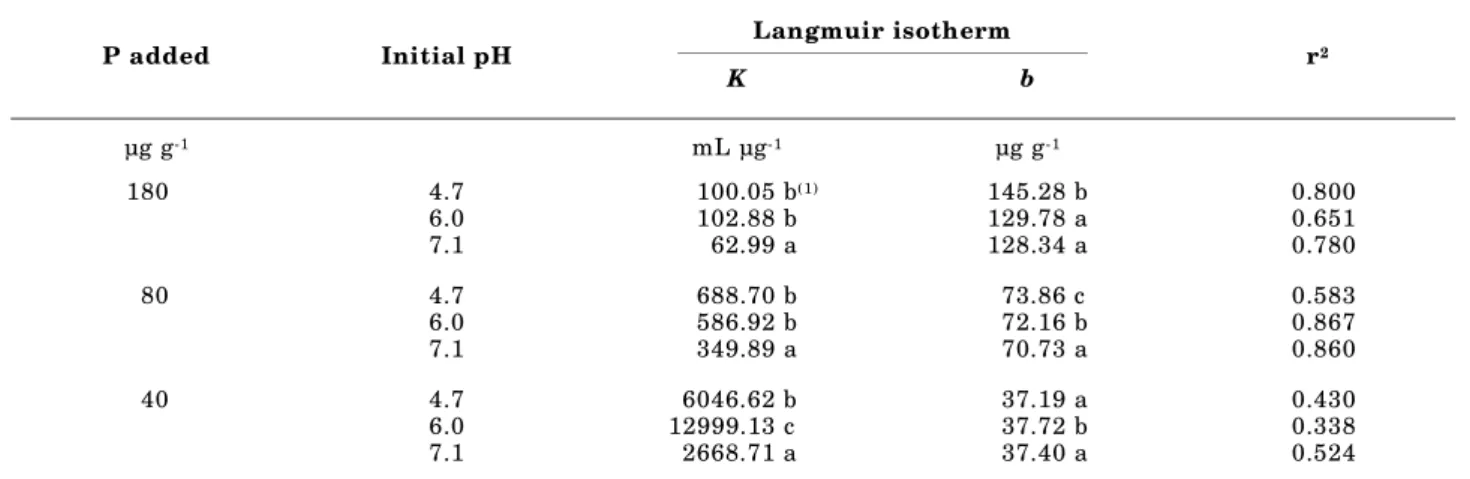
Phosphorus desorption exhibited the expected hysteresis between sorption and desorption at all three pH levels for each level of P loading (Figure 3). Since P sorption was a function of initial soil pH as mentioned above, P desorption isotherms began from different sorption points which depended on soil pH and the amount of initially added P (Table 3). The Langmuir equation fit the majority of the desorption data with variable success (r2 = 0.338 to
0.867) except for the low P-addition level. Soil pH significantly influenced the values of the Langmuir equation’s parameters (Table 4). For the medium and high levels of added P, K values were only significantly decreased at pH 7.1. At lowest level of added P, the K value significantly increased at
Figure 1. Phosphorus sorption isotherms at three different soil pH levels with equilibrium concentration of (a) 0–5 µg mL-1 of P and (b)
0.0–1.0 µg mL-1 of P. 0
40 80 1 20 1 60
0 1 2 3 4 5
pH 4 .7
pH 5 .9
pH 7 .0
0 25 50 75 1 00
0.0 0.2 0.4 0.6 0.8 1.0
EQUILIBRIUM P CONCENTRATION, µg mL-1
P SORBED,
µ
g g
-1
(a)
(b)
0 50 1 00 1 50 2 00 2 50 3 00
0.0 0.5 1.0 1.5 2.0 2.5 pH 4 .7
pH 5 .9
pH 7 .0
Figure 2. Partition coefficients relative to equilibrium P concentration for P sorption isotherms at three different soil pH levels.
P
A
R
TITION COEFFICIENTS,
Kd
EQUILIBRIUM P CONCENTRATION, µg mL-1 Langmuir equation
Initial pH
K b
r2
mL µg-1 µg g-1
4.7 1.69b(1) 169.04 a 0.970
5.9 1.27ab 177.04 ab 0.971
7.0 0.98a 192.12 b 0.993
(1) Different letters assigned in a column for each parameter de-note significant differences among pH levels (p = 0.05 by Tukey’s studentized range test).
pH 6.0 but significantly decreased at pH 7.1, compared to values at pH 4.7. The range of K values across pH levels for medium and low levels of P addition was approximately 6-fold and 40- to
127-EQUILIBRIUM P CONCENTRATION, µg mL-1
Figure 3. Phosphorus desorption isotherms at three different soil pH levels with three different initial P addition levels. (a) 180 µg g-1 of P. (b)
80 µg g-1 of P. (c) 40 µg g-1 of P.
P REMAINED SORBED,
µ
g g
-1
1 00 1 20 1 40 1 60
0.0 0.4 0.8 1.2
p H 4 .7
p H 6 .0
p H 7 .1
6 0 6 5 7 0 7 5 8 0
0.00 0.0 8 0 .1 6 0 .24
3 4 3 6 3 8 4 0
0.00 0.0 2 0 .0 4 0 .06 (a)
(b)
(c)
fold higher than that at the highest level P-addition level.
The b values were significantly lower at pH 6.0 and 7.1 than at pH 4.7, but were not significantly different from each other for the highest level of P addition. For the medium P-addition level, b values for both elevated pH levels were significantly higher than at the original pH. For the lowest P-addition level, only at pH 6.0 the b value was significantly higher than at pH levels of 4.7 and 7.1.
Phosphorus desorption was a function of soil pH when expressed in terms of either the amount of P desorbed or the percent of P initially sorbed (Table 3). Higher pH levels resulted in more P desorbed and a higher percentage of sorbed P desorbed. This was true for both the medium and high levels of P addition. However, for the lowest level of P added, both P desorbed and the corresponding percent desorption slightly decreased at pH 6.0 and significantly increased at pH 7.1, compared to values at pH 4.7.
The calculated Kd values, when plotted against
equilibrium P concentrations, evidenced opposite trends to those documented in the sorption study (Figure 4). For the highest level of P addition, Kd
values at pH 6.0 were lower than at pH 4.7 by up to 13 %; while Kd values at pH 7.1 were up to 38 %
higher than at pH 4.7. For example, Kd values at
pH 4.7, 6.0, and 7.1 were 32.9, 28.7, and 43.7 at an
equilibrium concentration of 0.2 µg mL-1 P,
respectively. For the medium level of P addition,
Kd values at pH 6.0 and 7.1 were 13 to 14 % and 76
to 85 % greater than at pH 4.7, respectively. For the lowest level of P addition, Kd values were 52 to 53 % lower at pH 6.0 and 120 to 126 % greater at pH 7.1, respectively, compared to values at pH 4.8.
Table 3. Total amount of P sorbed and desorbed and the percent of sorbed P that was desorbed at three different soil pH levels with three different initial P-addition levels
P added Initial pH P sorbed Total P desorbed % of P desorbed
to P initially sorbed
µg g-1 __________________________________ µg g-1__________________________________ %
180 4.7 152.04 18.94 a(1) 12.5 a
6.0 139.47 21.52 a 15.4 b
7.1 139.28 25.61 b 18.4 c
80 4.7 74.91 5.02 a 6.7 a
6.0 73.65 5.59 a 7.6 a
7.1 72.54 6.68 b 9.2 b
40 4.7 37.89 1.77 ab 4.7 ab
6.0 38.44 1.68 a 4.4 a
7.1 37.86 2.10 b 5.5 b
DISCUSSION
Soil pH effect on P sorption
Results from the P sorption study supported the hypothesis that, in this soil, P sorption decreases with increasing pH. This is consistent with what has been shown for other weathered, acid soils with low levels of exchangeable Al3+ (Naidu et al., 1990).
This result has been ascribed to an increased electrostatic repulsion due to the increased negative surface charge (Haynes, 1982) that accompanies increasing pH. A contributing factor is that higher hydroxyl concentrations, which can be 10 to 1,000 times higher than at lower pH levels, compete effectively with phosphate ions for specific sorption sites on mineral surfaces (Smyth and Sanchez, 1980). This result may also be assisted by a reduction in the number of P-sorption sites. At higher pH levels, Al hydroxide polymers can neutralize sites where more reactive Al surfaces were once present (Sanchez and Uehara, 1980). Soils dominated by kaolinite, goethite, and gibbsite, as the soil used in this study, are particularly susceptible to each of the above-named mechanisms. Empirically, trends for the Langmuir K parameter and for Kd supported these explanations. The
reduced Langmuir K values with increasing pH suggest a reduced P affinity for the sorption surface. The Kd represents the rate of change in the amount of sorbed P relative to the amount of P in solution upon continued introduction of P to the solution phase. Therefore, decreasing Kd with increasing pH
corresponds to decreasing rates of change in the amount of P sorbed, leaving more of the applied P in solution.
At higher equilibrium concentrations (≥ 3 µg mL-1
P), there were no differences between isotherms at
Table 4. Langmuir parameters for P desorption isotherms at three different soil pH levels with three different initial P-addition levels
Langmuir isotherm
P added Initial pH
K b r
2
µg g-1 mL µg-1 µg g-1
180 4.7 100.05 b(1) 145.28 b 0.800
6.0 102.88 b 129.78 a 0.651
7.1 62.99 a 128.34 a 0.780
80 4.7 688.70 b 73.86 c 0.583
6.0 586.92 b 72.16 b 0.867
7.1 349.89 a 70.73 a 0.860
40 4.7 6046.62 b 37.19 a 0.430
6.0 12999.13 c 37.72 b 0.338
7.1 2668.71 a 37.40 a 0.524
(1) Different letters assigned in a column for each parameter at each P-addition level denote significant differences among pH levels (p = 0.05 by Tukey’s studentized range test).
0 50 1 00 1 50
0.0 0.2 0.4 0.6 0.8
pH 4 .7
pH 6 .0
pH 7 .1
0 50 1 00 1 50
0.0 0 0.0 5 0 .10 0 .15
0 50 1 00 1 50
0.0 0 0.0 1 0 .0 2 0 .03 0 .04
Figure 4. Partition coefficients relative to equilibrium P concentration for P desorption isotherms at three different soil pH levels with three different initial P-addition levels. (a) 180 µg g-1
of P. (b) 80 µg g-1 of P. (c) 40 µg g-1 of P. EQUILIBRIUM P CONCENTRATION, µg mL-1
P
A
R
TITION COEFFICIENTS,
Kd
(a)
(b)
any pH. However, at the commonly practiced P-fertilization rate of 50 kg ha-1 of P, which corresponds
to 125 µg g-1 of soil P using the above assumptions,
maximum solution P concentration was only 1.4 µg mL-1 P. Soil solution P concentration is
commonly around 0.05 µg mL-1 P and seldom higher
than 0.3 µg mL-1 P in most agricultural soils (Fried
& Shapiro, 1961). Therefore, P sorption isotherms for the same three pH values were replotted focusing on a lower solution P-concentration range (0.0– 1.0 µg mL-1 of P, Figure 1b).
These data showed that P sorption decreases with pH increase under common P fertilization practices. At a solution concentration of 0.2 µg mL-1
P, sorbed P was 43, 36, and 32 µg g-1 of soil P at
pH 4.7, 5.9, and 7.0, respectively. These represent 16 and 26 % reduction in sorption compared to a pH of 4.7 when the soil is limed to pH 5.9 and 7.0, respectively. These percentages represent 2.8 to 4.5 kg ha-1 of fertilizer P remaining in solution, ready
for plant uptake.
Soil pH effect on P desorption
Phosphorus desorption is a primary control of inorganic P bioavailability, yet virtually nothing is known about the nature of P desorption in response to changing soil pH for acid, weathered tropical soils. Results from this study endorsed the hypothesis that P desorption increases with increasing soil pH. Both the decreased Langmuir K and increased amounts of P desorbed at elevated pH levels supported the positive relationship between pH and P desorption. Increased pH levels to 6.0 and 7.1 caused the release of an additional 0.2 to 1.0 and 0.7 to 2.7 kg ha-1 of
sorbed P into soil solution for prompt plant uptake. These results are consistent with the findings of He et al. (1994). He and associates determined P desorption from a variety of minerals and ranked the minerals according to their desorption capacity: goethite < kaolinite < amorphous Al oxide < montmorillonite. Affinity constants also decreased in the same order. The affinity constant, K, is related to the amount of P sorbed. Phosphate is held with its highest affinity to the soil surface when the surface coverage of sorbed P is low. The affinity then decreases with increasing surface coverage.
The calculated Kd for desorption represents the rate of change in the amount of P desorbed relative to the solution P concentration. Therefore, increasing
Kd is interpreted as increasing the rate of change in
P desorption at a particular solution P concentration, as was observed for all levels of P loading when soil pH was raised to 7.1. Similar results can be found among the limited P desorption studies previously reported (He et al., 1994; De Smet et al., 1998).
General consensus regarding the effect of soil pH on P desorption, drawn from the findings of these authors, is that increased P desorption with increased pH is due both to increased competition
with hydroxyl ions and to the change in electrostatic potential of the surface. However, this theory is still untested because it has not been convincingly shown that electrostatic repulsion affects the specifically sorbed anions that are directly coordinated to discrete surface metal cations. Given the lack of prior work on P desorption mechanisms, this area appears to be promising for further studies.
Phosphorus desorption is potentially controlled by the type of P complexation with the surface: monodentate, bidentate mononuclear, and bidentate binuclear. These complexes can be either non-protonated or non-protonated, depending on suspension pH (Tejedor-Tejedor & Anderson, 1990). Bidentate complexes require more activation energy to break the bond than do monodentate complexes, so it can be more difficult for P desorption to take place in environments where the bidentate complexes predominate between phosphate and the soil surface. In spite of precise investigations using infrared spectroscopy (Parfitt & Atkinson, 1976) and X-ray photoelectron spectroscopy (Martin & Smart, 1987), assigning peaks among possible complexation types remains controversial (Arai & Sparks, 2001; Kreller et al., 2002). Clarification of the effects of pH and P surface coverage on the formation of different surface-complex types may help to resolve these issues.
Environmental and socio-economic restrictions such as low pH, high P fixation capacity, and high costs of P fertilizer and liming materials make P management for humid, acid tropical soils problematic. Management strategies that make the most efficient use of P and lime are required. To this end, one objective should be to raise the soil solution P concentration, since it is directly related to plant P uptake. A small increment in solution P concentration increased through liming-induced P desorption should significantly influence plant growth. Combining the results from both parts of this study it is concluded that liming has a twofold positive effect. It reduces the amount of P sorbed and increases the amount of P desorbed. Both these changes induce increased solution P concentration and P bioavailability.
CONCLUSIONS
1. Phosphorus sorption decreases with increasing soil pH when solution P concentrations are less than about 3 µg mL-1 P. It is estimated that at a solution
concentration of 0.2 µg mL-1 P, 2.8 to 4.5 kg ha-1 of
added P remains in solution for plant uptake. 2. Phosphorus desorption increases with increasing soil pH at medium and high levels of P addition. The estimated increase in P desorption corresponds to a release of 0.2 to 2.7 kg ha-1 of sorbed
ACKNOWLEDGEMENTS
The Soil and Water Science Department of the University of Florida, USA, and Soka Alumni Association of Soka University, Japan, provided financial support. We specially thank Dr. Paulo Gabriel Nacif of the Federal University of Bahia, Brazil, for providing the soil samples and soil classification according to the Brazilian system. We are also grateful to Mary McLeod and Miranda Lucas for technical assistance. This research was supported by the Florida Agricultural Experiment Station, and approved for publication as Journal Series No. R-10804.
LITERATURE CITED
ANJOS, J.T. & ROWELL, D.L. The effect of lime on phosphorus adsorption and barley growth in three acid soils. Plant Soil, 103:75-82, 1987.
ARAI, Y. & SPARKS, D.L. ATR-FTIR spectroscopic investigation on phosphate adsorption mechanisms at the ferrihydrite-water interface. J. Colloid Interf. Sci., 241:317-326, 2001. ARIAS, J.S. & FERNANDEZ, P.G. Changes in phosphorus
adsorption in a Palexerult amended with limestone and/or gypsum. Comm. Soil Sci. Plant Anal., 32:751-758, 2001. BARBER, S.A. Soil-plant interactions in the phosphorus
nutrition of plants. In: KHASAWNEH, F.E., ed. The role of phosphorus in agriculture. Madison, ASA, 1980. p.591-615. BARROW, N.J. Influence of pH on a secondary effect of phosphate reaction: The decrease in sorption of newly added phosphate. Aust. J. Soil Res., 40:775-779, 2002.
BHATTI, J.S. & COMERFORD, N.B. Measurement of phosphorus desorption from a spodic horizon using two different desorption methods and pH control. Comm. Soil Sci. Plant Anal., 33:845-853, 2002.
CHEN, J. & BARBER, S.A. Effect of liming and adding phosphate on predicted phosphorus uptake by maize on acid soils of three soil orders. Soil Sci., 150:844-850, 1990.
DE SMET, J.; VANDERDEELEN, J. & HOFMAN, G. Effect of soil properties on the kinetics of phosphate release. Comm. Soil Sci. Plant Anal., 29:2135-2147, 1998.
ERNANI, P.R.; FIGUEIREDO, O.R.A.; BECEGATO, V. & ALMEIDA, J.A. Decréscimo da retenção de fósforo no solo pelo aumento do pH. R. Bras. Ci. Solo, 20:159-162, 1996. FRIED, M. & SHAPIRO, R.E. Soil plant relationships in ion
uptake. Ann. Rev. Plant Physiol., 12:91-112, 1961. GEE, G.W. & BAUDER, J.W. Particle size analysis. In: KLUTE,
A., ed. Methods of soil analysis, Part 1: Physical and mineralogical methods, 2.ed. Madison, ASA-SSSA, 1986. p.383-411 (Agronomy Monograph, 9)
GRIERSON, P.F.; COMERFORD, N.B. & JOKELA, E.J. Phosphorus mineralization and microbial biomass in a Florida Spodosol: Effects of water potential, temperature and fertilizer application. Biol. Fertil. Soils, 28:244-252, 1999.
HAYNES, R.J. Effects of liming on phosphate availability in acid soils – A critical review. Plant Soil, 68:289-308, 1982. HAYNES, R.J. & SWIFT, R.S. The effects of pH and drying on adsorption of phosphate by aluminium-organic matter associations. J. Soil Sci., 40:773-781, 1989.
HE, Z.L.; YANG, X.; YUAN, K.N. & ZHU, Z.X. Desorption and plant-availability of phosphate sorbed by some important minerals. Plant Soil, 162:89-97, 1994.
KRELLER, D.I.; GIBSON, G.; VAN LOON, G.W. & HORTON, J.H. Chemical force microscopy investigation of phosphate adsorption of the surfaces of iron(III) oxyhydroxide particles. J. Colloid Interf. Sci., 254:205-213, 2002.
MARTIN, R.R. & SMART, R.S.C. X-ray photoelectron studies of anion adsorption on goethite. Soil Sci. Soc. Am. J., 51:54-56, 1987.
MCKEAGUE, J.A. & DAY, J.H. Dithionite- and oxalate-extractable Fe and Al as aids in differentiating various classes of soils. Can. J. Soil Sci., 46:13-22, 1966.
MEHLICH, A. Determination of P, Ca, Mg, K, Na, and NH4 by North Carolina soil testing laboratories. Raleigh, North Carolina Soil Test Div., North Carolina Department Agriculture, 1953.
MOKWUNYE, U. The influence of pH on the adsorption of phosphate by soils from the Guinea and Sudan Savannah zones of Nigeria. Soil Sci. Soc. Am. Proc., 39:1100-1102, 1975.
MURPHY, J. & RILEY, J.P. A modified single solution method for the determination of phosphate in natural waters. Anal. Chim. Acta, 27:31-36, 1962.
NAIDU, R.; SYERS, J.K.; TILLMAN, R.W. & KIRKMAN, J.H. Effect of liming on phosphate sorption by acid soils. J. Soil Sci., 41:165-175, 1990.
NELSON, S.R. & SOMMERS, L.E. Total carbon, organic carbon, and organic matter. In: PAGE, A.L., ed. Methods of soil analysis, Part 2: Chemical and microbiological properties, 2.ed. Madison, ASA-SSSA, 1982. p.539-579 (Agronomy Monograph, 9)
OLIVEIRA, J.B.; HACOMINE, P.K.T. & CAMARGO, M.N. Classes gerais de solos do Brasil. 2.ed. Jaboticabal, FUNEP, 1992. 201p.
PARFITT, R.L. & ATKINSON, R.J. Phosphate adsorption on goethite (á-FeOOH). Nature, 264:740-742, 1976.
PEREIRA, J.R. & DE FARIA, C.M.B. Phosphorus sorption in some soils of the semi-arid region of the Brazilian Northeast. Pesq. Agropec. Bras., 33:1179-1184, 1998.
SANCHEZ, P.A. & UEHARA, G. Management considerations for acid soils with high phosphorus fixation capacity. In: KHASAWNEH, F.E., ed. The role of phosphorus in agriculture. Madison, ASA, 1980. p.471-514.
SAS INSTITUTE. SAS/STAT user’s guide: release 6.03 edition. Cary, SAS Institute, 1988. 1028p.
SMETHURST, P.J. & COMERFORD, N.B. Potassium and phosphorus uptake by competing pine and grass: Observation and model verification. Soil Sci. Soc. Am. J., 57:1602-1610, 1993.
SMYTH, T.J. & SANCHEZ, P.A. Effects of lime, silicate, and phosphorus applications to an Oxisol on phosphorus sorption and ion retention. Soil Sci. Soc. Am. J., 44:500-505, 1980. SOIL SURVEY STAFF. Soil taxonomy: a basic system of soil
classification for making and interpreting soil surveys. 2.ed. Washington, U.S. Department Agriculture, 1999. 869p. TEJEDOR-TEJEDOR, M.I. & ANDERSON, M.C. Protonation