E
NERGY AND
E
NVIRONMENT
Volume 5, Issue 1, 2014 pp.23-34
Journal homepage: www.IJEE.IEEFoundation.org
Numerical simulation of CO
2geological storage in saline
aquifers – case study of Utsira formation
Zheming Zhang, Ramesh K. Agarwal
Department of Mechanical Engineering & Materials Science, Washington University in St. Louis, MO 63130, USA.
Abstract
CO2 geological storage (CGS) is one of the most promising technologies to address the issue of excessive
anthropogenic CO2 emissions in the atmosphere due to fossil fuel combustion for electricity generation.
In order to fully exploit the storage potential, numerical simulations can help in determining injection strategies before the deployment of full scale sequestration in saline aquifers. This paper presents the numerical simulations of CO2 geological storage in Utsira saline formation where the sequestration is
currently underway. The effects of various hydrogeological and numerical factors on the CO2 distribution
in the topmost hydrogeological layer of Utsira are discussed. The existence of multiple pathways for upward mobility of CO2 into the topmost layer of Utsira as well as the performance of the top seal are
also investigated.
Copyright © 2014 International Energy and Environment Foundation - All rights reserved.
Keywords: CO2 geological storage; Numerical simulation; Saline aquifer; Utsira formation.
1. Introduction
The majority of the ever-growing electricity demand worldwide is currently satisfied by the massive construction of fossil fuel-based power plants. However, with recent concerns on CO2 emissions from
fossil fuel based (especially coal-fired) power plants, there has been major emphasis on the development of safe and economical CO2 capture and storage technology worldwide. Although requiring a small
amount of energy for the CO2 capture, the proposed CO2 capture processes such as oxy-fuel [1] and
chemical-looping combustion [2] have made significant progress in obtaining highly concentrated pure CO2 after combustion. On the other hand, the technology of CO2 geological storage (CGS) appears to be
less ready for practical industrial-scale carbon reduction. Among all possible carbon sinks for sequestration, deep saline aquifers are quite attractive because of their huge sequestration capacity in US and other parts of the world with relatively smaller environmental risk [3]. However, in order to fully exploit their potential for CGS, the injection strategies need to be investigated that can address the issues of both the CO2 storage efficiency and safety along with its economic feasibility. Numerical simulations
can be employed to determine these strategies before the actual deployment of large scale sequestration in saline aquifers with enormous investment. For this purpose, DOE numerical simulator TOUGH2 (Transport of Unsaturated Groundwater and Heat, version 2.0) has been widely used worldwide to determine a-priori the CO2 storage capacity of a saline aquifer and for risk assessment [4-6]. The
step size based on the numerical residues at each iteration of the numerical solution process [4-6]. In this paper, all simulation cases have been conducted using the single-node (non-parallel) version of TOUGH2.
Numerical simulations of existing CGS projects can help in identifying the uncertainties in CGS numerical simulations due to lack of accurate information about the hydrogeological properties of the aquifer as well as can provide important insights in the flow transportation phenomena that are essential for determining good estimates of its storage capacity and environmental risk [7]. Dozens of pilot projects have been initiated worldwide for CGS in saline formations. This paper presents the numerical simulations of CO2 geological storage in Utsira saline aquifer using TOUGH2. We have investigated the
effects of various modeling and operational factors such as the reservoir temperature, pressure, permeability, porosity, the hysteresis of relative permeability and capillary pressure, geological formation topography etc. on the fate of injected CO2 in this aquifer. Although other researchers have
also addressed such topics previously [8-15], it is hoped that this work could bring some new insights as well as provide better understanding of the nature of CGS and guidelines for best practices in its deployment.
2. Numerical simulation of CGS in Utsira saline formation
The Sleipner CGS project near Norwegian coast of North Sea is probably the most well-known and successful saline aquifer CGS demonstration to date. It has the most detailed topographic description, industrial-scale injection, and long-term monitoring data available. However, major uncertainties still exist for accurate reservoir-size simulation of the Sleipner project. Simulation studies of Sleipner project can be very helpful in understanding the actual fate of in-situ CO2 in Utsira. Utsira formation at the
injection site can be identified as nine layers of sandstone sandwiched by shale [8-10]. A generalized layered Utsira model [10] and a detailed Utsira Layer #9 model [11-15] have been established based on the available seismic surveys of Utsira formation and the monitoring data of Sleipner CGS project. The generalized Utsira model is employed to provide quick approximate estimation of upward CO2 migration
flux. The detailed Layer #9 model is developed to accurately history-match the seismic images of CO2
migration in the topmost layer in the first ten years of injection employing the numerical simulations.
2.1 Generalized Utsira model
For this simulation, Utsira formation is modeled as a cylindrical domain with 40 km in radius and 190 m in height, packed with nine layers of sand and shale as shown in Figure 1. The most important hydrogeological and numerical parameters for the simulation are summarized in Table 1. It should be noted that each hydrogeological layer consists of several layers of computational cells. Injection takes place at the bottom layer with a rate of approximately 1 million tons per year. The axisymmetric cylindrical model of Utsira formation consists of 3913 computational cells, with cell volume ranging from 3.825×10³ m3 to 4.05×10⁹ m3.
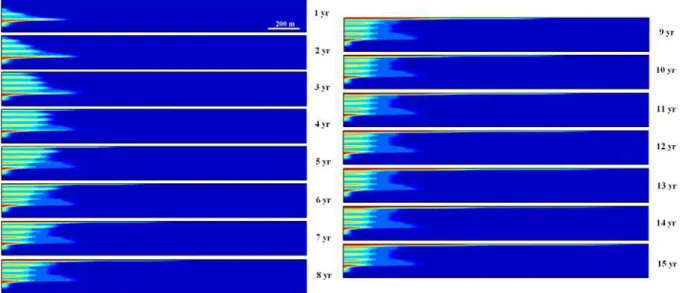
Evolution of CO2 plume for 15 consecutive years since the beginning of injection is shown in Figure 2.
The upside-down pyramid shaped sub-plume suggests strong secondary-sealing effect for upward CO2
migration, due to which there is no CO2 contact with the topmost caprock after two years of injection and
very limited contact by the third year. However, in situ CO2 migrates laterally at an overestimated rate
upon reaching the caprock, failing to yield reasonable predictions of plume migration in the later years. Later simulations suggest that lack of permeability anisotropy and caprock topography could be the reason for this plume behavior.
Table 1. Hydrogeological properties used in the generalized nine-layer Utsira model
Number of Layers (sand) 5
Number of Layers (shale) 4
Layer Thickness (sand) Bottom layer: 70 m; other layers: 25 m
Layer Thickness (shale) 5 m
Permeability (sand) 3 Darcy
Permeability (shale) 10 mDarcy
Porosity (sand) 0.42
Porosity (shale) 0.1025
Temperature 37oC
Pressure (bottom) 11 MPa
Injection Rate 30 kg/s
Relative Permeability van Genuchten-Mualem Liquid Phase Residual Saturation 0.2
Supercritical Phase Residual Saturation 0.05
van Genuchten Exponent 0.4
Capillary Pressure van Genuchten-Mualem
Entry Pressure 3.58 kPa
Figure 2. CO2 footprint within the Utsira formation for 15 years since the beginning of injection
The in-situ CO2 has strong potential to migrate upward because of buoyancy, and thus accumulate under
the caprock until the capillary barrier is compromised. Previous experience has demonstrated that the accumulation of CO2 under the caprock begins at relatively early stage compared to the entire lifespan of
the entire CGS project, and this is a major concern for storage security [16]. As seen from Figure 2, the lateral extent of CO2 plume evolves rapidly after reaching the caprock after about the third year of
injection (year 1999). There is some overestimation of lateral CO2 migration in the numerical simulation
compared to the site-observed CO2 plume; it is discussed later in the paper. The analysis presented in this
paper suggests that inaccurate modeling of permeability and formation topography may be the primary cause of this overestimation. Although it may not be perfectly suitable for providing an accurate prediction of the plume migration under the caprock, the generalized Utsira model nevertheless holds great promise in determining an acceptable estimate of the accumulation of CO2 and its tendency of
made for the topmost sandstone layer of Utsira (hydrogeological layer #9) as shown in Figure 3. Excellent agreement is observed between the simulation and the seismic amplitudes analysis [11, 15].
Figure 3. Supercritical CO2 accumulation in topmost sandstone layer (Layer # 9) of Utsira formation
2.2 Detailed Utsira layer #9 model
As mentioned previously, CO2 migration within Layer #9 describes the ultimate trapping of in- situ CO2
and thus is of great interest. In Figure 4, field data shows striking growth in CO2 accumulation in Layer
#9 between 1999 and 2006 [11].
Figure 4. Amplitude maps of Layer #9: 1999 to 2006 [11]
The black dot in Figure 4 indicates the location of the injection well, which is roughly 200 m under Layer #9. Two distinct local CO2 accumulations appear after about three years of injection (recall that
injection began in 1996) indicating that CO2 began to accumulate under the caprock. CO2 migration
under Layer #9 is not symmetric due to the topography of the caprock. The northward migration of initially accumulated CO2 implies a local topographic dome, as seen from the “body” of the plume in
Figure 4; a prominent north-tending migration implies the spill of local structurally trapped CO2 along a
north-tending topographic ridge seen as the “finger” of the plume in Figure 4. CO2 migration along the
north-tending ridge has been rather fast at about 1 m/day between 2001 and 2004 [11].
time. To ensure the accurate capture of topographic effect on plume shaping, computational domain with considerably fine mesh resolution was modeled for Layer #9 based on geological survey data. It is important to note that CO2 has to breakthrough several layers of relatively low permeable shale prior to
reaching the topmost layer. While it remains difficult to quantify the breakthrough of supercritical CO2,
the quantification of CO2 accumulation within the topmost layer (Layer #9) is rather reliable. Therefore,
a model of only the topmost layer (Layer #9) is sufficient to investigate the effect of parameters such as topography, permeability, porosity etc. on the shape of CO2 plume.
A reservoir model with dimension of 1600 m × 4900 m with varying thickness was constructed. It covers the portion of the Utsira formation where the plume resides as shown in Figure 4. As mentioned earlier, the topography of this portion of Utsira formation can be accurately modeled based on the seismic geological survey data (provided by Zhu and Lu of Indiana University [17]) with 50 m × 50 m mesh resolution. The thickness of the computational domain varies from 3.5 m to 26.3 m with an average thickness of 11.3 m. The Layer #9 model consists of 122100 computational cells with average cell volume of about 1.024×10⁵ m3. In order to accurately capture the upward and lateral movement of accumulated CO2, the domain is vertically discretized into 37 layers of computational cells. The topmost
layer and bottom two layers represent the low permeable shale, while the 34 layers in the middle have the properties of porous sandstone. Permeability anisotropy is considered in the Layer #9 model. The topography of Layer #9 model is shown in Figure 5 and its detailed hydrogeological properties are summarized in Table 2.
Figure 5. 3D View and plan view of Utsira layer #9 model with locations of main feeder (black dot) and secondary feeder (blue cyan square)
Table 2. Hydrogeological properties used in Utsira layer #9 model
Temperature
33o C / 36o C
Pressure
8.6 MPa
Total Utsira Formation Area
26100 km2
Total Utsira Formation Thickness 50 m – 300 m
Layer #9 Area 1600 m × 4900 m
Layer #9 Thickness 3.5 m – 26.3m
Shale Permeability W-E: 0.001 mDarcy, N-S: 0.001 mDarcy, Vertical: 0.0001 mDarcy Sandstone Permeability W-E: 2 Darcy, N-S: 10 Darcy, Vertical: 200 mDarcy
Utsira Porosity (Shale/Sandstone)
35.7 %
Residual CO2 Saturation
0.02 Residual Brine Saturation
0.11 Relative Permeability Type
Corey/van Genuchten-Mualem
Capillary Pressure
none Pore-Water Salinity
3.3 %
Boundary Conditions No flow on top and bottom boundaries; Fixed state on four lateral boundaries
It should be noted that in Layer #9 model, the source of CO2 is identified as “feeder” but not “injector” to
emphasize that CO2 is fed from lower aquifer through leakage pathways rather than by direct injection.
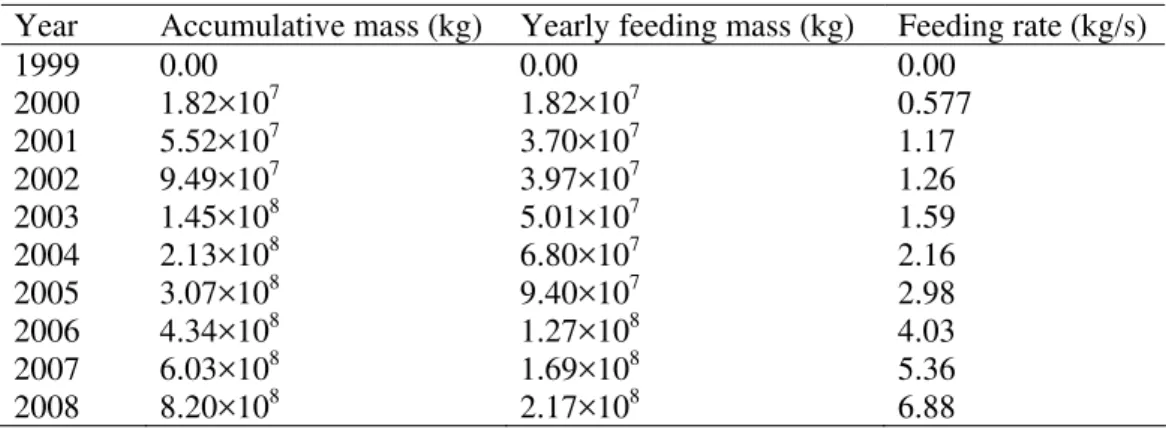
previous results (Figure 3) as summarized in Table 3. It can be seen that CO2 feeding rate for Layer #9
keeps on increasing for the recorded nine years.
Table 3. Accumulative CO2 mass in Utsira layer #9, 1999-2008
Year Accumulative mass (kg) Yearly feeding mass (kg) Feeding rate (kg/s)
1999 0.00 0.00 0.00
2000 1.82×10⁷ 1.82×10⁷ 0.577
2001 5.52×10⁷ 3.70×10⁷ 1.17
2002 9.49×10⁷ 3.97×10⁷ 1.26
2003 1.45×10⁸ 5.01×10⁷ 1.59
2004 2.13×10⁸ 6.80×10⁷ 2.16
2005 3.07×10⁸ 9.40×10⁷ 2.98
2006 4.34×10⁸ 1.27×10⁸ 4.03
2007 6.03×10⁸ 1.69×10⁸ 5.36
2008 8.20×10⁸ 2.17×10⁸ 6.88
Recalling the observed secondary-sealing effect in the previous simulation described in section 2.1, it is the pressure gradient between the supercritical CO2 phase pressure in the lower aquifer and the capillary
pressure in the overlying shale layer that determines the breakthrough of CO2 and its flow rate. When
breakthrough first occurs, the pressure gradient facilitates the breakthrough from the equilibrium state resulting in relatively low breakthrough mass flux to Layer #9. However, as more CO2 accumulates, the
pressure gradient gradually increases and leads to increasing breakthrough mass flux. A 9-year average feeding rate of about 2.89 kg/s can be estimated from Table 3. The effect of both the 9-year average and the time-dependent feeding rate are investigated in the following simulations.
The significant northward-tending plume finger is rather surprising for regular pressure-gradient driven Darcy flow. Analysis suggests three possible explanations for the prominent north-tending CO2 finger
along the ridge; these are: (1) significantly higher permeability applied at the ridge, (2) existence of northward geological slope which enhances the buoyancy-driven migration along the ridge, and (3) existence of a secondary (or multiple) CO2 pathway under the ridge. The hypothesis of significantly
higher permeability at the ridge can be easily ruled out since no such evidence is obtained from the geological survey. Existence of geological slope of 5.8 m/km [11] has already been considered in the description of the topography of top-seal. Considering all three uncertainties mentioned above, a total of seven simulations are conducted as summarized in Table 4.
Table 4. Seven simulation runs for the Utsira layer #9 model
Feeder(s) Feeding rate Boundary condition Reservoir temperature (oC)
1 Single 9-year average Open 33
2 Single Time-dependent Open 33
3 Two 9-year average Open 33
4 Two Time-dependent Open 33
5 Two Time-dependent Semi-open 33
6 Two Time-dependent Semi-open 36
7 Two (modified) Time-dependent Semi-open 36
The simulation time is set at nine years, which corresponds to the injection period of 1999~2008. CO2
plume migration at the topmost computational layer is examined for each year. The goal is to obtain the best history matching to the field seismic images by conducing the seven simulations, and thus to provide insights on the importance of the modeling uncertainty.
In Figure 6, the CO2 plume migration develops in a seemingly isotropic fashion at early stages. Then
local migration of CO2 along the north-tending ridge is captured in the simulations including the small
amount of spill southward. However, two major issues need to be addressed (when comparing to the seismic images). First, the size of the plume is significantly large, especially for years 2000 and 2001. Second, northward CO2 migration along the ridge, which reaches y = 3000 m by 2008 in the simulation,
captured by the seismic images. In addition, CO2 plume appears to migrate faster along the east-west
direction.
Figure 6. CO2 plume at top layer, 2000~2008, case#1
Figure 7. CO2 plume at top layer, 2000~2008, case #2
Time-dependent CO2 feeding scenario is introduced in the simulation shown in Figure 7. Because this is
a more realistic CO2 feeding scenario, computed plume size at early stage is greatly improved resulting
in good match with the history data. However, the issue of underestimation of the northward migration of CO2 along the ridge becomes worse, due to the lower value of the major driving force for CO2 migration
– the pressure gradient between the feeder and the ambient aquifer. Therefore, less amount of CO2 is
“pushed” to the north-tending ridge in the same time period. Although the pressure gradient gradually increases with increase in the feeding rate, the migration along the ridge is still compromised due to insufficient migration duration. Additionally, the southern CO2 spill seems to be overestimated for year
2008. Greater east-west migration still remains.
The simulations of case #1 and case #2 imply that a single feeder is not likely to lead to sufficient plume migration along the north-tending ridge due to lack of a driving force. Since supercritical CO2 enters
Layer #9 by overcoming capillary pressure barrier of the underlying shale layer, it is generally believed that CO2 feeding into Layer #9 is supplied by multiple possible pathways from the lower aquifers due to
heterogeneity in the formation properties. Therefore, the effect of the existence of an additional feeder near the ridge is investigated. The location of the secondary feeder is set at x = 8925 m, y = 2210 m [17], as shown in Figure 5. Additionally, it is assumed that 100% of CO2 is distributed by the main feeder
during 1999 to 2001, and 85% of CO2 is distributed by the main feeder with rest 15% distributed by the
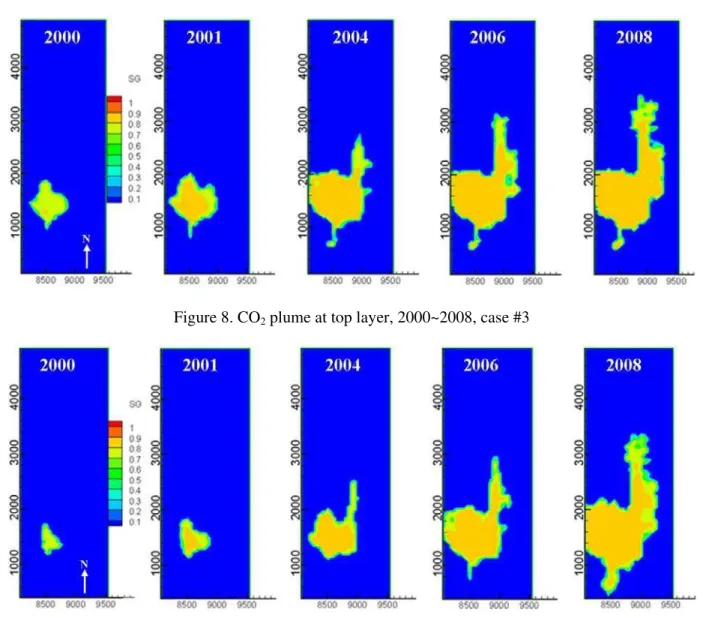
Figure 8 gives the simulation results under the existence of two feeder scenario with 9-year average feeding rate. Compared to the results for single feeder scenarios, plume migration along the north-tending ridge for the two feeder scenario has improved as expected. However, overestimation of plume migration at early stage still occurs, as CO2 feeding from the secondary feeder is inactive during the early
stage. Additionally, the overestimation of west-east plume movement still persists.
Figure 8. CO2 plume at top layer, 2000~2008, case #3
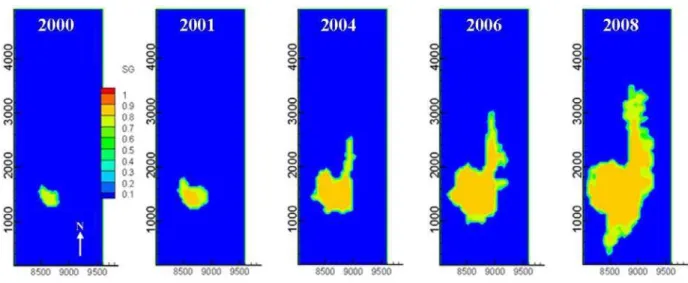
Figure 9. CO2 plume at top layer, 2000~2008, case #4
In Figure 9, time-dependent feeding rate is applied for the two feeder scenario designated as case #4. For this case, early stage plume migration is well captured and plume migration along the north-tending ridge in later years is also improved. Nevertheless, a close comparison with the field data suggests additional work needs to be done to treat the overestimated west-east migration and further increase in the northward migration along the ridge. First, the boundary condition is modified. Closed boundary condition is applied to the western and eastern lateral boundaries, while open boundary condition is maintained at the northern and southern lateral boundaries, making the computational domain semi-open. Since the total CO2 accumulation amount is identical, reduced migration along east-west direction will
force more CO2 to migrate along the north-south direction. Physically such semi-open boundary
condition implies that CO2 plume experiences more resistance when it migrates along the west-east
direction.
Figure 10. CO2 plume at top layer, 2000~2008, case #5
As mentioned earlier, the only two types of driving force for plume migration are pressure gradient and buoyancy. Application of semi-open boundary condition is to essentially enhance the pressure gradient. On the other hand, a more intuitive way to enhance buoyancy is to decrease CO2 density. In the previous
simulations, given reservoir conditions led to pure supercritical CO2 density of about 630~650 kg/m3.
However, the injected gas for Sleipner GCS project is not pure supercritical CO2, but a 98% CO2 and 2%
methane mixture 14. Because methane is significantly lighter than CO2, it is expected to migrate upward
and concentrate in Layer #9 faster than CO2. With the concentration of methane, it will effectively lower
the density and increase the buoyancy of the CO2-methane mixture. Since TOUGH2 does not possess the
ability of modeling CO2-methane mixture in saline aquifer, a workaround of compensating the density
loss of pure CO2 is to increase the reservoir temperature. Following Zhu’s suggestion [17], the density of
CO2-methane mixture is in the range of 600 kg/m3. Retaining other reservoir conditions the same, it
requires raising the reservoir temperature by 3 oC to have CO2 density the same as the density of CO2
(98%) - methane (2%) mixture at actual reservoir conditions. The increased reservoir temperature causes a drop in pore-water’s density and viscosity which however is negligible compared to that of CO2.
Therefore in the following simulations, reservoir temperature is increased from 33 oC to 36 oC to enhance the mobility of in-situ CO2. It should also be noted that in Chadwick and Noy’s work, the temperature of
the reservoir was also numerically elevated by 3 oC in order to compensate for the methane contamination [11].
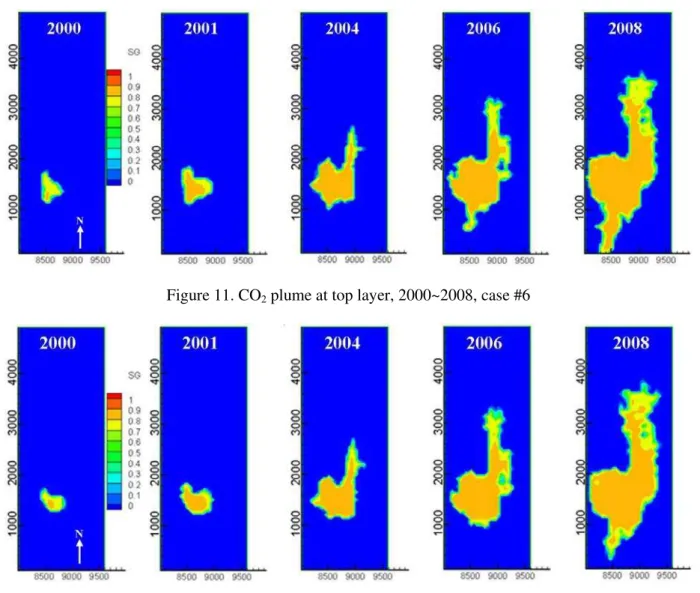
As shown in Figure 11, the increased reservoir temperature greatly enhances the plume migration in north-south direction as expected. Meanwhile, east-west migration is still confined by the semi-open boundary condition. In Figure 11, the plume shape at each year matches quite well with the corresponding seismic images. The northeast migration reaches about y = 3300 m in 2006, which is in the same ballpark as obtained by the seismic image. The only concern is that the southward migration still appears to be overestimated in 2008. It is possible that the increased buoyancy leads to over-spill towards south.
To treat the over-spill of CO2 to the south after 2006, the main feeder is relocated 100 m to the east and
200 m to the north. As shown in Figure 12, CO2 over-spill to the south is avoided by the slightly
modified main feeder location. Case #7 gives satisfactory results and matches the seismic images as shown in Figure 12.
Under the model of case #7, the time-lapse in-situ CO2 fraction in both supercritical and aqueous phases
is examined as shown in Figure 13 (a). Recalling the increasing CO2 feeding rate over time as shown in
Figure 3 and Table 3, the nearly flat aqueous CO2 fraction since year 2000 implies that the dissolution of
CO2 into the ambient brine also has strong tendency to increase, which is typically associated with the
Figure 11. CO2 plume at top layer, 2000~2008, case #6
Figure 12. CO2 plume at top layer, 2000~2008, case #7
(a) (b)
Figure 13. (a) CO2 phase distribution in layer #9; (b) CO2 accumulation in caprock
However, the overall dissolution of CO2 in Layer #9 remains insignificant (less than 10%) for most of the
time. To evaluate the leakage risk posed by the accumulation of supercritical CO2 in Layer #9, the
presence of CO2 in the caprock is examined as shown in Figure 13(b). It is seen that the infiltration of
in-situ CO2 into the caprock only accounts for less than a quarter thousandth of the total CO2 accumulation,
which assures the performance of the caprock as an effective geological CO2 seal.
(vertical permeability to W-E permeability) of 1:10 has to be employed to accurately capture the upward migration of CO2. Horizontal anisotropy (W-E permeability to N-S permeability) of 2:10 has to be
employed to capture the northern spill of CO2 into the north-tending ridge. Second, a secondary feeder is
likely to exist directly under the north-tending ridge to generate sufficient plume migration along the ridge. It suggests multiple pathways for CO2 breakthrough from the lower aquifer structure. Third, the
fact that injection gas being CO2 -methane mixture is very important in modeling since the presence of
methane enhances the buoyancy. Fourth, it is critical that the time-dependent CO2 injection is modeled.
This is consistent with the behavior of CO2 path flow breaking the capillary pressure barrier. Fifth, the
simulation suggests that over 90% of CO2 will remain in supercritical phase in Layer #9 during the
injection, which is to increase the risk of caprock integrity. Finally, simulation results suggest strong mobility of supercritical CO2 under the caprock (shale) without major leakage, implying that the caprock
serves well as a non-permeable CO2 barrier.
3. Conclusion
A well-known large scale saline formation, namely the Utsira formation, has been numerically modeled to study the CO2 geological storage, in particular the CO2 plume migration. The results of Utsira CGS
nicely match the CO2 migration flux data and time-lapsed seismic images for the on-going Sleipner CGS
project. It suggests that the secondary-sealing effect due to the stratification of aquifer appears to be very effective in retarding the upward migration of mobile CO2. It also reveals that caprock topography,
permeability anisotropy, and contamination of injected CO2 could all have game-changing effects on the
fate of in-situ CO2. Overall, numerical simulations of saline aquifer CGS and history-matching of the
CO2 plume evolution are challenging due to significant uncertainties in the knowledge about formation
properties such as its heterogeneity and topography, and the limitations of the numerical solver in modeling and simulation. Nevertheless, once properly modeled, the numerical simulations can capture the phenomena of interest with satisfactory degree of accuracy and provide important insights into CO2
migration and reservoir performance.
References
[1] Buhre B.J.P., Elliott L.K., Sheng C.D., Gupta R.P., and Wall T.F. Oxy-fuel combustion technology for coal-fired power generation. Progress in Energy and Combustion Technology Science, 2005, 31 (4), pp 283-307.
[2] He F., Li H., and Zhao Z. Advancements in development of chemical-looping combustion: a review. International Journal of Chemical Engineering, 2009, 2009, Article ID 710515, 16 pages. [3] US Department of Energy. 2010 carbon sequestration atlas of the United States and Canada, 3rd
Edition, 2010.
[4] Pruess K. TOUGH2: a general numerical simulator for multiphase fluid and heat flow. Lawrence Berkeley Laboratory Report LBL-29400, Berkeley, California, 1991.
[5] Pruess K. The TOUGH codes - a family of simulation tools for multiphase flow and transport processes in permeable media. Vadose Zone Journal, 2004, 3, pp 738–746.
[6] Pruess K., Oldenburg C., and Moridis G. TOUGH2 user’s guide, version 2.0 (revised). Lawrence Berkeley Laboratory Report LBL-43134, Berkeley, California, 2011.
[7] Class H., Ebigbo A., Helmig R., Dahle H.K., Nordbotten J.M., Celia M.A., et al. A benchmark study on problems related to CO2 storage in geologic formations. Computational Geosciences,
2009, 13 (4), pp 409-434.
[8] Bickle M., Chadwick A., Huppert H.E., Hallworth M., and Lyle S. Modeling carbon dioxide accumulation at Sleipner: implications for underground carbon storage. Earth and Planetary Science Letters, 2007, 255 (1-2), pp 164–176.
[9] Chadwick R.A., Zweigel P., Gregersen U., Kirby G.A., Holloway S., and Johannessen P.N. Geological reservoir characterization of a CO2 storage site: the Utsira sand, Sleipner, northern
North Sea. Energy, 2004, 29, pp 9-10.
[10] Audigane P., Gaus I., Czernichowski-Lauriol I., Pruess K., and Xu T. Two-dimensional reactive transport modeling of CO2 injection in a saline aquifer at the Sleipner site. American Journal of
Science, 2007, 307, pp 974-1008.
[12] Arts R., Eiken O., Chadwick R.A., Zweigel P., van der Meer L., and Zinszner B. Monitoring of CO2 injected at Sleipner using time-lapse seismic data, 2004, Energy, 29, pp 9-10.
[13] Arts R., Chadwick R.A., Eiken O., Thibeau S., and Nooner S. Ten years’ experience of monitoring CO2 injection in the Utsira sand at Sleipner, offshore Norway. First Break, 2008, 26, pp 65-72.
[14] Chadwick R.A., Arts R., Eiken O., Kirby G.A., Lindberg E., and Zweigel P. 4D seismic imaging of an injected CO2 plume at the Sleipner field, central North Sea. Geological Society of London,
Memoirs, 2004, 29, pp 311-320.
[15] Singh V., Cavanagh A., Hansen H., Nazarian B., Iding M., and Ringrose P. Reservoir modeling of CO2 plume behavior calibrated against monitoring data from Sleipner, Norway. Society of
Petroleum Engineers Annual Technical Conference and Exhibition, Florence, Italy, 2010.
[16] Zhang Z. and Agarwal R. Numerical Simulation of geological carbon sequestration in saline aquifers, three case studies. in: Proceedings of 12th Annual Conference on Carbon Capture Utilization & Sequestration, Pittsburgh, US, 2013.
[17] Zhu C. and Lu P. Personal communication. Department of Geological Sciences, University of Indiana, 2012.
Zheming Zhang is a PhD student in the department of Mechanical Engineering & Materials Science at
Washington University in St. Louis, USA. He holds a B.S degree in mechanical engineering from Tsinghua University, and a M.S degree from Washington University in St. Louis. His research interests are in the applications of computational fluid dynamics and optimizations to the study of carbon capture and geological sequestration and other clean energy solutions. He is a member of NSPE, ASME, and SPE.
E-mail address: [email protected]
Ramesh K. Agarwal received the Ph.D degree in aeronautical sciences from Stanford University, Palo
Alto, CA, USA in 1975. His research interests are in the theory and applications of computational fluid dynamics to study the fluid flow problems in aerospace and renewable energy systems. He is currently the William Palm Professor of Engineering in department of Mechanical Engineering and Materials Science at Washington University in St. Louis, MO, USA. He is a Fellow of ASME, AIAA, IEEE, and SAE.
Email address: [email protected]