Transcriptome of
Dendrocalamus latiflorus
(Poaceae:
Bambusoideae)
Xue-Mei Zhang., Lei Zhao., Zachary Larson-Rabin., De-Zhu Li, Zhen-Hua Guo*
Plant Germplasm and Genomics Center, Germplasm Bank of Wild Species, Kunming Institute of Botany, Chinese Academy of Sciences, Kunming, Yunnan, China
Abstract
Background:Transcriptome sequencing can be used to determine gene sequences and transcript abundance in non-model species, and the advent of next-generation sequencing (NGS) technologies has greatly decreased the cost and time required for this process. Transcriptome data are especially desirable in bamboo species, as certain members constitute an economically and culturally important group of mostly semelparous plants with remarkable flowering features, yet little bamboo genomic research has been performed. Here we present, for the first time, extensive sequence and transcript abundance data for the floral transcriptome of a key bamboo species,Dendrocalamus latiflorus,obtained using the Illumina GAII sequencing platform. Our further goal was to identify patterns of gene expression during bamboo flower development.
Results:Approximately 96 million sequencing reads were generated and assembledde novo, yielding 146,395 high quality unigenes with an average length of 461 bp. Of these, 80,418 were identified as putative homologs of annotated sequences in the public protein databases, of which 290 were associated with the floral transition and 47 were related to flower development. Digital abundance analysis identified 26,529 transcripts differentially enriched between two developmental stages, young flower buds and older developing flowers. Unigenes found at each stage were categorized according to their putative functional categories. These sequence and putative function data comprise a resource for future investigation of the floral transition and flower development in bamboo species.
Conclusions:Our results present the first broad survey of a bamboo floral transcriptome. Although it will be necessary to validate the functions carried out by these genes, these results represent a starting point for future functional research onD. latiflorusand related species.
Citation:Zhang X-M, Zhao L, Larson-Rabin Z, Li D-Z, Guo Z-H (2012)De NovoSequencing and Characterization of the Floral Transcriptome ofDendrocalamus latiflorus(Poaceae: Bambusoideae). PLoS ONE 7(8): e42082. doi:10.1371/journal.pone.0042082
Editor:Michael N. Nitabach, Yale School of Medicine, United States of America
ReceivedMarch 1, 2012;AcceptedJuly 2, 2012;PublishedAugust 14, 2012
Copyright:ß2012 Zhang et al. This is an open-access article distributed under the terms of the Creative Commons Attribution License, which permits unrestricted use, distribution, and reproduction in any medium, provided the original author and source are credited.
Funding:This project was supported by the Knowledge Innovation Project of the Chinese Academy of Sciences (KSCX2-YW-N-067); the National Natural Science Foundation of China (30990244); NSFC-Yunnan province joint foundation (U1136603); Scientific Research Foundation for the Returned Overseas Chinese Scholars, State Education Ministry and the Young Academic and Technical Leader Raising Foundation of Yunnan Province (No. 2008PY065, awarded to Z-HG); Yunnan Provincial Government through an innovation team program; the Western Light Talent Culture Project of the Chinese Academy of Sciences (No. 2010312D11035, awarded to X-MZ). The funders had no role in study design, data collection and analysis, decision to publish, or preparation of the manuscript.
Competing Interests:The authors have declared that no competing interests exist. * E-mail: guozhenhua@mail.kib.ac.cn
.These authors contributed equally to this work.
Introduction
The advent of next-generation sequencing (NGS) technologies such as the Illumina Solexa, Roche 454, and ABI SOLiD platforms has revolutionized biological research by providing genomic and transcriptomic data cheaply and rapidly [1]. Advanced research in many areas, including resequencing [2], small RNA expression profiling [3], DNA methylation [4], andde novo transcriptome sequencing (RNA-Seq) of non-model organ-isms, has been performed (e.g. [5,6,7,8,9]). RNA-Seq enables high-throughput sequencing of double-stranded cDNA fragments, followed either by direct mapping of the sequences to a reference genome, or byde novosequence assembly for annotation [10,11]. The Illumina deep sequencing technology, which generates large-scale reads (75–150 bp) at lower costs, has been especially useful forde novotranscriptome studies [12,13,14,15,16]. This method has
led to a dramatic acceleration in gene discovery [17,18,19] and rapidly broadened our understanding of the complexity of gene regulation and gene networks [20,21,22]. However, many taxonomic groups that are important for theoretical and/or practical reasons have not been sufficiently explored, and the bamboos constitute such a case.
panda, mountain gorilla, lemur, mountain bongo, Tylonycteris pachypusandGeochelone yniphora. Woody bamboos have also been a significant natural resource with a long history of varied uses, ranging from food to raw materials for construction and manufacturing [24,25,26,27]. However, these resources, and the animals and human communities that depend on them, are now threatened, since up to half of the woody bamboo species in the world are in danger of extinction [28,29,30,31,32]. The problem of wild bamboo sustainability is exacerbated by two reproductive traits common to the more economically and culturally important woody species: semelparity and mast flowering with long intermast periods [32]. Semelparity is not surprising since these species are grasses. However, the enigmatically long intermast period, from 3 to 150 years depending on the species, makes breeding programs with these ‘‘crop’’ plants impossible. Moreover, even if the problem of the long intermast period could be solved, pollen abortion, or sterility causing fruitlessness, would still hamper breeding efforts in bamboo [33]. Determination of the genetic pathways and specific genes involved in bamboo flowering and flower development could be beneficial for both humans and wildlife. However, limited by the availability of tissue samples or genomic information, little research has been performed to address these issues. Several putative flowering-related genes have been identified from certain bamboo species [34,35,36,37,38] and environmental and chemical manipulations have been found to induce bamboo floweringin vitro[39], but the genetic control of bamboo reproductive development continues to be an under-researched area.
The goal of this study was to characterize the transcriptomes of developing flowers in the bamboo species Dendrocalamus latiflorus, using high-throughput Illumina GAII sequencing. D. latiflorus is one of the most important bamboo species, because of its use in food and construction, and limited molecular research on its flowering has already been performed [34,35,38]. To determine the genes involved in floral development of this species, transcripts from two phases of flower growth were isolated, quantified and sequenced. These transcriptome sequences were then annotated by BLASTing against public databases. Subsequently, the annotated sequences were clustered into putative functional categories using the Gene Ontology (GO) framework and grouped into pathways using the Kyoto Encyclopedia of Genes and Genomes (KEGG). Finally, D. latiflorus ESTs were assigned putative homologs in model species, includingArabidopsis thaliana,
Oryza sativa,Brachypodium distachyonand other relatives in the grass family to determine whether a hierarchy of gene regulation may persist between these species. This study represents the first exploration of the D. latiflorus inflorescence transcriptome using large-scale high-throughput sequencing, and the results described herein may serve to guide further gene expression and functional genomic studies in bamboos.
Results and Discussion
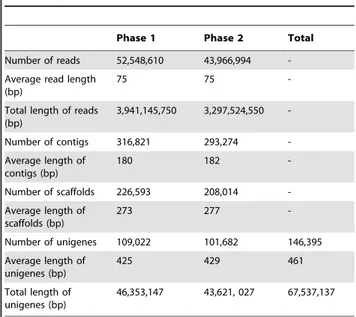
cDNA sequence generation andde novoassembly A total of approximately 96 million (,52 million and,44 million for phases 1 and 2, respectively) 75 bp paired-end reads were obtained after cleaning and quality checks were performed (cf. Materials and Methods). Assembly of reads resulted in 316, 821 and 293,274 contigs with mean sizes of 180 bp and 182 bp for phases 1 and 2, respectively (Table 1). Paired-end joining produced 226,593 and 208,014 scaffolds with mean sizes of 273 bp and 277 bp in phases 1 and 2, respectively. After further gap filling, the scaffolds were assembled into 109,022 unigenes for phase 1 with a mean length of 425 bp and 101,682 unigenes for phase 2 with a mean
length of 429 bp (Table 1). Clustering via TGICL software [40] was used to generate 146,395 unigenes (about 67.5 Mb total length of unigenes) from phases 1 and 2 with a mean size of 461 bp (cf. Materials and Methods). The size distributions of contigs, scaffolds and unigenes were compiled (Figure S1).
Functional annotation of the flower transcriptome ofD. latiflorus
A total of 80,418 (54.9%)D. latiflorusunigenes were significantly matched to known genes in the public databases (Table S1), representing putative functional identifications for more than half of the assembled sequences. Previous studies have shown that approximately 87% of Arabidopsis 454-derived ESTs could be aligned to predicted genes [41], while 72% could be similarly identified in cucumber [42] and 64% in human using the RefSeq database of well-annotated human genes [43]. As such, this study succeeded in assigning putative identification to a significant proportion of the discoveredD. latiflorusfloral transcripts given the lack of genomic information for this species. In fact, ‘‘non-BLASTable’’ sequences have been reported in all studied plant transcriptomes, with the proportion varying from 13 to 80%, depending on the species, the sequencing depth and the parameters of the BLAST search [8,9,44,45]. Excepting the technical issues derived from sequencing, biological factors may be responsible for the large population of non-BLASTable sequences, including rapidly evolved genes (having orthologs in other species but so highly divergent that efficient recognition of orthologs is precluded), species-specific genes (present in the studied species but absent from the databases) and the persistence of non-coding fractions mainly from untranslated regions of the sampled transcripts [7].
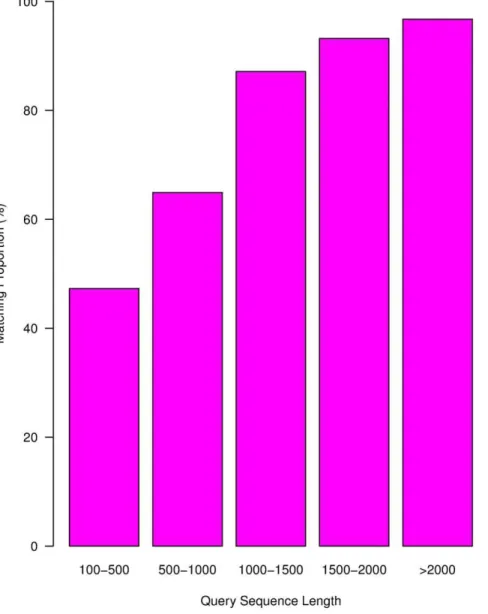
The assembled sequences of different lengths showed variable efficiency of matching to sequences in databases, with longer sequences showing higher match proportions (Figure 1). Match efficiency was 96.72% for sequences longer than 2,000 bp, but was 64.91% and 47.28% for sequences 500–1,000 bp and 100–500 bp in length, respectively. According to the E-value distribution of the top hits in the databases, 34.53% of the matched sequences showed strong homology (,1.0e250
), while 65.47% of the matched sequences showed moderate homology (between 1.0e25 and
Table 1.Statistical summary of cDNA sequences ofD. latiflorusgenerated by the Illumina GAII platform.
Phase 1 Phase 2 Total
Number of reads 52,548,610 43,966,994
-Average read length (bp)
75 75
-Total length of reads (bp)
3,941,145,750 3,297,524,550
-Number of contigs 316,821 293,274
-Average length of contigs (bp)
180 182
-Number of scaffolds 226,593 208,014
-Average length of scaffolds (bp)
273 277
-Number of unigenes 109,022 101,682 146,395
Average length of unigenes (bp)
425 429 461
Total length of unigenes (bp)
46,353,147 43,621, 027 67,537,137
1.0e250) (Figure 2A). The identity distribution pattern showed that 54.14% of the sequences had a similarity higher than 80%, while 45.86% showed similarity between 23% and 80% (Figure 2B).
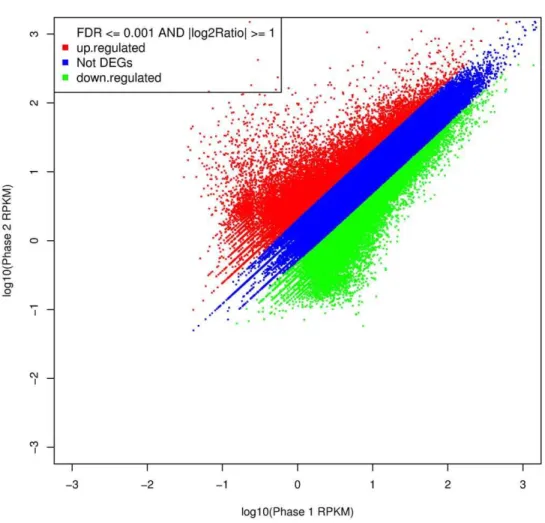
Abundance analysis (cf. Materials and Methods) identified a total of 26,529 unigenes showing significant abundance differences between the two floral developmental phases, with 13,639 members showing increased abundance in phase 1 (4,036 of which were unique to phase 1), and 12,890 members showing increased abundance in phase 2 (3,981 of which were unique to phase 2) (Figure 3 and Table S2). The high numbers of unigenes expressed in the two phases was not unexpected given the size of theD. latiflorusgenome, which has been regarded as a hexaploid or a complex aneuploid [46,47,48,49]. This fact, combined with the lack of a complete genomic or transcriptomic sequence set for bamboo to use as a reference, increased the difficulty of unigene annotation in this study.
Gene Ontology (GO) annotation
A total of 18,304 unigenes (22.76%) were assigned to 42 functional groups using GO assignments (Figure 4), including
biochemistry, growth, development, metabolism, apoptosis and immune defense. Within each of the three main categories of the GO classification scheme (biological process, cellular component and molecular function), the dominant subcategories were ‘‘cellular process’’, ‘‘cell part’’ and ‘‘binding’’, respectively. ‘‘Metabolic process’’, ‘‘pigmentation’’, ‘‘organelle’’ and ‘‘catalytic’’ were also well represented. However, few genes were assigned to the category ‘‘nutrient reservoir’’, and no genes were found in the clusters of ‘‘cell killing’’, ‘‘rhythmic process’’, ‘‘viral reproduction’’, ‘‘symplast’’, ‘‘synapse’’, ‘‘synapse part’’, ‘‘auxiliary transport protein’’, ‘‘chemoattractant’’, ‘‘chemorepellent’’, ‘‘metallochaper-one’’, ‘‘protein regulation’’ or ‘‘protein tag’’.
A further functional classification of all unigenes was performed using a set of plant-specific GO slims (Figure S2). ‘‘Cytoplasm’’, ‘‘plastid’’, ‘‘membrane’’ and ‘‘mitochondrion’’ were the most highly represented groups, followed closely by ‘‘cellular process’’, ‘‘biosynthetic process’’ and ‘‘metabolic process’’. Genes involved in flower development (47), pollination (16), and pollen-pistil interaction (16), stress response (470), signal transduction (429), cell differentiation (43), and regulatory and epigenetic genes (25) were also represented.
Figure 2. Characteristics of sequence homology ofD. latiflorusunigenes BLASTED againsta GenBank databases.A. E-value distribution of BLAST hits for matched unigene sequences, using an E-value cutoff of 1.0E-5. B. Identity distribution of top BLAST hits for each unigene. doi:10.1371/journal.pone.0042082.g002
In both phases of floral development, plant-specific GO Slim analysis (cf. Materials and Methods) revealed that most of the sequences were related to cellular component organization, cell cycle, nucleic acid binding, nucleic acid metabolic processes, transcription, cellular macromolecule biosynthetic processes, cellular macromolecule metabolic processes, generation of precursor metabolites and energy, and macromolecule modifica-tion. Unigenes more abundant in the phase 1 transcriptome, however, were involved in transcription activity, translation, small molecule metabolic processes and vigorous organelle development, while the phase 2 transcriptome skewed toward cellular processes, signal transduction, signal transmission, cell wall structuring, nucleic acid and chromatin binding, stress response, macromolecule metabolic processes, and cell death (Table S3). These trends were consistent with overall develop-mental activities during those time periods. For example, genes related to transcription, translation and general metabolism have been found to be abundant during early flower development. Conversely, transcripts involved in signaling, cell wall metabolism and cellular processes were overrepresented in flowers of late development stage [50,51,52,53].
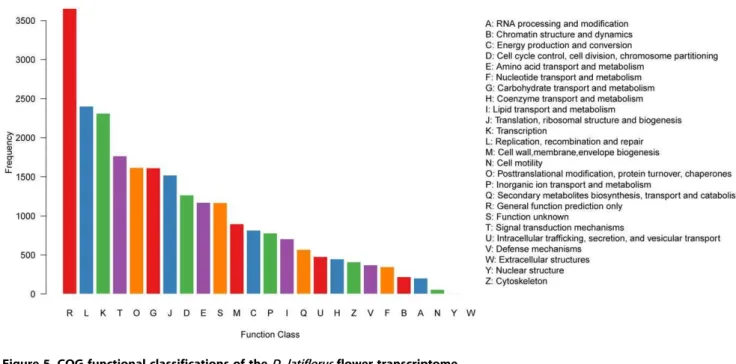
COG annotation
Out of 80,418 hits in the public databases, 18,535 sequences were classified into 25 COG categories (Figure 5), among which ‘‘General function prediction only’’ represented the largest group (3,655, 14.7%), followed by ‘‘Replication, recombination and repair’’ (2,402, 9.68%), ‘‘Transcription’’ (2,312, 9.32%) and ‘‘Signal transduction mechanisms’’ (1,765, 7.11%). ‘‘Cell motility’’ (58, 0.23%), ‘‘Nuclear structure’’ (9, 0.04%) and ‘‘Extracellular structures’’ (4, 0.02%) were the smallest groups.
KEGG pathway mapping
Referencing the 30,043D. latiflorusunigenes through the KEGG database (cf. Materials and Methods) predicted a total of 265 pathways, representing compound biosynthesis, degradation, utilization and metabolism. Transcripts identified as related to the following cellular processes or components were the most abundant: chromosome (3,055 unigenes), spliceosome (2,391), ubiquitin system (2,072), DNA repair and recombination proteins (1,709), DNA replication proteins (1,262), protein kinases (1,082), purine metabolism (1,028), chaperones and folding catalysts (981), peptidases (942), pyrimidine metabolism (904) and starch and sucrose metabolism (903) (Figure S3A). The largest category was metabolism (17,326) which included carbohydrate metabolism (4,039), amino acid metabolism (2,665), biosynthesis of secondary metabolites (1,947), nucleotide metabolism (1,932), lipid metabo-lism (1,834), energy metabometabo-lism (1,417) and other subcategories (Figure S3B). In the secondary metabolism category, 21 subcat-egories comprised 1,947 unigenes, the most represented of which were phenylpropanoid biosynthesis (528), limonene and pinene degradation (283), stilbenoid, diarylheptanoid and gingerol bio-synthesis (241), terpenoid backbone biobio-synthesis (148), flavonoid biosynthesis (133) and carotenoid biosynthesis (115), and antho-cyanin biosynthesis (19) was also classified (Figure S3C).
In addition to metabolism pathways, genetic information processing genes (6,850) and environmental information process-ing genes (2,528) were highly represented categories. Transcrip-tion, translaTranscrip-tion, replication and repair, folding, sorting and degradation, signal transduction, membrane transport and signal-ing interaction were included in these categories. Separatsignal-ing the unigenes by transcript abundance, phase 1 enriched transcripts skewed toward the categories such as chromosome, nucleotide Figure 4. Gene Ontology classifications of assembled non-redundant unigenes.
metabolism, DNA replication, and DNA repair and recombina-tion proteins. Genes showing increased abundance in phase 2 were skewed toward phenylpropanoid biosynthesis, starch and sucrose metabolism, flavonoid biosynthesis, pentose and glucuronate interconversions, phenylalanine metabolism, tryptophan metabo-lism, fatty acid metabometabo-lism, flavone and flavonol biosynthesis, carotenoid biosynthesis, oxidative phosphorylation and apoptosis (Table S4).
Putative D. latiflorusfloral development transcription factors
Transcriptional regulation is mediated through the interplay between transcription factor proteins and specific cis-regulatory regions of the genome to activate gene expression and hence to bring about development or other changes [54]. As such, some transcription factors may be considered master regulators, since their actions begin a branching series of downstream effects, including the activation of other transcription factors, which ultimately lead to broad changes in the organism. This study focused on these key regulatory genes.
A total of 81 putative transcription factor families were identified in developing D. latiflorus flowers, with 55 and 68 showing increased unigene transcript abundance in phase 1 and phase 2, respectively (Tables S1 and S2). Many of the same unigenes were found in both samples. Putative homologs of growth-regulating factor (GRF) genes, however, were restricted to phase 1. InArabidopsis thalianaandOryza sativa,GRFgenes form a small transcription factor family with 9 and 12 members, respectively [55,56]. The GRF proteins bear two highly conserved regions, the QLQ (Gln, Leu, Gln) domain and the WRC (Trp, Arg, Cys) domain [55,57]. Biochemical and genetic data have suggested that GRFs act as transcription activators and are part of a complex involved in regulating the morphogenesis of leaves and petals [58,59]. The GRF transcripts were highly abundant in actively growing and developing tissues, such as shoot tips, flower buds and immature leaves, but less abundant in mature tissues and organs [55,56], suggesting a role in regulating cell proliferation [56,59]. Given the significantly high levels ofGRFtranscripts early
in D. latiflorus flower development, these genes may operate similarly in this bamboo species.
The SBP-box genes were firstly isolated fromAntirrhinum majus
(SBP1 and SBP2 [60]). Members of the SBP-box gene family regulate diverse aspects of plant development. SBP1 and SBP2
interact with the promoter element of the floral meristem identity gene SQUAMOSA of A. majus and thus are involved in flower development [60]. The maize SBP-box gene LG1 (Liguleless1) functions in the development of leaf ligules and auricules [61] and
tga1(teosinte glume architecture) controls the development of its naked grains [62]. The ArabidopsisSPL3gene (SQUApromoter-binding protein-like 3, aSBP1ortholog) has shown activity primarily in the vegetative apical meristem, leaf primordia, inflorescence apical meristems, floral meristems and floral organ primordia. The SPL3 protein was found to bind with a conserved sequence in the promoter of floral meristem identity gene AP1, promoting the floral transition, and it may also be involved in inflorescence development since 35S::SPL3se transgenic Arabidopsis produced bracts subtending flowers [63]. Also in Arabidopsis, SPL14 and
SPL8showed involvement in leaf development [64] and pollen sac development [65], respectively, while the microRNA-regulated
SPL9 and SPL15 appear to control shoot maturation [66]. In tomato, theLeSPL-CNR(Colorless nonripening) gene likely regulates fruit ripening [67]. SPL genes may also participate in stress responses [68]. The present study found that putative homologs of
SPL2, SPL3, SPL6, SPL8, SPL9, SPL12, SPL13, SPL14,andSPL15
were expressed in developingD. latiflorusflowers, suggesting similar roles fromSPLgenes duringD. latiflorusflower development.
The basic helix-loop-helix family (bHLH) contains genes regulating various processes of flower development, such as controlling the development of carpel margins, as well as the morphogenesis of sepals, petals, stamens and anthers in Arabi-dopsis andEschscholzia californica [69,70]. In the present study, 96 unigenes with bHLH-like sequences showed significantly higher abundance in phase 1, while 68 were higher in phase 2. Such prevalence of bHLH-containing transcripts early in floral devel-opment suggests that this family is as involved in flower development inD. latiflorusas it is in other species.
Auxin-response factors (ARFs) have been shown to regulate auxin responsive genes [71,72]. In Arabidopsis, loss-of-function mutations in ETTIN (ARF3) led to aberrant perianth organ numbers and spacing, as well as regional differentiation defects for the stamens and gynoecium, indicating an involvement in regional identity determination [73]. The 24 putativeARFhomologs from
D. latifloruswere significantly more abundant in the young flower buds than in the older floral tissues.
The basic leucine zipper (bZIP) transcription factors regulate diverse biological processes in plants such as flower development (e.g.PERIANTHIA[74]), light and stress signaling (e.g.AREB1and
AREB2[75]) and seed maturation (e.g.ABI5[76]). In developing
D. latiflorus flowers, both phases showed similar numbers of unigenes with bZIP sequence similarity (40 and 37 for phase 1 and phase 2, respectively).
The zinc finger homeodomain (zf-HD) genes encode a group of transcriptional regulators showing high activity during Arabidopsis floral development and to a lesser extent in vegetative develop-ment [77]. Some zf-HD members were shown to be expressed in a floral-specific manner (e.g. ATHB33 and ATHB28), with some members being more highly expressed in younger flowers (e.g.
ATHB21, ATHB25, and ATHB31) and others more highly expressed in older flowers (e.g.ATHB22, ATHB27and ATHB29) [77]. InD. latiflorus, 24 and 3 putative zf-HD genes were highly abundant in young flowers and older flowers, respectively. Unigenes similar to CCAAT box binding factors (e.g. HAP/NF-Ycomplex components) were also significantly enriched in young flowers (phase 1) relative to older flowers (phase 2) (18 vs. 1). Some of the CCAAT genes have been shown to be important in regulating flowering and stress responses in plants [78,79].
The large NAC transcription factor family was significantly represented among phase 2 transcripts, with 103 unigenes highly abundant compared with 41 unigenes abundant in phase 1. Members of this family have been implicated in diverse biological processes in other plant species, including floral and vegetative development [80,81,82,83,84,85], auxin signaling [85], responses to abscisic acid [86], defense [87], biotic and abiotic stress [88,89,90,91,92], light responses [73,93,94,95], programmed cell death [95,96] and senescence [97,98,99]. It has been suggested that NAC proteins enable crosstalk between different pathways [100].
Putative homologs of WRKY transcription factors showed a similar overrepresentation, with 97 unigenes showing high abundance in phase 2 compared with 41 highly abundant unigenes in phase 1. WRKY transcription factors have been shown to be associated with senescence [101,102] and stress responses [103]. Members of this family have been identified as important downstream components of MAPK signaling pathways that confer to resistance to both bacterial and fungal pathogens [104] They may be induced by signaling hormones such as salicylic acid [105,106], jasmonic acid [107] and gibberellic acid [108]. TheAP2-EREBPfamily was also enriched with 57 putative homologs highly abundant in phase 2 and 43 in phase 1. Members of this family perform various activities including floral organ identity specification and leaf epidermal cell patterning [109]. They can be induced by hormones such as jasmonic acid, salicylic acid and ethylene, along with other signals involved in pathogen attack, wounding and abiotic stresses, and may influence other stress and disease resistance pathways [110,111].
The MYB transcription factors contain DNA binding domains and some have been identified as floral developmental regulators [112,113]. R2R3-MYB genes have been reported to regulate various metabolic pathways, including those for phenylpropanoid metabolism [114] and tryptophan biosynthesis [115]. In
Arabi-dopsis,MYB21,MYB24andMYB57areDELLA-repressible GA-response genes that mediate stamen filament growth [116] and
AtPAP1 (PRODUCTION OF ANTHOCYANIN PIGMENT1) can strongly enhance the ectopic expression of flavonoid biosynthesis genes in most organs to produce intense purple pigmentation [114]. In this study, these metabolic and biological processes were significantly represented among transcripts in phase 2 (Table S4), suggesting increased MYB activity in this later stage.
Several other transcription factor families were also found. MADS-box genes have been intensely studied in model plants and many MADS family members have been shown to orchestrate floral organ specification and development [117,118,119]. Loss-of-function mutants of MADS-box genes have caused changes in organ identity. In the present study, 120 and 81 putative MADS genes were highly abundant in phase 2 and phase 1, respectively. A majority showed the greatest similarity to Vitis vinifera genes while others were homologous to rice, maize or sorghum sequences. Further investigation ofD. latiflorusputative homologs of maize, sorghum or rice genes (e.g.OsMADS58[120,121]) should provide interesting clues to flower development in the grasses.
Detection of putative sequences related to flowering time control and flower development
The unusually infrequent nature of bamboo flowering has attracted the curiosity of scientists and laypeople alike over the centuries [23], and the biological basis of this trait, especially whether the same genes involved in flowering in other species function in bamboo species, has remained an open question. By comparing the
D. latiflorusunigenes found in this study with the NCBI and Uniprot databases, at least 290 unigenes were discovered showing homology to known flowering-related genes from other plants (Table S5). These unigenes were compared to flowering genes from rice and temperate grasses, as well as from Arabidopsis (Figure S4).
For the photoperiod pathway, D. latiflorus unigenes showing homology to components of the circadian clock includedLATE ELONGATED HYPOCOTYL(LHY),PSEUDO-RESPONSE REGU-LATOR 1 (PRR95), EARLY FLOWERING 3 (ELF3), EARLY FLOWERING 4(ELF4) andCONSTITUTIVE PHOTOMORPHO-GENIC 1(COP1) [122]. Several homologs ofCONSTANS(CO), the key regulator of photoperiod response, were also identified (CO5, CO6, CO7andCO8[123]).CIRCADIAN CLOCK ASSOCIATED 1
(CCA1), TIMING OF CAB1 (TOC1) and GIGANTEA (GI) [122] homologs were absent. However, a set of unigenes did show homology to theindeterminate 1gene (id1).Id1was first identified in maize (Zea mays) [124,125] and no clear orthologs were found in Arabidopsis, whereas its ortholog in rice (known asRID1,OsId1,or
EARLY HEADING DATE 2, Ehd2) was discovered to be a key photoperiod-independent flowering regulator [126,127,128].
Putative autonomous flowering time pathway genes included unigenes showing homology toFLOWERING LOCUS D(FLD),FY,
FCA [123] andDICER-LIKE 3A (DCL3A) [129]. In the vernali-zation pathway, D. latiflorus putative homologs of MULTICOPY SUPPRESSOR OF IRA1 (MSI1), and VERNALIZATION INDE-PENDENT INSENSITIVE 3(VIN3) [123] were expressed. Each of these homologs, except MSI1, downregulates the flowering repressor, FLOWERING LOCUS C (FLC), and promotes the transition from vegetative to reproductive growth [129,130,131,132]. Putative homologs of GA-signaling pathway genes were also found, including the gibberellin response modulators dwarf 8 (d8) [133,134] and GAMYB [135], and gibberellin receptorGID1L2[136].
Putative homologs of floral meristem identity genes likeAP1[137],
not find any unigenes with obvious similarity toFT, a master regulator of the transition to flowering in Arabidopsis (with apparent paralogous counterparts in rice calledRFTandHd3a); however, since the tissues used in this study were floral buds, it remains possible that aD. latiflorus FThomolog is involved in the transition to flowering upstream of bud emergence but is absent from flowers.
Certain flowering-time genes controlling the transition to flowering have also shown involvement in organ development, and a host of these were found to be expressed in developingD. latiflorusflowers in this study. For example,CONSTANS(CO) gene, a key regulator of the photoperiodic flowering response in Arabidopsis, expresses not only in shoot apical meristems and leaves, but also in inflorescences and roots [140];GhCO, a homolog ofCOgene inGossypium hirsutum, expresses mainly in flower buds and mature flowers, and in ovules to a lesser extent [141]. The autonomous pathway geneFCA expresses at the shoot apex but also in mature leaves, inflorescences and roots [122]. Transcripts of the MYB genes have been found in young flower buds, mature flowers and fruits [69], while expression ofAP1was found in the early development of individual flowers [140].RFL, the riceLFY
homolog, not only facilitates the transition to flowering, but also regulates the development of panicles and tillers [142]. Many MADS genes have been shown to function in floral organ specification and development [117,118,119], and EMF2, an epigenetic regulator of homeotic flower development genes including MADS genes, showed wide expression in shoots, leaves, roots, stems and inflorescences [38]. Thus, theD. latiflorusputative flowering-time gene homologs identified in this study may likewise have dual roles in flowering time and flower development. Forty-seven other putative flower development genes were also found, including those involved in morphogenesis of floral structures (meristem, primordia, whorl, organ number, spikelet, panicle and nectary) and development of the reproductive system (pollen and ovules) in other species (Figure S2 and Table S6).
Conclusions
Previous studies have demonstrated the usefulness of next generation short-read DNA sequencing technology in generating genomic data for non-model organisms, and subsequently comparing the resulting sequences to model-species reference genomes [6,143]. Despite the fascinating mystery of bamboo flowering and the economic importance of several bamboo species, little genetic or genomic research has been performed. The study presented here begins to address this shortcoming by using the Illumina GAII platform to investigate the sequences and transcript abundance levels of genes expressed in developing flowers ofD. latiflorus. In total, 146,395 unigenes were isolated, 80,418 of which could be identified as putative homologs of annotated sequences in the public databases, with 290 being putative homologs of known flowering genes in other species. These sequences provide a starting point for the further investigation of bamboo flowering, and the 26,529 other unigenes from diverse pathways that were differentially expressed between phase 1 and phase 2 should inform research into later stages of floral development. The results provided here represent the largest genetic resource forD. latiflorus
to date, and they could serve as the foundation for further genomics research on this species or its relatives.
Materials and Methods
Sample preparation and RNA isolation
D. latiflorusflowers were collected from each of the 14 ramets of one flowering genet between 12:05 pm and 12:30 pm on April 14,
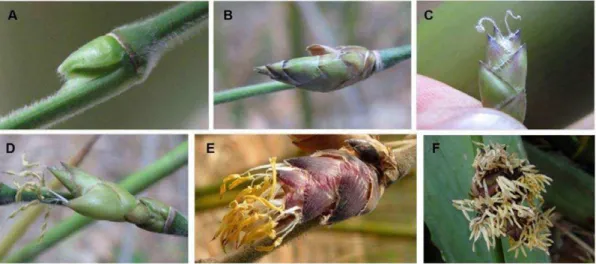
2009 near Xiaozhai village, Pengpu town, Mile county of Yunnan Province in southwest China. All collected flowers were grouped into two sizes based on bud length. The phase 1 sample consisted of buds#5 mm and the phase 2 sample consisted of buds$5 mm (see Figure 6 for details). Samples were immediately frozen in liquid nitrogen and stored at 280uC until RNA was extracted. Total RNA of each sample was isolated using RNAiso Plus (TaKaRa). RNA quality was characterized initially on an agarose gel and NanoDrop ND1000 spectrophotometer (NanoDrop Technologies, Wilmington, DE, USA) and then further assessed by RIN (RNA Integrity Number) value (.8.0) using an Agilent 2100 Bioanalyzer (Santa Clara, CA, USA).
Library preparation and sequencing
The cDNA libraries were prepared according to the manufac-turer’s instructions (Illumina, San Diego, CA). Poly-A mRNA molecules were purified using Sera-mag Magnetic Oligo (dT) Beads (Illumina) from 20mg total RNA from each sample and
eluted with 10 mM Tris–HCl. To avoid priming bias during cDNA synthesis, the purified mRNA was first fragmented into small pieces using RNA Fragmentation Reagents (Ambion, Austin, TX, USA) before cDNA synthesis. The cleaved mRNA fragments were converted to double-stranded cDNA using random hexamer primers (Illumina) with the SuperScript Double-Stranded cDNA Synthesis kit (Invitrogen, Camarillo, CA). The resulting cDNAs were purified using the QiaQuick PCR Purification Kit (Qiagen, Valencia, CA) and then subjected to end-repair and phosphory-lation using T4 DNA polymerase, Klenow DNA polymerase and T4 PNK (NEB, Ipswich, MA, USA). Repaired cDNA fragments were 39 adenylated using Klenow Exo- (Illumina), producing cDNA fragments with a single ‘A’ base overhang at their 39ends for subsequent adapter ligation. Illumina paired-end adapters were ligated to the ends of these 39 adenylated cDNA fragments. To select a size range of templates for downstream enrichment, the products of the ligation reaction were purified on a 2% TAE-agarose gel (Certified Low-Range Ultra Agarose, BioRad, Hercules, CA). A range of cDNA fragments (200625 bp) was excised from the gel and extracted using QIAquick Gel Extraction Kit (Qiagen). Fifteen rounds of PCR amplification were performed to enrich the purified cDNA template using primers complemen-tary to the ends of the adapters [PCR Primer PE 1.0 and PCR Primer PE 2.0 (Illumina) with Phusion DNA Polymerase. Finally, after validating on an Agilent Technologies 2100 Bioanalyzer using the Agilent DNA 1000 chip kit, the cDNA library products were sequenced on a paired-end flow cell using an Illumina Genome Analyzer II at Beijing Genomics Institute (BGI) in Shenzhen, China.
Data processing andde novoassembly
Because the algorithms used inde novotranscriptome construc-tion of the short reads provided by the Illumina platform may be severely inhibited by sequencing errors, a stringent cDNA sequence filtering process was employed to select clean reads. First, Illumina’s Failed-Chastity filter software was used to remove raw reads that fell into the relation ‘‘failed-chastity#1’’, with a chastity threshold of 0.6 on the first 25 cycles. Second, all raw reads showing signs of adaptor contamination or ambiguous trace peaks (denoted with an ‘‘N’’ in the sequence trace) were removed. Finally, raw reads showing more than 10% of bases with a Phred-scaled probability (Q) less than 20 were discarded.
unambiguous path. The identity of the different contigs from a transcript, and their distance, were recognized by mapping clean reads back to the corresponding contigs based on their paired end information. Joining of these contigs and filling of the unknown interspaces (i.e., gaps) using ‘‘Ns’’ (i.e., ambiguous base calls) resulted in the generation of scaffolds. Finally, the gaps of scaffolds were filled using the paired-end clean reads according to their sequence complementarity to scaffolds, resulting in sequences with the fewest Ns that also could not be further extended on either end. Such sequences were defined as unigenes. To obtain distinct sequences, the unigenes from the two different phases were clustered using the TGI Clustering tool [40].
Unigenes were then aligned to a series of protein databases using BLASTx (E-value ,1025
). Databases included the NCBI non-redundant protein (Nr), Swiss-Prot, the Kyoto Encyclopedia of Genes and Genomes (KEGG) pathway [145] and the Cluster of Orthologous Groups of proteins (COG) (http://www.ncbi.nlm. nih.gov/COG/) [146] databases. Sequence directionality was assigned according to the best alignments. When the different databases gave different results, the following priority structure was used to choose one unigene: NCBI Nr, Swiss-Prot, KEGG and COG. When a unigene failed to align to any of the four databases, ESTScan [147] was used to predict its coding regions and ascertain its sequence direction.
Unigene transcript abundance analysis
To analyze unigene transcript abundance levels, the uniquely mapped reads for a specific unigene were counted by mapping reads of each phase tode novoassembled distinct sequences using SOAP2 software [148], and the RPKM (Reads Per Kb per Million reads) values were computed as proposed by Mortazavi et al. [10]. Unigene transcript abundance differences between the two floral development phases of D. latiflorus were obtained from RPKM values using a method modified from Audic’s proposal [149]. Fold changes for each unigene between sample pairs (Phase 2 vs. Phase 1) were computed as the ratio of the RPKM values. If the value of Phase2 RPKM or Phase1 RPKM was 0, 0.001 was used instead of 0 to measure the fold change. The significance of differential transcript abundance was computed using the FDR (False Discovery Rate) control method [150] to justify the p-value, and
only unigenes with an absolute fold change $2 and a FDR significance score#0.001 were used for subsequent steps of the analysis. The formula to determine the significant p-value between two samples was defined as follows.
p(yDx)~(N2
N1)
y (xzy)!
x!y!(1zN2 N1)
(xzyz1)
In the formula, N1 and N2 represent the total number of clean reads mapped to All-unigenes in each sample, and x and y represent respectively the number of clean reads mapped to a common unigene in phase 1 and phase 2.
Gene annotation
To assign putative gene function, unigenes were searched against the NCBI Nr and Swiss-Prot databases using local BLASTx with an E-value cutoff of 1025. Estimates of the numbers of annotated unigenes that matched to genes from the two databases were made and the unigene lists were then filtered to remove duplications. Functional categories of the predicted genes were obtained by applying gene ontology (GO) terms (http:// www.geneontology.org) [151] to the Nr database annotation using the Blast2GO program [152], and summarized using WEGO software [153]. Then the GO annotations of the unigenes were mapped to the plant-specific GO slim ontology using the map2slim script (www.geneontology.org/GO.slims.shtml) [154] (p-value,0.05), and final classification of the unigenes was based on these GO slims. To evaluate the completeness of our transcriptome library and the effectiveness of our annotation process, we searched the annotated unigene sequences for the possible functions involved in COG classifications. To summarize which pathways are active inD. latiflorusflowers, we mapped the annotated sequences to the reference canonical pathways in KEGG. To identify transcription factor families represented in our samples, unigene sequences were searched against the complete list of transcription factor protein sequences of the Plant Transcription Factor Database (PlnTFDB: http://plntfdb.bio. uni-potsdam.de/v3.0/downloads.php) [155] using BLASTX with an E-value cutoff of#1025
.
Figure 6. Examples of sampled floral tissues.A. Representatives of flowers collected to produce the sample for phase 1 (flower buds#5 mm). B–F. Representatives of flowers collected to produce the sample for phase 2 (flower buds$5 mm). B. Flowers with pistils and stamens not yet emerging from glumes. C. Flowers from which only pistils have emerged from glumes. D. Flowers with both pistils and stamens emerging from glumes. E. Flowers for which anthers have already dehisced. F. Senescing flowers.
To assign putative biological functions and pathway involve-ment to the unigenes, enrichinvolve-ment analysis was carried out (Table S3, Table S4). First, all unigenes showing significant transcript abundance differences between phases (‘‘differentially abundant unigenes’’) were mapped to the GO and KEGG pathway databases, and then the numbers of unigenes for every GO term and KO term were calculated, respectively. To compare these unigenes to the wholeD. latiflorustranscriptome background, the hypergeometric test was applied to find significantly enriched GO and KO terms from the set of differentially abundant unigenes. The formula for the gene enrichment test was
P~1{X m{1
i~0
M i
N{M n{i
N n
in which N represents the total number of unigenes with GO and KEGG pathway annotation; n represents the number of differentially abundant unigenes in N; M represents the number of unigenes that were annotated to certain GO or KO terms; and m represents the number of differentially abundant unigenes in M. The initially obtained p-values were then adjusted using a Bonferroni Correction and a corrected p-value of 0.05 was adopted as a threshold.
Supporting Information
Figure S1 Overview of D. latiflorus flower
transcrip-tome sequencing and assembly. A. Length distribution of
contigs from phase 1; B. Length distribution of contigs from phase 2; C. Length distribution of scaffolds from phase 1; D. Length distribution of scaffolds from phase 2; E. Length distribution of unigenes from phase 1; F. Length distribution of unigenes from phase 2; G. Length distribution of all unigenes.
(PDF)
Figure S2 Plant-specific GO Slim terms for the D. latiflorus florally expressed unigenes. The bar chart provides the plant-specific GO slim terms enriched for unigenes expressed inD. latiflorusflowers.
(PDF)
Figure S3 KEGG pathway categories assigned with D. latiflorus flower unigenes. A. Top KEGG pathways highly represented byD. latiflorusflower unigenes. B. KEGG metabolism pathways. C. KEGG secondary metabolism pathways.
(PDF)
Figure S4 Pathways regulating the floral transition in Arabidopsis, rice and temperate grasses (Compiled
from references [123,129,156,157,158,159,160,161,162,
163,164,165,166,167,168,169,170,171,172,173,174,175,
176]) and putative homologous unigenes inD. latiflorus..
I. Pathways in Arabidopsis. II. Pathways in rice. III. Pathways in temperate grasses. Arrows indicate a promotive effect; broken
arrows indicate a possible relationship; perpendicular lines indicate a repressive effect. Genes are shown in rectangles and proteins are shown in circles. Vernalization pathway genes are shown in blue, autonomous pathway genes in pink, photoperiod pathway genes in green, and GA-signaling pathway genes in purple. Floral pathway integrators are shown in red, and floral meristem identity genes are shown in grey. Labels: v indicates vernalization; ld indicates long days; sd indicates short days. Bold and italicized typeface indicates genes and proteins for which similar unigenes were found inD. latiflorus in the present study. * indicates the gene was first identified in maize but lacks homologs in Arabidopsis.
(PDF)
Table S1 Top BLAST hits from public databases.A list of the top results from BLASTING D. latiflorus unigenes against public databases (E-value cutoff of 1025).
(XLS)
Table S2 List of unigenes showing differential
tran-script abundance.A list of the unigenes showing differential
transcript abundance in flowers of phase 1 and phase 2. (XLS)
Table S3 Enriched plant-specific GO terms for
uni-genes showing differential transcript abundance.A list of
the plant-specific GO terms enriched for unigenes showing higher transcript abundance in phase 1 and phase 2, respectively (p,0.05).
(PDF)
Table S4 Enriched KEGG pathways for unigenes
show-ing differential transcript abundance. A list of KEGG
pathways enriched for unigenes showing higher transcript abundance in phase 1 and phase 2, respectively (p,0.05). (PDF)
Table S5 Representatives of putative flowering-time
genes inD.latiflorus.A list of theD. latiflorusputative flowering
time control genes and their possible functions. (PDF)
Table S6 Putative flower development genes in D. latiflorus. A list of the genes putatively related to flower development inD. latiflorusand their possible functions.
(XLS)
Acknowledgments
We thank to Dr. Yu-Xiao Zhang and Ms. Xiao-Yan Wang for various support, to Mr. Zi-Wei Xiao and Mr. Qiu-Lin Yang for field sampling assistance.
Author Contributions
Conceived and designed the experiments: Z-HG D-ZL. Performed the experiments: X-MZ. Analyzed the data: X-MZ LZ Z-HG. Contributed reagents/materials/analysis tools: MZ LZ ZL-R. Wrote the paper: X-MZ LZ ZL-R D-ZL HG. Read and approved the final manuscript: Z-HG X-MZ LZ ZL-R D-ZL.
References
1. Metzker ML (2010) Sequencing technologies - the next generation. Nat Rev Genet 11: 31–46.
2. Bentley DR, Balasubramanian S, Swerdlow HP, Smith GP, Milton J, et al. (2008) Accurate whole human genome sequencing using reversible terminator chemistry. Nature 456: 53–59.
3. Nobuta K, McCormick K, Nakano M, Meyers BC (2010) Bioinformatics analysis of small RNAs in plants using next generation sequencing technologies. Methods Mol Biol 592: 89–106.
4. Huang YW, Huang THM, Wang LS (2010) Profiling DNA methylomes from microarray to genomic-scale sequencing. Technol Cancer Res T 9: 139–147. 5. Birzele F, Schaub J, Rust W, Clemens C, Baum P, et al. (2010) Into the unknown: expression profiling without genome sequence information in CHO by next generation sequencing. Nucleic Acids Res 38: 3999–4010. 6. Crawford JE, Guelbeogo WM, Sanou A, Traore A, Vernick KD, et al. (2010)
7. Logacheva MD, Kasianov AS, Vinogradov DV, Samigullin TH, Gelfand MS, et al. (2011)De novosequencing and characterization of floral transcriptome in two species of buckwheat (Fagopyrum). BMC Genomics 12: 30.
8. Ness RW, Siol M, Barrett SC (2011) De novo sequence assembly and characterization of the floral transcriptome in cross- and self-fertilizing plants. BMC Genomics 12: 298.
9. Wang XW, Luan JB, Li JM, Bao YY, Zhang CX, et al. (2010)De novo
characterization of a whitefly transcriptome and analysis of its gene expression during development. BMC Genomics 11: 400.
10. Mortazavi A, Williams BA, Mccue K, Schaeffer L, Wold B (2008) Mapping and quantifying mammalian transcriptomes by RNA-Seq. Nat Methods 5: 621–628.
11. Li H, Dong Y, Yang J, Liu X, Wang Y, et al. (2012)De novotranscriptome of safflower and the identification of putative genes for oleosin and the biosynthesis of flavonoids. PLoS One 7: e30987.
12. Xue J, Bao YY, Li BL, Cheng YB, Peng ZY, et al. (2010) Transcriptome analysis of the brown planthopperNilaparvata lugens. PLoS One 5: e14233. 13. Chen S, Yang P, Jiang F, Wei Y, Ma Z, et al. (2010)De novoanalysis of
transcriptome dynamics in the migratory locust during the development of phase traits. PLoS One 5: e15633.
14. Qiu Q, Ma T, Hu Q, Liu B, Wu Y, et al. (2011) Genome-scale transcriptome analysis of the desert poplar,Populus euphratica. Tree Physiol 31: 452–461. 15. Liu B, Jiang GF, Zhang YF, Li JL, Li XJ, et al. (2011) Analysis of
Transcriptome Differences between Resistant and Susceptible Strains of the Citrus Red MitePanonychus citri(Acari: Tetranychidae). PLoS One 6. 16. Feng C, Chen M, Xu CJ, Bai L, Yin XR, et al. (2012) Transcriptomic analysis
of Chinese bayberry (Myrica rubra) fruit development and ripening using RNA-Seq. BMC Genomics 13.
17. Barrero RA, Chapman B, Yang YF, Moolhuijzen P, Keeble-Gagnere G, et al. (2011)De novoassembly ofEuphorbia fischerianaroot transcriptome identifies prostratin pathway related genes. BMC Genomics 12.
18. Garg R, Patel RK, Tyagi AK, Jain M (2011)De novoassembly of chickpea transcriptome using short reads for gene discovery and marker identification. DNA Res 18: 53–63.
19. Shi CY, Yang H, Wei CL, Yu O, Zhang ZZ, et al. (2011) Deep sequencing of the Camellia sinensis transcriptome revealed candidate genes for major metabolic pathways of tea-specific compounds. BMC Genomics 12: 131. 20. Hua WP, Zhang Y, Song J, Zhao LJ, Wang ZZ (2011)De novotranscriptome
sequencing in Salvia miltiorrhiza to identify genes involved in the biosynthesis of active ingredients. Genomics 98: 272–279.
21. Xiang LX, He D, Dong WR, Zhang YW, Shao JZ (2010) Deep sequencing-based transcriptome profiling analysis of bacteria-challenged Lateolabrax japonicusreveals insight into the immune-relevant genes in marine fish. BMC Genomics 11:472.
22. Wang ZY, Fang BP, Chen JY, Zhang XJ, Luo ZX, et al. (2010) De novo assembly and characterization of root transcriptome using Illumina paired-end sequencing and development of cSSR markers in sweetpotato (Ipomoea batatas). BMC Genomics 11: 726.
23. Janzen DH (1976) Why Bamboos Wait So Long to Flower. Ann Rev Ecol Syst 7: 347–391.
24. Wu ZY, Raven PH, Hong DY (2006) Floral of China: Poaceae: Science Press, Beijing, and Missouri Botanical Gardern Press, St Louis.
25. INBAR (1999) Socio-economic Issues and Constraints in the Bamboo and Rattan Sectors: International Network for Bamboo and Rattan’s Assessment. Beijing.
26. Judziewicz E, Clark L, Londono X, Stern M (1999) American Bamboos: Washington, DC: Smithsonian Institution Press.
27. Tzvelev NN (1989) The System of Grasses (Poaceae) and Their Evolution. Bot Rev 55: 141–204.
28. Bystriakova N, Kapos V, Stapleton C, Lysenko I (2003) Bamboo biodiversity: information for planning conservation and management in the Asia-Pacific region. UNEP-WCMC Biodiversity Series 14.
29. Bystriakova N, Kapos V, Stapleton C, Lysenko I (2004) Bamboo biodiversity: Africa, Madgascar and the Americas. UNEP-WCMC Biodiversity Series 19. 30. Hilton-Taylor C, Mittermeier RA (2000) 2000 IUCN red list of threatened
species: IUCN–The World Conservation Union.
31. Walter KS, Gillett HJ (1998) 1997 IUCN red list of threatened plants: IUCN. 32. Pilcher HR (2004) Bamboo under extinction threat. Nature doi:10.1038/
news040510-2.
33. Zhang WY, Ma NX (1990) Vitality of bamboo pollens and natural pollination in bamboo plants. Forest Res 3(3): 250–255.
34. Tian B, Chen Y, Li D, Yan Y (2006) Cloning and characterization of a bamboo
Leafy Hull Sterile1homologous gene. DNA Sequence 17: 143–151.
35. Tian B, Chen Y, Yan Y, Li D (2005) Isolation and ectopic expression of a bamboo MADS-box gene. Chin Sci Bull 50: 145–151.
36. Lin EP, Peng HZ, Jin QY, Deng MJ, Li T, et al. (2009) Identification and characterization of two bamboo (Phyllostachys praecox)AP1/SQUA-like MADS-box genes during floral transition. Planta 231: 109–120.
37. Lin XC, Chow TY, Chen HH, Liu CC, Chou SJ, et al. (2010) Understanding bamboo flowering based on large-scale analysis of expressed sequence tags. Genet Mol Res 9: 1085–1093.
38. Xu H, Chen LJ, Qu LJ, Gu HY, Li DZ (2010) Functional conservation of the plant EMBRYONIC FLOWER2 gene between bamboo and Arabidopsis. Biotechnol Lett 32: 1961–1968.
39. Nadgauda RS, Parasharami VA, Mascarenhas AF (1990) Precocious flowering and seeding behaviour in tissue-cultured bamboos. Nature 344: 335–336. 40. Pertea G, Huang X, Liang F, Antonescu V, Sultana R, et al. (2003) TIGR
Gene Indices clustering tools (TGICL): a software system for fast clustering of large EST datasets. Bioinformatics 19: 651–652.
41. Weber AP, Weber KL, Carr K, Wilkerson C, Ohlrogge JB (2007) Sampling the Arabidopsis transcriptome with massively parallel pyrosequencing. Plant Physiol 144: 32–42.
42. Guo SG, Zheng Y, Joung JG, Liu SQ, Zhang ZH, et al. (2010) Transcriptome sequencing and comparative analysis of cucumber flowers with different sex types. BMC Genomics 11: 384.
43. Mane SP, Evans C, Cooper KL, Crasta OR, Folkerts O, et al. (2009) Transcriptome sequencing of the Microarray Quality Control (MAQC) RNA reference samples using next generation sequencing. BMC Genomics 10: 264. 44. Blanca J, Canizares J, Roig C, Ziarsolo P, Nuez F, et al. (2011) Transcriptome characterization and high throughput SSRs and SNPs discovery inCucurbita pepo(Cucurbitaceae). BMC Genomics 12: 104.
45. Parchman TL, Geist KS, Grahnen JA, Benkman CW, Buerkle CA (2010) Transcriptome sequencing in an ecologically important tree species: assembly, annotation, and marker discovery. BMC Genomics 11: 180.
46. Darlington CD, Janaki Ammal EK (1945) Chromosome atlas of cultivated plants. George Allen and Unwin Ltd, London, UK.
47. Zhang GC (1985) Studies on the chromosome numbers of caespitose bamboos. Guangdong For Sci Technol 85 (4): 16–21.
48. Li XL, Lin RS, Fung Hok-Lam, Qi ZX, Song WQ, et al. (2001) Chromosome numbers of some caespitose bamboos native in or introduced to China. Acta Phyto Sinica 39 (5): 433–442.
49. Li HY, Qiao GR, Liu MY, Jiang J, Zhang L, Zhuo RY (2011) Analysis of Ploidy inDendrocalamus latiflorusPlants Obtained by Anther Culture. Chin Bull Bot 46 (1): 74–78.
50. Becker JD, Boavida LC, Carneiro J, Haury M, Feijo JA (2003) Transcriptional profiling of Arabidopsis tissues reveals the unique characteristics of the pollen transcriptome. Plant Physiol 133: 713–725.
51. Honys D, Twell D (2003) Comparative analysis of the Arabidopsis pollen transcriptome. Plant Physiol 132: 640–652.
52. Hepler PK, Vidali L, Cheung AY (2001) Polarized Cell Growth in Higher Plants. Annu Rev Cell Dev Biol 17: 159–187.
53. Pina C, Pinto F, Feijo JA, Becker JD (2005) Gene family analysis of the Arabidopsis pollen transcriptome reveals biological implications for cell growth, division control, and gene expression regulation. Plant Physiol 138: 744–756. 54. Zhang DF, Li B, Jia GQ, Zhang TF, Dai JR, et al. (2008) Isolation and characterization of genes encoding GRF transcription factors and GIF transcriptional coactivators in Maize (Zea maysL.). Plant Sci 175: 809–817. 55. Kim JH, Choi D, Kende H (2003) The AtGRF family of putative transcription
factors is involved in leaf and cotyledon growth inArabidopsis. Plant J 36: 94– 104.
56. Choi D, Kim JH, Kende H (2004) Whole genome analysis of theOsGRFgene family encoding plant-specific putative transcription activators in rice (Oryza sativaL.). Plant Cell Physiol 45: 897–904.
57. van der Knaap E, Kim JH, Kende H (2000) A novel gibberellin-induced gene from rice and its potential regulatory role in stem growth. Plant Physiol 122: 695–704.
58. Horiguchi G, Kim GT, Tsukaya H (2005) The transcription factor AtGRF5 and the transcription coactivator AN3 regulate cell proliferation in leaf primordia ofArabidopsis thaliana. Plant J 43: 68–78.
59. Kim JH, Kende H (2004) A transcriptional coactivator, AtGIF1, is involved in regulating leaf growth and morphology inArabidopsis. Proc Natl Acad Sci USA 101: 13374–13379.
60. Klein J, Saedler H, Huijser P (1996) A new family of DNA binding proteins includes putative transcriptional regulators of the Antirrhinum majus floral meristem identity geneSQUAMOSA. Mol Gen Genet 250: 7–16.
61. Moreno MA, Harper LC, Krueger RW, Dellaporta SL, Freeling M (1997) liguleless1 encodes a nuclear-localized protein required for induction of ligules and auricles during maize leaf organogenesis. Gene Dev 11: 616–628. 62. Wang H, Nussbaum-Wagler T, Li B, Zhao Q, Vigouroux Y, et al. (2005) The
origin of the naked grains of maize. Nature 436: 714–719.
63. Cardon GH, Hohmann S, Nettesheim K, Saedler H, Huijser P (1997) Functional analysis of theArabidopsis thalianaSBP-box geneSPL3: a novel gene involved in the floral transition. Plant J 12: 367–377.
64. Stone JM, Liang X, Nekl ER, Stiers JJ (2005) ArabidopsisAtSPL14, a plant-specific SBP-domain transcription factor, participates in plant development and sensitivity to fumonisin B1. Plant J 41: 744–754.
65. Unte US, Sorensen AM, Pesaresi P, Gandikota M, Leister D, et al. (2003)
SPL8, an SBP-Box gene that affects pollen sac development in Arabidopsis. Plant Cell 15: 1009–1019.
66. Schwarz S, Grande AV, Bujdoso N, Saedler H, Huijser P (2008) The microRNA regulated SBP-box genesSPL9andSPL15control shoot maturation in Arabidopsis. Plant Mol Biol 67: 183–195.
67. Manning K, Tor M, Poole M, Hong Y, Thompson AJ, et al. (2006) A naturally occurring epigenetic mutation in a gene encoding an SBP-box transcription factor inhibits tomato fruit ripening. Nat Genet 38: 948–952.
69. Zahn LM, Ma X, Altman NS, Zhang Q, Wall PK, et al. (2010) Comparative transcriptomics among floral organs of the basal eudicotEschscholzia californicaas reference for floral evolutionary developmental studies. Genome Biol 11: R101. 70. Zhang W, Sun Y, Timofejeva L, Chen C, Grossniklaus U, et al. (2006) Regulation ofArabidopsistapetum development and function by DYSFUNC-TIONAL TAPETUM1(DYT1) encoding a putative bHLH transcription factor. Development 133: 3085–3095.
71. Ellis CM, Nagpal P, Young JC, Hagen G, Guilfoyle TJ, et al. (2005)AUXIN RESPONSE FACTOR1andAUXIN RESPONSE FACTOR2regulate senescence and floral organ abscission inArabidopsis thaliana. Development 132: 4563–4574. 72. Goetz M, Hooper LC, Johnson SD, Rodrigues JC, Vivian-Smith A, et al. (2007) Expression of aberrant forms of AUXIN RESPONSE FACTOR8
stimulates parthenocarpy in Arabidopsis and tomato. Plant Physiol 145: 351– 366.
73. Sessions A, Nemhauser JL, McCall A, Roe JL, Feldmann KA, et al. (1997) ETTIN patterns the arabidopsis floral meristem and reproductive organs. Development 124: 4481–4491.
74. Running MP, Meyerowitz EM (1996) Mutations in the PERIANTHIA gene of
Arabidopsis specifically alter floral organ number and initiation pattern. Development 122: 1261–1269.
75. Uno Y, Furihata T, Abe H, Yoshida R, Shinozaki K, et al. (2000)Arabidopsis
basic leucine zipper transcription factors involved in an abscisic acid-dependent signal transduction pathway under drought and high-salinity conditions. Proc Natl Acad Sci USA 97: 11632–11637.
76. Lopez-Molina L, Mongrand S, Chua NH (2001) A postgermination developmental arrest checkpoint is mediated by abscisic acid and requires the ABI5 transcription factor inArabidopsis. Proc Natl Acad Sci USA 98: 4782– 4787.
77. Tan QK, Irish VF (2006) The Arabidopsis zinc finger-homeodomain genes encode proteins with unique biochemical properties that are coordinately expressed during floral development. Plant Physiol 140: 1095–1108. 78. Liu JX, Howell SH (2010) bZIP28 and NF-Y transcription factors are activated
by ER stress and assemble into a transcriptional complex to regulate stress response genes inArabidopsis. Plant Cell 22: 782–796.
79. Wenkel S, Turck F, Singer K, Gissot L, Le Gourrierec J, et al. (2006) CONSTANS and the CCAAT box binding complex share a functionally important domain and interact to regulate flowering ofArabidopsis. Plant Cell 18: 2971–2984.
80. Hennig L, Gruissem W, Grossniklaus U, Kohler C (2004) Transcriptional programs of early reproductive stages in Arabidopsis. Plant Physiol 135: 1765– 1775.
81. Sablowski RWM, Meyerowitz EM (1998) A homolog of NO APICAL MERISTEMis an immediate target of the floral homeotic genesAPETALA3/ PISTILLATA. Cell 92.
82. Souer E, Houwelingen Alv, Kloos D, Mol J, Koes R (1996) TheNo Apical MeristemGene of Petunia is required for pattern formation in embryos and flowers and is expressed at meristem and primordia boundaries. Cell 85: 159– 170.
83. Vroemen CW (2003) TheCUP-SHAPED COTYLEDON3Gene Is Required for Boundary and Shoot Meristem Formation in Arabidopsis. Plant Cell 15: 1563– 1577.
84. Wellmer F, Riechmann JL, Alves-Ferreira M, Meyerowitz EM (2004) Genome-wide analysis of spatial gene expression in Arabidopsis flowers. Plant Cell 16: 1314–1326.
85. Xie Q (2000)ArabidopsisNAC1 transduces auxin signal downstream of TIR1 to promote lateral root development. Gene Dev 14: 3024–3036.
86. Hoth S, Morgante M, Sanchez J-P, Hanafey MK, Tingey SV, et al. (2002) Genome-wide gene expression profiling in Arabidopsis thaliana reveals new targets of abscisic acid and largely impaired gene regulation in the abi1-1
mutant. J Cell Sci 115: 4891–4900.
87. Ren T, Qu F, Morris TJ (2000) HRT gene function requires interaction between a NAC protein and viral capsid protein to confer resistance to turnip crinkle virus. Plant Cell 12: 1917–1925.
88. Fujita M, Fujita Y, Maruyama K, Seki M, Hiratsu K, et al. (2004) A dehydration-induced NAC protein, RD26, is involved in a novel ABA-dependent stress-signaling pathway. Plant J 39: 863–876.
89. Hegedus D, Yu M, Baldwin D, Gruber M, Sharpe A, et al. (2003) Molecular characterization of Brassica napus NAC domain transcriptional activators induced in response to biotic and abiotic stress. Plant Mol Biol 53: 383–397. 90. Rabbani MA, Maruyama K, Abe H, Khan MA, Katsura K, et al. (2003)
Monitoring expression profiles of rice genes under cold, drought, and high-salinity stresses and abscisic acid application using cDNA microarray and RNA gel-blot analyses. Plant Physiol 133: 1755–1767.
91. Seki M, Narusaka M, Ishida J, Nanjo T, Fujita M, et al. (2002) Monitoring the expression profiles of 7000 Arabidopsis genes under drought, cold and high-salinity stresses using a full-length cDNA microarray. Plant J 31: 279–292. 92. Tran LS, Nakashima K, Sakuma Y, Simpson SD, Fujita Y, et al. (2004)
Isolation and functional analysis of Arabidopsis stress-inducible NAC transcription factors that bind to a drought-responsive cis-element in theearly responsive to dehydration stress 1promoter. Plant Cell 16: 2481–2498.
93. Hayama R, Izawa T, Shimamoto K (2002) Isolation of rice genes possibly involved in the photoperiodic control of flowering by a fluorescent differential display method. Plant Cell Physiol 43: 494–504.
94. Jiao Y, Yang H, Ma L, Sun N, Yu H, et al. (2003) A genome-wide analysis of blue-light regulation of Arabidopsis transcription factor gene expression during seedling development. Plant Physiol 133: 1480–1493.
95. Vandenabeele S, Vanderauwera S, Vuylsteke M, Rombauts S, Langebartels C, et al. (2004) Catalase deficiency drastically affects gene expression induced by high light inArabidopsis thaliana. Plant J 39: 45–58.
96. Gechev TS, Gadjev IZ, Hille J (2004) An extensive microarray analysis of AAL-toxin-induced cell death inArabidopsis thalianabrings new insights into the complexity of programmed cell death in plants. Cell Mol Life Sci 61: 1185– 1197.
97. Breeze E, Harrison E, McHattie S, Hughes L, Hickman R, et al. (2011) High-resolution temporal profiling of transcripts duringArabidopsisleaf senescence reveals a distinct chronology of processes and regulation. Plant Cell 23: 873– 894.
98. John I, Hackett R, Cooper W, Drake R, Farrell A, et al. (1997) Cloning and characterization of tomato leaf senescence-related cDNAs. Plant Mol Biol 33: 641–651.
99. Lin JF, Wu SH (2004) Molecular events in senescingArabidopsisleaves. Plant J 39: 612–628.
100. Olsen AN, Ernst HA, Leggio LL, Skriver K (2005) NAC transcription factors: structurally distinct, functionally diverse. Trends Plant Sci 10: 79–87. 101. Miao Y, Laun T, Zimmermann P, Zentgraf U (2004) Targets of the WRKY53
transcription factor and its role during leaf senescence inArabidopsis. Plant Mol Biol 55: 853–867.
102. Robatzek S, Somssich IE (2001) A new member of theArabidopsisWRKY transcription factor family,AtWRKY6, is associated with both senescence and defence related processes. Plant J 28: 123–133.
103. Eulgem T, Rushton PJ, Robatzek S, Somssich IE (2000) The WRKY superfamily of plant transcription factors. Trends Plant Sci 5: 199–206. 104. Asai T, Tena G, Plotnikova J, Willmann MR, Chiu W-L, et al. (2002) MAP
kinase signalling cascade inArabidopsisinnate immunity. Nature 415: 977–983. 105. Ulker B, Somssich IE (2004) WRKY transcription factors: from DNA binding
towards biological function. Curr Opin Plant Biol 7: 491–498.
106. Yang P, Chen C, Wang Z, Fan B, Chen Z (1999) A pathogen- and salicylic acid-induced WRKY DNA-binding activity recognizes the elicitor response element of tobacco class I chitinase gene promoter. Plant J 18: 141–149. 107. Rouster J, Leah R, Mundy J, Cameron-Mills V (1997) Identification of a
methyl-jasmonate-responsive region in the promoter of a lipoxygenase-1 gene expressed in barley grain. Plant J 11: 513–523.
108. Rushton PJ, Macdonald H, Huttly AK, Lazarus CM, Hooley R (1995) Members of a new family of DNA-binding proteins bind to a conserved cis-element in the promoters of a-Amy2 genes. Plant Mol Biol 29: 691–702. 109. Riechmann JL, Meyerowitz EM (1998) The AP2/EREBP family of plant
transcription factors. Bio Chem 379: 633–646.
110. Gutterson N, Reuber TL (2004) Regulation of disease resistance pathways by AP2/ERF transcription factors. Curr Opin Plant Biol 7: 465–471. 111. Kizis D, Lumbreras V, Page`s M (2001) Role of AP2/EREBP transcription
factors in gene regulation during abiotic stress. FEBS Letters 498: 187–189. 112. Martin C, Bhatt K, Baumann K, Jin H, Zachgo S, et al. (2002) The mechanics
of cell fate determination in petals. Philos Trans R Soc Lond B Biol Sci 357: 809–813.
113. Peng J (2009) Gibberellin and jasmonate crosstalk during stamen development. J Integr Plant Biol 51: 1064–1070.
114. Borevitz JO, Xia Y, Blount J, Dixon RA, Lamb C (2000) Activation tagging identifies a conserved MYB regulator of phenylpropanoid biosynthesis. Plant Cell 12: 2383–2393.
115. Bender J, FINK GR (1998) ATR1, activates typtophan gene expression in
Arabidopsis. Proc Natl Acad Sci USA 95: 5565–5660.
116. Cheng H, Song S, Xiao L, Soo HM, Cheng Z, et al. (2009) Gibberellin acts through jasmonate to control the expression ofMYB21,MYB24, andMYB57to promote stamen filament growth inArabidopsis. PLoS Genet 5: e1000440. 117. Rounsley SD, Ditta GS, Yanofsky MF (1995) Diverse Roles for MADS Box
Genes in Arabidopsis development. Plant Cell 7: 1259–1269.
118. Theißen G (2001) Development of floral organ identity, stories from the MADS house. Curr Opin Plant Biol 4: 75–85.
119. Weigel D, Meyerowltz EM (1994) The ABCs of floral homeotic genes. Cell 78: 203–209.
120. Kang HG, Jeon JS, Lee S, An G (1998) Identification of class B and class C floral organ identity genes from rice plants. Plant Mol Biol 38: 1021–1029. 121. Yamaguchi T, Lee DY, Miyao A, Hirochika H, An G, et al. (2006) Functional
diversification of the two C-class MADS box genesOSMADS3andOSMADS58
inOryza sativa. Plant Cell 18: 15–28.
122. Mouradov A, Cremer F, Coupland G (2002) Control of flowering time: Interacting pathways as a basis for diversity. Plant Cell 14: S111–S130. 123. Higgins JA, Bailey PC, Laurie DA (2010) Comparative genomics of flowering
time pathways using Brachypodium distachyon as a model for the temperate grasses. PLoS One 5: e10065.
124. Singleton WR (1946) Inheritance of Indeterminate Growth in Maize. J Hered 37: 61–64.