Recognizing the Symptoms of Mental Illness
following Concussions in the Sports
Community: A Need for Improvement
Jane Topolovec-Vranic1,2, Stanley Zhang3, Hatty Wong3, Emily Lam3, Rowan Jing3, Kelly Russell4, Michael D. Cusimano1,3,5*, Canadian Brain Injury and Violence Research Team
1Li Ka Shing Knowledge Institute and Trauma and Neurosurgery Program, St. Michael’s Hospital, Toronto, Canada,2Faculty of Medicine (Occupational Science and Occupational Therapy), University of Toronto, Toronto, Canada,3Division of Neurosurgery, St. Michael’s Hospital, Toronto, Canada,4Department of Pediatrics, University of Manitoba, Winnipeg, Canada,5Faculty of Medicine and the Dalla Lana School of Public Health, University of Toronto, Toronto, Canada
¶ The individual members of the Canadian Brain Injury and Violence Research Team are provided athttp:// www.stmichaelshospital.com/research/tbi_violence_team.php.
Abstract
Objective
To evaluate the awareness of concussion-related symptoms amongst members of the sports community in Canada.
Methods
A cross-sectional national electronic survey was conducted. Youth athletes, parents, coaches and medical professionals across Canada were recruited through mailing lists from sports-related opt-in marketing databases. Participants were asked to identify, from a list of options, the symptoms of a concussion. The proportion of identified symptoms (cate-gorized as physical, cognitive, mental health-related and overall) as well as participant fac-tors associated with symptom recognition were analyzed.
Results
The survey elicited 6,937 responses. Most of the respondents (92.1%) completed the English language survey, were male (57.7%), 35–54 years of age (61.7%), with post-sec-ondary education (58.2%), or high reported yearly household income (>$80,000; 53.0%). There were respondents from all provinces and territories with the majority of respondents from Ontario (35.2%) or British Columbia (19.1%). While participants identified most of the physical (mean = 84.2% of symptoms) and cognitive (mean = 91.2% of symptoms), they on average only identified 53.5% of the mental health-related symptoms of concussions. Respondents who were older, with higher education and household income, or resided in
OPEN ACCESS
Citation:Topolovec-Vranic J, Zhang S, Wong H, Lam E, Jing R, Russell K, et al. (2015) Recognizing the Symptoms of Mental Illness following Concussions in the Sports Community: A Need for Improvement. PLoS ONE 10(11): e0141699. doi:10.1371/journal.pone.0141699
Editor:Xuchu Weng, Zhejiang Key Laborotory for Research in Assesment of Cognitive Impairments, CHINA
Received:March 5, 2015
Accepted:October 12, 2015
Published:November 4, 2015
Copyright:© 2015 Topolovec-Vranic et al. This is an open access article distributed under the terms of the
Creative Commons Attribution License, which permits unrestricted use, distribution, and reproduction in any medium, provided the original author and source are credited.
Data Availability Statement:All relevant data are within the paper and its Supporting Information files.
the Northwest Territories or Alberta identified significantly more of the mental health-related symptoms listed.
Interpretation
While Canadian youth athletes, parents, coaches and medical professionals are able to identify most of the physical and cognitive symptoms associated with concussion, identifica-tion of mental health-related symptoms of concussion is still lagging.
Introduction
Concussions occur at least 1.75 million times a year in North America and account for approx-imately 75% of all traumatic brain injuries (TBI) [1–3]. Sport-related concussion is the most common type of TBI in youth and sports account for over half of the concussions sustained by youth each year. In North America more than a half million youth under the age of 15 who sus-tain a concussion require hospital-based care each year [4]. This is particularly problematic for young people because of the potential cumulative or long term deleterious effects of concussion [5–10]. The Centre for Disease Control recently declared that sport concussions are reaching
“epidemic levels”and deserve further research [1].
Concussion can adversely affect a person’s cognitive, emotional and social functioning, and create lasting personal, familial and societal implications. In approximately 10–15% of individ-uals who have sustained concussion or mild TBI, persistent symptoms can impact an individu-al’s ability to return to daily functioning [11]. Physical symptoms (headache, nausea, fatigue and dizziness), cognitive symptoms (memory, attention and executive function impairments), and mental health concerns (depression, anxiety and post-traumatic stress disorder) are com-monly observed and can negatively impact upon an individual’s ability to recover from concus-sion [12]. Studies have indicated that 22–36% of patients report three or more of such
posttraumatic symptoms at 6 months post mild TBI [13] with about 23% not being recovered by 1 year post-injury [14].
Despite the high incidence and adverse outcomes associated with concussion, studies sug-gest that knowledge regarding the symptoms associated with concussion is generally low amongst athletes [15–18], coaches and trainers [19,20] and the general public [21,22]. Ade-quate knowledge regarding the identification, treatment and management of concussion-related symptoms is important in order to optimize recovery and decrease the risk of long-term brain injuries [23]. However, studies suggest that there are also significant gaps between physician practices and consensus-based concussion management guidelines [24]. These knowledge gaps may be partly explained by the general lack of concussion-related training in medical school curricula [25].
Recognizing the burden of concussion in Canada, the Public Health Agency of Canada (PHAC) commissioned a national electronic survey as part of a program to raise awareness of concussions to assess concussion-related awareness and knowledge across Canada in order to inform the development and implementation of programs and interventions. The survey was designed to evaluate awareness and knowledge of concussion amongst youth athletes, parents, coaches and medical professionals in Canada. We report the findings related to symptom iden-tification and respondent factors associated with higher proportions of symptom
identification. Competing Interests:The authors have declared
Methods
Ethics and Participants
Contacts of the Coaching Association of Canada (CAC) opted in to receive e-mail communica-tion and the survey link was sent to them along with the rules and regulacommunica-tions of participacommunica-tion. Returning the questionnaire implied consent to participate. Field Day Inc. collated the data and provided the anonymized unidentified dataset to the research team. Therefore, the responses provided by individuals who completed the survey could not be identified and the analysis was performed on the aggregated data. This consent procedure and the study were approved by St. Michael’s hospital’s Research Ethics Board. Data were derived from a national electronic survey conducted in April, 2012. The survey was comprised of ten true/false and multiple choice items which were designed to assess the awareness and understanding of con-cussion amongst the general Canadian public and within the sport community. The survey items included: knowledge of concussion symptoms, experience with concussion, attitude towards concussion and demographic information.
Primary Outcome: Concussion Symptom Recognition
The present questionnaire used in the survey was modified from a previously validated ques-tionnaire [15]. It was developed with both medical and sports experts and went through several pilot forms to maximize accuracy, comprehensiveness and readability before use. It also had a high internal consistency as measured by cronbach's alpha (0.87 for the overall questionnaire and 0.86–0.88 for each individual question). As with any questionnaire more evidence for vali-dation will occur over time.
The survey included a list of 17 symptoms and participants were asked to indicate“What are the signs and symptoms of a concussion (check all that apply)?”. A yes or no response option was provided for each symptom. For analyses, the symptoms were grouped into the fol-lowing categories: physical, 11 items (loss of consciousness, blurred vision, seizures or convul-sions, nausea or vomiting, dizziness, headaches, drowsiness or fatigue, neck pain, balance problems, light sensitivity, sound sensitivity); cognitive, 3 items (confusion, problems remem-bering, problems concentrating); and mental health-related, 3 items (nervousness or anxiety, sadness or depression, irritability).
Setting: Survey Administration
The survey was conducted online by an independent Canadian agency, Field Day Inc., and was hosted by surveymonkey.com. Awareness of the survey was promoted via a variety of methods such as: social media, contest incentives, Field Day’s website and three mass e-mailings. One mass e-mail was sent to a database of Canadian adults who opted in to receive emails related to surveys and contests (managed by Field Day); a second mass e-mail went to the Coaching Association of Canada's opt-in marketing database and a third mass e-mail was sent through the True Sport Movement opt-in marketing database. In addition, the survey link was distrib-uted through partner listservs/networks. As an incentive, participants were offered a chance to win one tablet computer donated by Field Day Inc.
Data Analyses
Statistical analyses were performed using SAS 9.3 (Chicago, USA). Respondents were instructed to check off yes or no for each of the 17 listed symptoms of concussion. To deter-mine the degree of concussion symptom identification, the percentage of all respondents indi-cating yes for each symptom was calculated. Also, the proportions of all symptoms identified across all respondents in each of the categories (physical, cognitive, mental health or overall) were calculated. Although the proportions for physical and cognitive symptoms were not nor-mally distributed, the results are shown as means and 95% confidence intervals based on the assumptions of the central limit theorem for large sample sizes [26].
To determine if there were differences in symptom identification proportions across the three groups of symptoms (physical, cognitive, mental health) an ANOVA (for normally dis-tributed data) or non-parametric tests (Kruskal–Wallis H test or Wilcoxon rank sum test for non-normally distributed data) were conducted. These same tests were used to assess whether there were differences in symptoms identification proportions across demographic variables (survey language, gender, age, education level, geographic location and self-identified primary role). Post-hoc tests using the least significant difference t-test or Nemenyi test were conducted to identify which comparisons were significantly different.
Results
Survey Respondents
Overall, 7258 people started and 6,937 people completed the survey (95.6% completion rate). As detailed inTable 1most of the respondents (92.1%) completed the English language survey, were male (57.7%), 35–54 years of age (61.7%), with post-secondary education (58.2%), or high reported yearly household income (>$80,000; 53.0%). The majority of respondents identified
themselves as a coach or trainer (73.5%). There were respondents from all provinces and terri-tories with the highest proportions from Ontario (35.2%) or British Columbia (19.1%).
Concussion Symptom Recognition
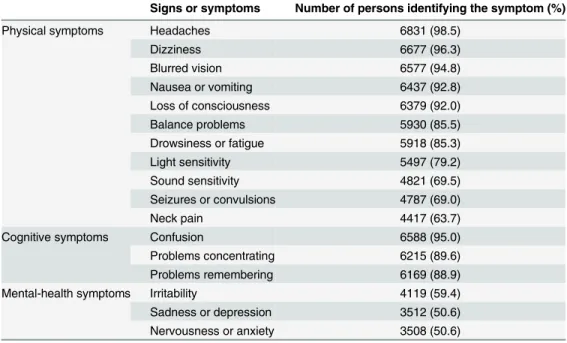
Fig 1summarizes the results of respondents’identification of concussion-related symptoms. On average, the respondents identified 84.2% (95% CI: 83.8%-84.7%) of the 11 listed physical symptoms associated with concussion. Most of the respondents identified headaches (98.5%) or dizziness (96.3%) with the fewest respondents identifying neck pain (63.7%) or seizures/con-vulsions (69.0%).
Similarly, respondents identified on average 91.2% (95% CI: 90.6%-91.7%) of the 3 listed cognitive symptoms with most participants (95.0%) identifying confusion problems as being associated with a concussion. In contrast, respondents on average only identified 53.5% (95% CI: 52.5%-54.6%) of the 3 listed mental health-related symptoms of concussions. The highest proportion of respondents (59.4%) identified irritability and the fewest identified nervousness or anxiety (50.6%)(Table 2).
Table 1. Demographic characteristics of the survey respondents (n = 6937).
Characteristic Number of respondents (%)
Survey language English 6391 (92.1)
French 546 (7.9)
Gender Male 4001 (57.7)
Female 2890 (41.7)
Prefer not to say 46 (0.7)
Age, years Under 15 4 (0.1)
15–24 562 (8.1)
25–34 1041 (15)
35–44 1880 (27.1)
45–54 2397 (34.6)
55–64 811 (11.7)
65–74 158 (2.3)
75+ 16 (0.2)
Prefer not to say 68 (1.0)
Yearly household income $0-$20,000 221 (3.2)
$20,001-$40,000 414 (6)
$40,001-$60,000 860 (12.4)
$60,001-$80,000 73 (1.1)
$80,001-$100,000 1377 (19.9)
$100,001-$150,000 1366 (19.7)
$150,001+ 929 (13.4)
Prefer not to say 1697 (24.5)
Education Some high school 45 (0.7)
High school 405 (5.8)
Some post-secondary 860 (12.4)
Post-secondary (college/university) 4034 (58.2)
Master’s Degree 798 (11.5)
Doctoral Degree 157 (2.3)
Professional Designation 495 (7.1)
Other 69 (1)
Prefer not to say 74 (1.1)
Rolea Athlete 3464 (48.4)
Parent or guardian of athlete 3836 (53.6)
Coachbor trainer 5258 (73.5)
Team, club, or organization personnel 1920 (26.8)
Educator, teacher or learning facilitator 1598 (22.3)
Medical professional 509 (7.1)
Other 451 (6.5)
Location Ontario 2444 (35.2)
British Columbia 1326 (19.1)
Alberta 1034 (14.9)
Quebec 622 (9.0)
Manitoba 447 (6.5)
Saskatchewan 294 (4.2)
New Brunswick 272 (3.9)
Nova Scotia 255 (3.7)
Table 1. (Continued)
Characteristic Number of respondents (%)
Newfoundland& Labrador 91 (1.3)
Outside Canada 51 (0.7)
Prince Edward Island 39 (0.6)
Northwest Territories 33 (0.5)
Yukon 23 (0.3)
Nunavut 6 (0.1)
a
Respondent could indicate up to 3 categories that best described their position. b
Includes community coach, competitive coach, and high performance coach.
doi:10.1371/journal.pone.0141699.t001
Table 2. Percentage of survey respondents to identified each of the listed physical, cognitive, and mental-health related symptoms (n = 6937).
Signs or symptoms Number of persons identifying the symptom (%)
Physical symptoms Headaches 6831 (98.5)
Dizziness 6677 (96.3)
Blurred vision 6577 (94.8)
Nausea or vomiting 6437 (92.8)
Loss of consciousness 6379 (92.0)
Balance problems 5930 (85.5)
Drowsiness or fatigue 5918 (85.3)
Light sensitivity 5497 (79.2)
Sound sensitivity 4821 (69.5)
Seizures or convulsions 4787 (69.0)
Neck pain 4417 (63.7)
Cognitive symptoms Confusion 6588 (95.0)
Problems concentrating 6215 (89.6)
Problems remembering 6169 (88.9)
Mental-health symptoms Irritability 4119 (59.4)
Sadness or depression 3512 (50.6)
Nervousness or anxiety 3508 (50.6)
doi:10.1371/journal.pone.0141699.t002
Fig 1. Average proportion of concussion-related symptoms identified by survey respondents.
F = 2982.24, p<.0001 Post-hoc tests were significant among pair-wise comparisons of physical, cognitive and mental symptoms.
Table 3. Average proportion of symptoms (95% CI) identified by demographic characteristic (n = 6937).
Characteristic Average Proportion of Symptoms Identified
Physical Cognitive Mental Health Total
Survey language
EnglishC 84.2(83.7,84.7) 91.1(90.6,91.7) 52.4(51.4,53.5) 79.8(79.3,80.3)
French 84.4(82.5,86.3) 91.3(89.5,93.2) 66.1(62.3,69.9)* 82.4(80.3,84.4)*
Gender
FemaleC 84.4(83.7,85.0) 91.6(91.0,92.3) 55.5(54.2,56.9) 80.6(79.9,81.2)
Male 84.1(83.4,84.8) 90.6(89.7,91.4) 50.9(49.3,52.5)* 79.4(78.6,80.1)
Prefer not to say 80.2(73.0,87.4)* 88.4(81.1,95.7)* 42.8(30.1,55.4)* 75.1(67.7,82.4)*
Age, years
Under 15 72.7(41.9,100) 66.7(28.9,100)* 50.0(0,100)* 67.6(0,100)*
15–24C 81.5(79.8,83.3) 88.6(86.5,90.7) 44.8(41.2,48.5) 76.3(74.5,78.1)
25–34 84.4(83.2,85.5)* 89.8(88.4,91.2) 50.7(48.0,53.4) 79.4(78.1,80.6)*
35–44 85.0(84.2,85.9)* 91.6(90.6,92.6)* 55.8(53.8,57.7)* 81.0(80.1,81.9)*
45–54 85.2(84.4,85.9)* 92.2(91.3,93.0)* 56.2(54.5,58.0)* 81.3(80.5,82.1)*
55–64 82.3(80.9,83.8) 90.9(89.4,92.4) 51.0(48.0,54.1)* 78.3(76.8,79.8)
65–74 80.1(77.0,83.3) 91.4(88.0,94.7) 49.8(43.0,56.5) 76.8(73.5,80.0)
75+ 76.7(63.4,90.1) 87.5(73.2,100.0) 54.2(30.0,78.3) 74.6(61.9,87.4)
Prefer not to say 83.8(79.5,88.2)* 91.7(86.8,96.6)* 50.0(39.6,60.4)* 79.2(74.5,84.0)*
Education completed
Some high schoolC 67.3(60.5,74.0) 76.3(66.6,86.0) 25.2(14.9,35.5) 61.4(54.8,68.1)
High school 79.9(77.8,82.0)* 87.9(85.5,90.3)* 42.0(37.6,46.3)* 74.6(72.4,76.8)*
Some post-secondary 83.2(81.8,84.5)* 90.2(88.7,91.7)* 49.6(46.6,52.6)* 78.5(77.1,79.9)* Post-secondary (college/university) 84.3(83.7,84.9)* 91.0(90.3,91.7)* 53.4(52.0,54.7)* 80.0(79.4,80.7)* Professional Designation 85.8(84.5,87.1)* 93.0(91.6,94.4)* 59.6(56.6,62.6)* 82.4(81.0,83.8)* Master’s Degree 84.4(81.2,87.5)* 92.8(89.5,96.1)* 60.7(54.0,67.5)* 81.7(78.4,85.0)* Doctoral Degree 87.6(86.0,89.1)* 94.7(93.1,96.4)* 60.8(57.0,64.6)* 84.1(82.5,85.8)*
Other 85.5(81.2,89.8)* 92.3(87.3,97.4)* 57.2(46.9,67.5)* 81.7(76.9,86.6)*
Prefer not to say 84.2(79.6,88.8)* 90.3(84.7,96.0)* 55.1(44.8,65.3)* 80.1(75.3,85.0)*
Yearly householdincome
$0-$20,000C 78.4(75.3,81.6) 86.3(82.7,89.9) 43.0(37.2,48.8) 73.5(70.3,76.8)
$20,001–40,000 80.5(78.3,82.6) 88.0(85.5,90.5) 45.8(41.5,50.1) 75.7(73.5,77.9)
$40,001–60,000 83.3(82,84.7.0)* 90.3(88.8,91.9)* 51.7(48.8,54.7)* 79.0(77.6,80.4)*
$60,001–80,000 82.3(77.8,86.8) 92.2(87.7,96.8)* 47.0(36.6,57.5) 77.8(73.1,82.5)
$80,001–100,000 83.9(82.9,84.9)* 90.6(89.4,91.7)* 52.4(50.0,54.7)* 79.5(78.4,80.6)* $100,001–150,000 86.4(85.5,87.3)* 92.6(91.5,93.7)* 58.3(56.0,60.6)* 82.5(81.5,83.6)*
$150001+ 87.3(86.2,88.4)* 94.4(93.2,95.6)* 60.2(57.5,63.0)* 83.8(82.6,85.0)*
Prefer not to say 83.3(82.3,84.2)* 90.5(89.4,91.6)* 51.4(49.3,53.5)* 78.9(77.9,79.9)*
Rolea
Athlete 85.6(84.9,86.2)# 92.4(91.7,93.1)# 54.9(53.5,56.4)# 81.3(80.7,82.0)#
Parent or guardian of athlete 85.9(85.3,86.4)# 92.4(91.8,93.1)# 56.3(54.9,57.7)# 81.8(81.2,82.4)# Coachbor trainer 85.3(84.8,85.8)# 92.4(91.8,93.0)# 55.1(53.9,56.4)# 81.2(80.6,81.8)# Team, club, or organizationpersonnel 86.2(85.4,87.1)# 93.5(92.7,94.4)# 56.7(54.8,58.6)# 82.3(81.5,83.2)# Educator, teacher or learning facilitator 86.9(86.1,87.8)# 93.9(93.0,94.8)# 57.3(55.2,59.4)# 82.9(82.0,83.9)# Medical professional 89.3(88.0,90.6)# 96.7(95.6,97.9)# 70.3(66.9,73.6)# 87.3(85.8,88.7)#
Other 83.3(81.4,85.3)# 89.9(87.7,92.1)# 52.2(48.0,56.3)# 79.0(76.9,81.1)#
There were some geographical variances in symptom recognition with respondents from Alberta and the Northwest Territories identifying the most total number of symptoms (82.6% and 83.4%, respectively). These same respondents identified the most physical symptoms (Alberta, 82.6%; Northwest Territories 83.4%). Respondents from the Yukon and Prince Edward Island identified the most cognitive symptoms of concussion (95.7% and 96.6%, respectively) whereas those from the Northwest Territories and Quebec identified most of the mental health-related symptoms (59.6% and 60.1%, respectively). Medical professionals identi-fied the highest proportion of all the symptoms (89.3% for physical symptoms, 96.7% for cog-nitive symptoms and 70.3% for mental health-related symptoms;Table 3). Coaches and trainers from competitive and non-competitive levels recognized a comparable number of symptoms as other respondents (e.g. athlete, parents or guardian of athletes) (Table 3).
Discussion
Unlike previous studies which have suggested that the concussion knowledge of the coaches, athletic trainers and the general public is generally poor [15,19,20] our cross-Canada study has shown that most people engaged in the sports community are familiar with the physical and cognitive symptoms associated with concussion. Also, the studies were published in 2007–2009 and concussion has received notable media attention since then. Despite finding higher levels of overall concussion symptom knowledge, our study highlights a potential gap in knowledge and awareness related to the mental health outcomes of concussion with respondents identifying, on average, only half of such symptoms (nervousness or anxiety, Table 3. (Continued)
Characteristic Average Proportion of Symptoms Identified
Physical Cognitive Mental Health Total
Location
AlbertaC 86.6(85.6,87.7) 92.3(91.1,93.6) 58.2(55.5,60.8) 82.6(81.4,83.8)
British Columbia 84.7(83.7,85.7)* 92.3(91.1,93.4) 54.9(52.6,57.3) 80.8(79.7,81.8)*
Manitoba 85.2(83.5,87.0) 92.4(90.5,94.3) 51.8(47.6,55.9)* 80.6(78.7,82.5)
New Brunswick 85.8(83.6,87.9) 92.6(90.3,94.9) 51.2(46.0,56.5)* 80.9(78.6,83.2)
Newfoundland & Labrador 84.0(80.2,87.8) 91.2(86.6,95.8) 51.3(41.5,61.1) 79.5(75.1,83.9)
Northwest Territories 88.4(83.3,93.6) 88.9(80.2,97.6) 59.6(43.8,75.4) 83.4(76.9,90.0)
Nova Scotia 84.4(82.3,86.5) 92.8(90.2,95.4) 53.1(47.9,58.2) 80.3(78.1,82.6)
Nunavut 56.1(22.8,89.3)* 55.6(13.2,97.9)* 33.3(0,77.6) 52.0(16.7,87.2)*
Ontario 83.2(82.4,84.0)* 89.6(88.6,90.5)* 50.6(48.8,52.3)* 78.5(77.7,79.4)*
Outside Canada 80.2(74.3,86.1)* 88.9(82.5,95.3)* 47.1(35.3,58.8) 75.9(69.7,82.1)*
Prince Edward Island 84.8(80.0,89.7) 96.6(91.2,100.0) 42.7(28.7,56.7)* 79.5(73.9,85.0)
Quebec 82.9(81.1,84.6)* 90.8(89.1,92.6) 60.1(56.5,63.7) 80.2(78.4,82.1)*
Saskatchewan 83.3(81.1,85.6)* 91.8(89.4,94.3) 50.1(45.0,55.2)* 79.0(76.6,81.3)*
Yukon 81.4(73.8,89.1)* 95.7(89.1,100.0)* 49.3(32.0,66.6)* 78.3(70.2,86.3)*
aRespondent could indicate up to 3 categories that best described their position. bIncludes community coach, competitive coach, and high performance coach. cComparison group.
*p<0.05 as compared with the comparison group.
#p<0.05 as compared with all other roles in the group combined.
sadness or depression and irritability) as possible symptoms of concussion. This gap is signifi-cant as studies suggest a positive association between childhood mild TBI and the risk of sub-sequent psychiatric diagnoses [27]. In a study of 42 children with mild TBI admitted to the hospital, 35.7% had mood disorders and 21.4% had anxiety disorders 6 months following their injury [28]. A study of nearly 5,000 adolescents across Ontario has shown that adoles-cents who have sustained TBI where they lost consciousness for at least 5 minutes or were hospitalized due to their TBI were at significantly greater risk of psychological distress, sui-cide attempts, being prescribed medication for anxiety, depression or both, as well as being victimized through bullying, cyber-bullying, or being threated with a weapon at school [29]. Moreover, a retrospective cohort study of over 36,000 adolescents in the US indicated that a history of concussion was associated with a 3.3-fold greater risk (95% CI: 2.0–5.5) for subse-quent depression diagnosis prompting the authors to conclude that clinicians should screen for depression amongst youth who have sustained concussion to enable effective treatment [27]. The physical, cognitive and mental health-related symptoms of concussion occur at dif-ferent rates and last for various periods of time and thus constitute an important diagnostic criterion of postconcusion syndrome for both ICD10 and DSM-IV. However, such symptom occurrence rates vary drastically depending on studies. For instance, Oddy et al (1978) reported that 20.8%, 37.5%, and 33% of the studied cohort had depression, memory problem, and fatigue, respectively[30], while only 8% had memory problems and 11% had fatigue in Ettenhofer’s study [31]. Gerberich et al (1983) found that 14% of the 3063 secondary school varsity football players had blurred/double vision [32]. In contrast to these rates, recent study by Grubenhoff et al (2011) showed that the rate for depression, fatigue, and blurred/double vision in concussed children with altered mental state is 24%, 82%, and 39%, respectively [33]. The rate variations are likely from a number of sources, such as the studied cohorts, the time of study subjects taking questionnaires related to the time course of their concussion, the mechanisms of the injury, the type of sports, etc.
Although the occurrence rate of physical, cognitive and mental health-related symptoms of concussion fluctuated, one can still argue that it might directly affect neither one’s concus-sion knowledge nor his ability to make the accurate diagnosis of concusconcus-sion provided that the individual had adequate knowledge of concussion. Although the occurrence of concus-sion symptoms changes, survey respondents’knowledge is reflected and thus can be mea-sured by their ability to correctly identify the right symptoms. This same approach of measurement has also been used to assess the public knowledge of the symptoms of myocar-dial infarction [34]. The authors don’t believe that the number of survey symptoms itself has any effects on the results, although the number of symptoms in some categories is small. Almost the same small number of questions can be found in subscales of SF-36, a well vali-dated and widely used questionnaire [35].
The recognition of symptoms appeared to vary geographically with identification of the pro-portion of symptoms listed ranging from 52.0% (Nunavut) to 83.4% (Northwest Territories). The exact reasons are unknown. It is tempting to speculate that provinces and regions with more accessible concussion educational resources or campaigns may provide their residents some advantages in knowing and even managing concussion. The exact reasons are a topic of future research to explore and identify. Our findings provide direction as to potential geo-graphic areas where concussion awareness strategies could be focussed, for example through engagement with the local media. Blake and colleagues reported that evidence-based messages regarding the clinical and public health significance of concussion and the impact of body checking in youth ice hockey were accurately reported in English-language Canadian newspa-per coverage [38] supporting the potential use of media as a vehicle for knowledge translation to aide in injury prevention strategies [27]. Whether such coverage improves concussion-related knowledge amongst readers needs to be evaluated.
Self-identified medical professionals identified the highest proportion of the listed concus-sion-related symptoms. Surprisingly, our survey showed that individuals who self-identified as coaches and trainers were no better able to recognize concussion related symptoms than athletes (total symptoms: coach/trainer 81.2%; sports related personnel 82.3%; athlete 81.2%), particularly mental-health related symptoms (coach/trainers 55.1%; sports related personnel 56.7%; athletes 54.9%). This is worrisome as coaches are often the first line responders in cases of suspected concussion, and it is their decisions on the field (to return the athlete to the game or not) which can have dramatic and long-lasting repercussions upon the health and recovery of the athlete. Educational initiatives such as workshops about con-cussion geared at coaches have been shown to effectively improve their concon-cussion-related knowledge [[17,18]]. While Cusimano et al. reported significantly increased concussion knowledge scores amongst athletes following viewing of an educational video, the increased knowledge was not sustained at a two-month follow-up [15–18] highlighting the need for strategies to enhance knowledge retention. Studies also support the notion of multifaceted approaches such as education combined with rule changes, changes in the built environment and better use of protective equipment to prevent concussion [39,40].
Limitations
Strengths of this study include the large national sample and the concurrent assessment of vari-ous groups including athletes, parents, coaches and medical professionals. Although our sam-ple size was large and national in scope, our findings are limited by evaluating group level data rather than individual-level data. Also, the results were derived from self-reported knowledge, rather than a test of concussion-related knowledge (e.g. through case studies or multiple choice responses). Finally, future research is needed to determine whether the ability to recognize symptoms of concussion translates into the prevention of future injuries, or better manage-ment of sustained injuries.
Conclusions
In our large national survey of athletes, parents, coaches and medical professionals a high num-ber of the physical and cognitive symptoms associated with concussion were identified. How-ever, significantly fewer respondents associated the mental health symptoms of nervousness or anxiety, sadness or depression, and irritability with concussion. These findings help to shed light on areas in which concussion awareness and knowledge initiatives need to be targeted to enhance the prevention and recovery from sport-related concussion.
Supporting Information
S1 Supporting Information. Members of the Canadian Brain Injury and Violence Research Team.
(DOCX)
S2 Supporting Information. Concussion survey for 2012. (DOCX)
Acknowledgments
Members of the Canadian Brain Injury and Violence Research Team are listed in the Support-ing Information.
Author Contributions
Conceived and designed the experiments: MDC. Performed the experiments: MDC JTV SZ HW EL RJ KR. Analyzed the data: MDC JTV SZ HW EL RJ KR. Contributed reagents/materi-als/analysis tools: MDC. Wrote the paper: MDC JTV SZ HW EL RJ KR.
References
1. Bazarian JJ, Veazie P, Mookerjee S, Lerner EB. Accuracy of mild traumatic brain injury case ascertain-ment using ICD-9 codes. Acad Emerg Med. 2006; 13(1):31–8. doi:10.1197/j.aem.2005.07.038PMID: 16365331.
2. Halstead ME, Walter KD, Council on Sports M, Fitness. American Academy of Pediatrics. Clinical report—sport-related concussion in children and adolescents. Pediatrics. 2010; 126(3):597–615. doi: 10.1542/peds.2010-2005PMID:20805152.
3. National Center for Injury Prevention and Control (2003) Report to Congress on Mild Traumatic Brain Injury in the United States: Steps to Prevent a Serious Public Health Problem. Atlanta, GA: Centers for Disease Control and Prevention.
5. Demakis GJ, Rimland CA. Untreated mild traumatic brain injury in a young adult population. Arch Clin Neuropsychol. 2010; 25(3):191–6. doi:10.1093/arclin/acq004PMID:20197295.
6. Langlois JA, Rutland-Brown W, Wald MM. The epidemiology and impact of traumatic brain injury: a brief overview. J Head Trauma Rehabil. 2006; 21(5):375–8. PMID:16983222.
7. Papa L, Mendes ME, Braga CF. Mild Traumatic Brain Injury among the Geriatric Population. Curr Transl Geriatr Exp Gerontol Rep. 2012; 1(3):135–42. doi:10.1007/s13670-012-0019-0PMID: 23589783; PubMed Central PMCID: PMC3625036.
8. Staudenmayer KL, Diaz-Arrastia R, de Oliveira A, Gentilello LM, Shafi S. Ethnic disparities in long-term functional outcomes after traumatic brain injury. J Trauma. 2007; 63(6):1364–9. doi:10.1097/TA. 0b013e31815b897bPMID:18212662.
9. Styrke J, Sojka P, Bjornstig U, Bylund PO, Stalnacke BM. Sex-differences in symptoms, disability, and life satisfaction three years after mild traumatic brain injury: a population-based cohort study. J Rehabil Med. 2013; 45(8):749–57. doi:10.2340/16501977-1215PMID:24002310.
10. Zemper ED. Two-year prospective study of relative risk of a second cerebral concussion. Am J Phys Med Rehabil. 2003; 82(9):653–9. doi:10.1097/01.PHM.0000083666.74494.BAPMID:12960905.
11. Carroll LJ, Cassidy JD, Peloso PM, Borg J, von Holst H, Holm L, et al. Prognosis for mild traumatic brain injury: results of the WHO Collaborating Centre Task Force on Mild Traumatic Brain Injury. J Rehabil Med. 2004;(43 Suppl: ):84–105. PMID:15083873.
12. Cancelliere C, Hincapie CA, Keightley M, Godbolt AK, Cote P, Kristman VL, et al. Systematic Review of Prognosis and Return to Play After Sport Concussion: Results of the International Collaboration on Mild Traumatic Brain Injury Prognosis. Archives of physical medicine and rehabilitation. 2014; 95(3S): S210–S29. doi:10.1016/j.apmr.2013.06.035PMID:24581907.
13. Hou R, Moss-Morris R, Peveler R, Mogg K, Bradley BP, Belli A. When a minor head injury results in enduring symptoms: a prospective investigation of risk factors for postconcussional syndrome after mild traumatic brain injury. Journal of neurology, neurosurgery, and psychiatry. 2012; 83(2):217–23. doi:10.1136/jnnp-2011-300767PMID:22028384.
14. Cassidy JD, Boyle E, Carroll LJ. Population-based, inception cohort study of the incidence, course, and prognosis of mild traumatic brain injury after motor vehicle collisions. Archives of physical medicine and rehabilitation. 2014; 95(3 Suppl):S278–85. doi:10.1016/j.apmr.2013.08.295PMID:24581913.
15. Author. Canadian minor hockey participants' knowledge about concussion. Can J Neurol Sci. 2009; 36 (3):315–20. PMID:19534331.
16. Delaney JS, Lacroix VJ, Leclerc S, Johnston KM. Concussions during the 1997 Canadian Football Lea-gue season. Clin J Sport Med. 2000; 10(1):9–14. PMID:10695844.
17. McCrea M, Hammeke T, Olsen G, Leo P, Guskiewicz K. Unreported concussion in high school football players: implications for prevention. Clin J Sport Med. 2004; 14(1):13–7. PMID:14712161.
18. Sye G, Sullivan SJ, McCrory P. High school rugby players' understanding of concussion and return to play guidelines. Br J Sports Med. 2006; 40(12):1003–5. doi:10.1136/bjsm.2005.020511PMID: 17124109; PubMed Central PMCID: PMC2577443.
19. Covassin T, Elbin R 3rd, Stiller-Ostrowski JL. Current sport-related concussion teaching and clinical practices of sports medicine professionals. J Athl Train. 2009; 44(4):400–4. doi: 10.4085/1062-6050-44.4.400PMID:19593422; PubMed Central PMCID: PMC2707074.
20. Guilmette TJ, Malia LA, McQuiggan MD. Concussion understanding and management among New England high school football coaches. Brain injury. 2007; 21(10):1039–47. doi:10.1080/
02699050701633080PMID:17891566.
21. McKinlay A, Bishop A, McLellan T. Public knowledge of 'concussion' and the different terminology used to communicate about mild traumatic brain injury (MTBI). Brain injury. 2011; 25(7–8):761–6. doi:10. 3109/02699052.2011.579935PMID:21619461.
22. Swift TL, Wilson SL. Misconceptions about brain injury among the general public and non-expert health professionals: an exploratory study. Brain injury. 2001; 15(2):149–65. doi:10.1080/026990501458380 PMID:11260765.
23. Babul S, Korn P, Goldman R, Pike I, Hay C. Preventing adverse concussion outcomes: the online con-cussion awareness training toolkit (catt). Br J Sports Med. 2014; 48(7):563–4. doi: 10.1136/bjsports-2014-093494.11
24. Lebrun C, Mrazik M, Prasad A, Taylor T, Jevremovic T. Sport concussion knowledge base and current practice- a survey of physician sections from the ontario medical association. Br J Sports Med. 2014; 48(7):623. doi:10.1136/bjsports-2014-093494.171
26. Hogg RV, McKean JW, Craig AT (2005) Introduction to mathematical statistics. Upper Saddle River, N. J.: Pearson Education. 704 p.
27. Chrisman SP, Richardson LP. Prevalence of diagnosed depression in adolescents with history of con-cussion. J Adolesc Health. 2014; 54(5):582–6. doi:10.1016/j.jadohealth.2013.10.006PMID: 24355628; PubMed Central PMCID: PMC3999295.
28. Luis CA, Mittenberg W. Mood and anxiety disorders following pediatric traumatic brain injury: a pro-spective study. Journal of clinical and experimental neuropsychology. 2002; 24(3):270–9. doi:10.1076/ jcen.24.3.270.982PMID:11992209.
29. Author. Suicidality, bullying and other conduct and mental health correlates of traumatic brain injury in adolescents. PLoS One. 2014; 9(4):e94936. doi:10.1371/journal.pone.0094936PMID:24736613; PubMed Central PMCID: PMC3988100.
30. Oddy M, Humphrey M, Uttley D. Subjective impairment and social recovery after closed head injury. Journal of neurology, neurosurgery, and psychiatry. 1978; 41(7):611–6. PMID:690638; PubMed Cen-tral PMCID: PMC493104.
31. Ettenhofer ML, Abeles N. The significance of mild traumatic brain injury to cognition and self-reported symptoms in long-term recovery from injury. Journal of clinical and experimental neuropsychology. 2009; 31(3):363–72. doi:10.1080/13803390802175270PMID:18618356.
32. Gerberich SG, Priest JD, Boen JR, Straub CP, Maxwell RE. Concussion incidences and severity in sec-ondary school varsity football players. American journal of public health. 1983; 73(12):1370–5. PMID: 6638230; PubMed Central PMCID: PMC1651258.
33. Grubenhoff JA, Kirkwood MW, Deakyne S, Wathen J. Detailed concussion symptom analysis in a pae-diatric ED population. Brain injury. 2011; 25(10):943–9. doi:10.3109/02699052.2011.597043PMID: 21749192.
34. Whitaker S, Baldwin T, Tahir M, Choudhry O, Senior A, Greenfield S. Public knowledge of the symp-toms of myocardial infarction: a street survey in Birmingham, England. Family practice. 2012; 29 (2):168–73. doi:10.1093/fampra/cmr079PMID:21976661.
35. McHorney CA, Ware JE Jr, Raczek AE. The MOS 36-Item Short-Form Health Survey (SF-36): II. Psy-chometric and clinical tests of validity in measuring physical and mental health constructs. Medical care. 1993; 31(3):247–63. PMID:8450681.
36. Whelan-Goodinson R, Ponsford J, Johnston L, Grant F. Psychiatric disorders following traumatic brain injury: their nature and frequency. J Head Trauma Rehabil. 2009; 24(5):324–32. doi:10.1097/HTR. 0b013e3181a712aaPMID:19858966.
37. Fann JR, Burington B, Leonetti A, Jaffe K, Katon WJ, Thompson RS. Psychiatric illness following trau-matic brain injury in an adult health maintenance organization population. Arch Gen Psychiatry. 2004; 61(1):53–61. doi:10.1001/archpsyc.61.1.53PMID:14706944.
38. Blake T, Rock M, Emery C. Prioritizing concussion prevention in youth ice hockey: an assessment of english-language canadian newspapers as a vehicle for evidence-based knowledge translation. Br J Sports Med. 2014; 48(7):570. doi:10.1136/bjsports-2014-093494.28
39. Author. Mechanisms of team-sport-related brain injuries in children 5 to 19 years old: opportunities for prevention. PLoS One. 2013; 8(3):e58868. doi:10.1371/journal.pone.0058868PMID:23555602; PubMed Central PMCID: PMC3610710.