Performance Study of Square Footing Resting Over Geo-Grid
Reinforced Sand
Ravindra Budania*, Dr. R. P. Arora**, Dr. B. S. Singhvi*** and Hitesh Kumar
Veerwal*
*(M.Tech scholar, Department of Civil Engineering, College of Technology and Engineering, MPUAT, Udaipur)
** (Associate Professor& Head, Department of Civil Engineering, College of Technology and Engineering, MPUAT, Udaipur)
*** (Professor, Department of Civil Engineering, College of Technology and Engineering, MPUAT, Udaipur)
ABSTRACT
Decreasing availability of good construction sites and increasing construction activities for infrastructural developments throughout the world has forced the civil engineers to utilize unsuitable sites or weak soil. So for sustainable infrastructural development, there is a need to utilize these type of unsuitable land by the use of ground improvement techniques. There are different ground improvement techniques to stabilize the poor ground in which soil reinforcement is an effective and reliable technique. The objective of the present study was to determine the effects of the geo-grid reinforcement on the bearing capacity of sand. The model tests have been conducted using square footing at u/B=0.25 & 0.55. The average relative density kept up throughout all the tests is 65%. The sand is reinforced by multiple layers (1, 2, 3 & 4) of geo-grid. The ultimate bearing capacity of sand with square footing was computed by load-settlement curve. By these load-settlement curve, an appreciable increase in bearing capacity of sand was observed as the depth to the first layer of reinforcement increased. The optimum depth of placement of the first layer was 0.5B.
Keyword:
Bearing capacity, geo-grid, and Load-settlement curve.I.
GENERAL
All engineering structure resting on the earth must be carried out by one interfacing element called a foundation.Foundation is that part of the structure which is in direct contact with soil, to transfers the forces and moments from the superstructure to soil below to keep the stresses within the limit for maintaining the stability of the structure. By the engineer, soil is considered as a complex material produced by weathering of the solid rock. For the civil engineers, the behavior of soil plays very important role in the stability of any structure. The design of foundation consists of two different parts: one is the ultimate bearing capacity of soil below foundation and second is the acceptable settlement that a footing can undergo without any adverse effect on the superstructure.But recent decades have experienced a massive rise in demand for land owing to rapid industrialization and urbanization and hence the subsequent rise in infrastructure building.
Decreasing availability of good construction sites and increasing construction activities for infrastructural developments throughout the world has forced the civil engineers to utilize unsuitable sites or weak soil. It is a risk to construct over such land due to high compressibility, uneven settlement, and low bearing capacity. The improvement in strength
properties of such soil has become one of the important tasks of civil engineers due to the scarcity of good sites, dramatic rise in land prices and increase in infrastructure growth. For this purpose, many researchers investigated ground improvement techniques for soil to increases the bearing capacity (Patil and Rakaraddi, 2015). There are different ground improvement techniques to stabilize the poor ground in which soil reinforcement is an effective and reliable technique.
Soil reinforcing is defined as, a construction material composed of cohesion less free drainage materials, which is strong in compression but weak in tension, and the reinforcing elements, with high tensile strength materials, placed in the soil fill, supplying the soil mass with the necessary tensions. Reinforcing material like metal strip, geo-fome, geotextile and geo-grids are to enhance the ultimate bearing
capacity of the foundation. Now a day’s use of geo -grid has increased due to its high tensile strength at low strain, open grid structure which causes bonding between geo-grid and foundation soil, long service life, light weight.
Providing the geo-grid in the foundation or pavement generally have 3 benefits, (i) reduces the cost of construction material (ii) serviceability of the developed model is greater as compared to
the unreinforced section (iii) the shear stress reduces as we provide the geo-grid reinforcement due to increase in the internal angle of friction.
II.
LITERATURE REVIEW
Many investigations have been done to look at the advantage of different types of soil reinforcement techniques on a different type of footings, and their effects to enhancing the property of soil. Some of the previous studies have been summarized below:
Dash et al., (2001) performed laboratory model test on strip footing supported by sand bed reinforced with geo-cell mattress. The test was performed by changing the pattern of geo-cell formation, pocket size, height and width of geo-cell mattress, tensile stiffness of geo-grid used to make the geo-cell and relative density of sand. The result shows that pressure-settlement behaviour of strip footing resting on geo-cell reinforced sand is approximately linear even up to a settlement of about 50% of footing width and a load as high as 8 times the ultimate capacity of unreinforced one.
The performance improvement is significant up to a
geo-cell height equal to 2 times the width of the footing. Beyond that height, the improvement is
only marginal. To obtain maximum benefit, the top
of geo-cell mattress should be at a depth of 0.1B from the bottom of the footing.
Dash et al., (2003) by conducting small-scale model tests, the effectiveness of geo-cell reinforcement placed in the granular fill overlying soft clay beds has been studied. The test beds were applied with uniform loading by a rigid circular footing. The overall performance of the system depends on the factors such as width and height of geo-cell mattress and presence of a planar geo-grid layer at the base of geo-cell mattress. The performance of the system can be improved substantially by providing geo-cell reinforcement in the sand layer lying above. With the addition of another geo-grid layer at the base of the geo-cell mattress, load carrying capacity and stiffness of foundation bed increases considerably. With the increase in the height of geo-cell mattress, this beneficial effect decreases.
Kumar et al., (2005) proposed a method to obtain the pressure-settlement characteristics of rectangular footings resting on reinforced sand based on the constitutive law of soil. The effect of the weight of soil mass has been considered in the determination of stress. The base of footing has been assumed smooth, as the effect of roughness on pressure-settlement characteristics has been found to be negligible Saran (1977). Stresses in soil mass have been computed using the theory of elasticity. Strains have been computed from the hyperbolic soil model defined by Kondner (1963). The
analysis has been validated with the model test result conducted by Kumar (1997). Predicted and model test result matches well up to two-third of ultimate bearing pressure.
Basudhar et al., (2007) investigated on the Effect of the footing size, a number of reinforcing layers, reinforcement placement pattern and bond length and the relative density of the soil on the load settlement characteristics of the circular footing over the sand bed with geotextile. By the increase in a number of reinforcement layers settlement values are decreases. There is substantially increment of BCR values for each increment in the number of reinforcement layers.
Sireesh et al., (2009) the paper based on various parameters such as, thickness of unreinforced sand layer above clay bed, width and height of geo-cell mattress, influence of an additional layer of planar geo-grid placed at the base of the geo-cell mattress, relative density of the sand fill in the geo-cell varies in the model test. If the height of geo-cell mattress is greater than 1.8 times the diameter of footing, the effect of voids on the performance of footing reduces. With geo-cells filled with dense soil better improvement in performance can be achieved.
Dewaikar et al., (2011) observed on the model circular footing with reinforced soil to study the load-settlement behavior. The study showed that the use of mine waste and reinforcing materials towards the improved performance of a soft clay sub-grade in respect to bearing capacity and settlements, further, in the case of BCR and SRF rubber grid performed better than the Geo-grid. The better performance of rubber grid could be a cheaper and viable alternative for effective ground improvement.
Kolay et al., (2013) investigated the ultimate bearing capacity of rectangular footing supported by geo-grid reinforced silty clay soil with a thin layer of sand on the top. Initially, one geo-grid is placed at the interface of soil with u/B equals to 0.667 and it is found that bearing capacity increases with an average of 16.67% and when one geo-grid is placed at the middle of the sand layer with u/B equals 0.33, bearingcapacity increases with an average of 33.33%.
the upper bound finite element limit analysis in combination with linear optimization. It was found that for two layers of reinforcements embedded in sand, with the value of ϕ varying between 30 and 45, corresponding to the critical position of the reinforcement, the optimum diameter of the circular reinforcement sheets lies within the range of 3.15d– 3.80d.
Cicek et al., (2015) presented laboratory model tests of a surface strip footing on unreinforced and reinforced sand beds to investigate the effects of reinforcement length. Multiples of footing width B was employed in the tests, namely B, 2B, 3B, 5B and, in some tests, even 7B. It was seen from the model tests for all reinforcement types that reinforcement length affects the behavior of the load–settlement curve. When one-layered reinforcement was used, there was still a point where the load-settlement curve changed its slope. However, for L/B values greater than one, the curve did not show such a failure point until very large settlements were encountered. Harikumar et al., (2016) performed Laboratory plate load tests on a model footing resting on sand bed reinforced with plastic multi-directional reinforcements. The bearing capacity and settlement were evaluated and the effect of depth to the first layer, the spacing between reinforcements in a layer, number of layers and spacing between layers were investigated. An appreciable increase in bearing capacity was
observed as the depth to the first layer of reinforcement increased beyond 0.1B. The optimum depth of placement of the first layer was 0.5B. Placing reinforcements beyond 0.5B depth, in a single layer, resulted in a reduction in the increase of bearing capacity. The bearing capacity increased by 1.3 times and the settlements reduced by almost 72%.
III.
MATERIAL AND
METHODOLOGY
3.1 Material 3.1.1 Sand
The sand which we use in our experiment is collected from the Kharka River situated to near Udaipur. It underwent through cleaning to remove the debris from it, like, the leaves, organic particles, twigs, etc. Then it was oven dried and was to pass through a 600μ sieve and retained
through 300μ sieve size. And the retained sample
was used in our experimental work. As dry sand does not include the effect of moisture, it can be used as soil medium for the test.
The experiments are conducted in the medium dense sand, achieving relative density as 65%. The coefficient of the angle of friction is
found out to be 40˚ for the desired density of the
sample by the direct shear test. The geotechnical properties of sand are enlisted in the table below.
Table 3.1 Geotechnical Properties of Sand (As per laboratory tests)
S. No Property Code referred Value
1. Specific Gravity IS 2720 (Part 3/Sec 1) - 1980 2.62
2 Maximum Dry Density IS 2720 (Part 7) - 1980 15.08 kN/m3
3 Relative density, Id IS 2720 (Part 14)- 1983 65%
4 Working density, γd IS 2720 (Part 28)- 1974 14.32 kN/m3
3.1.2 Geogrid
Biaxial geo-grid (BXF30) was used for this investigation and it was provided by M/s Strata systems (India) Private Limited. Strata Geo-systems (India) Private Limited is a joint venture
company in India with Strata Systems Inc., USA. Strata India is manufacturing the whole range of Strata soil reinforcement products in India. Physical and mechanical properties of biaxial geo-grids are as follows:-
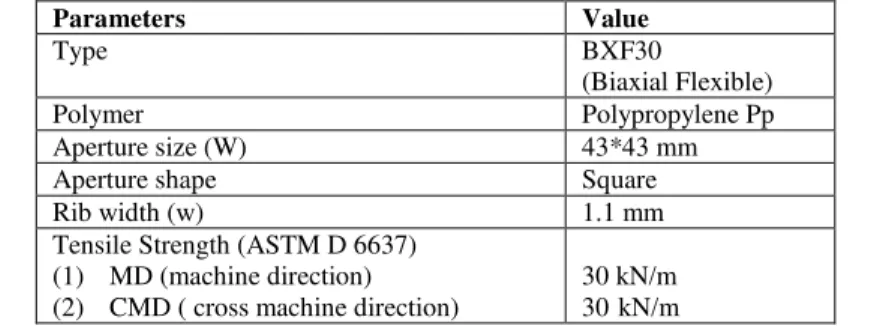
Table 3.2 Properties of the geo-grid (source Strata Geo-systems (India) Private Limited)
Parameters Value
Type BXF30
(Biaxial Flexible)
Polymer Polypropylene Pp
Aperture size (W) 43*43 mm
Aperture shape Square
Rib width (w) 1.1 mm
Tensile Strength (ASTM D 6637) (1) MD (machine direction) (2) CMD ( cross machine direction)
30 kN/m
3.1.3 Model Footing
The footing of Square shape are made of mild steel plates in 2cm thickness to provide the rigid footing conditions were used in this investigation. The dimensions of square footing, footing were used 13.3cm×13.3cm have the area equal to 177 cm2. The bases of the footing was roughened. On footings surface, little grove of 0.5cm was provided to apply load.
3.2 Methodology
3.2.1 Sand Bed Preparation
Dimensions of the tank were measured accurately and volume for the required fill was calculated. Now, by adopting rain falling technique, the test tank was filled with sand and height of fall was maintained to achieve the desired relative density of the sand for the experiments work. After several trials, as the relative density was achieved by maintaining the different height of fall, it is spread in 2.5cm layers through rain falling technique, which takes around 17.5kg sand for each layer, which is found out from the calculation. After each fall, the sand layer is leveled by means of a scale.
3.2.2 Geo-Grid Placement On Sand
After preparation of sand bed at desired height, the placement of geo-gridwas proceeded for this experimental work. Geo-grids were placed horizontally in between at desired depth from the bottom of footing after leveling the surface. After going through several kinds of literature, the ratio (u/B) was taken 0.25 and 0.50 and ratio (h/B) was taken 0.3 for this investigation for the placing of a different layer of geo-grids. (u= depth of first layer, B= width of model footing and h= distance between two consecutive geo-grid layer)
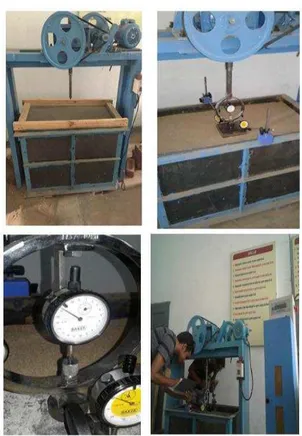
3.2.3 Experiment Procedure For Square Footings
Experimental procedures, which were performed for Square, Rectangular and Circular footing at different depths of reinforcement with varying number of geo-grid layers were listed below:-
First, the test tank was filled with maintained working density in unreinforced and reinforced condition. And after that, the footing was placed at desired location over the sand fill to transfer the load vertically.
Then the grooving metallic ball was placed on the depression of center position, and then the load transferring shaft with attached proving ring was placed over it, through which the load was transferred to the footing.
Two dial gauges were placed on the surface of the footing on the opposite sides of it. Then the
initial readings of two dial gauges were noted, and as the load is increased, the readings were noted down.
The load was applied gradually in an increasing manner and the footing was allowed to settle under the applied load. The load increment was maintained until the footing settlement gets stabilized which was measured from the two dial gauge readings up to 25mm as per IS: 1888-1982 code guideline.
Settlement corresponding to each load increment was noted and the test result will be plotted in term of load-settlement curve. Ultimate bearing capacity for each test will be determined from load-settlement curve using tangent intersection method.
Fig 3.1 Experiment on Square Footings at u/B ratio 0.25 & 0.50
IV.
RESULT AND DISCUSSION
4.1 Test Result Of Square Footing
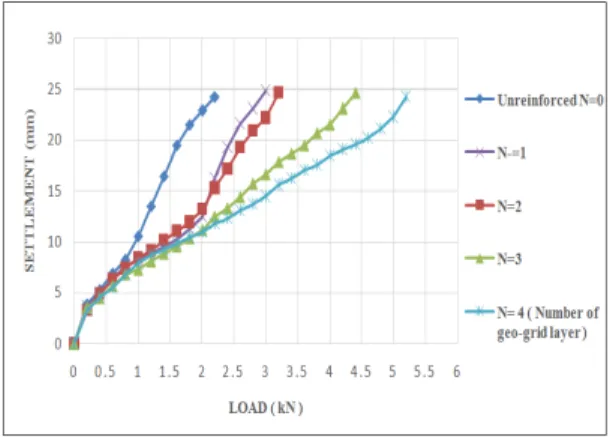
Results of load test on square footing are plotted in term of the load-settlement curve in Fig. 4.1 and Fig. 4.2 with multiple numbers (1, 2, 3, and 4) geo-grid layers at varying u/B ratio of 0.25 and 0.50, and h/Bratio of 0.30.
Fig. 4.1Load-settlement curve of Square footing (u/B = 0.25)
Fig. 4.2Load-settlement curve of Square footing (u/B = 0.50)
From the load-settlement curve shown in Figure 4.1 and Figure 4.2, ultimate load carrying capacity of sand at u/B ratio i.e. 0.25 & 0.50 has been calculated with varying number of geo-grid layer. Fig 4.1 shows that the bearing capacity of unreinforced sand was 90.39 kN/m2 at ultimate load 1.6 kN whereas, the bearing capacity of sand when, square footing resting on 4 geo-grid layers was 276.83 kN/m2 at ultimate load 4.9 kN for u/B ratio 0.25. From the above test results, it is observed that the bearing capacity of sand was increased as an increase in geo-grid layers. At single geo grid layer the bearing capacity of sand increase rapidly but for 2 geo grid layers there is no significant increase occurs as compare to the single
layer reinforced sand’s bearing capacity. After that when number of geo-grid layers was increased up to 4, the bearing capacity of that reinforced soil is
3.06 time higher than the unreinforced sand’s
bearing capacity at u/B ratio 0.25.
Fig 4.2 shows that the bearing capacity of unreinforced sand was 90.39 kN/m2 at ultimate load 1.6 kN whereas, the bearing capacity of sand when, footing resting on 4 geo-grid layers was 305.08 kN/m2 at ultimate load 5.4 kN for u/B ratio 0.50. From the above test results, it is observed that the bearing capacity of sand was increased after sand reinforced by 4 geo- grid layers about 3.38
time the unreinforced sand’s bearing capacity at
u/B ratio 0.50.
From the Fig 4.1 and Fig 4.2, it is observed that the ultimate bearing capacity of sand is increased as an increase in number of geo-grid and also the total settlement at failure load decreases as number of geo-grid layers increases. Because when the sand strains in response to applied loads, tensile forces are generated in the geo-grid because of the frictional interaction between the geo-grid and the sand. That developed tensile force, keeps the reinforced sand mass is in stable equilibrium. As shows in fig 4.1 and 4.2, the bearing capacity of sand at increasing number of geo-grid layers from 1 to 4 is observed 146.18 kN/m2, 163.84 kN/m2, 214 kN/m2 and 276.83 kN/m2 at ultimate load 2.6 kN, 2.9 kN, 3.8 kN and 4.9 kN respectively at u/B ratio 0.25 and 203.38 kN/m2, 220.33 kN/m2, 265.53 kN/m2 and 305.08 kN/m2 at ultimate load 3.6 kN, 3.9 kN, 4.7 kN and 5.4 kN respectively at u/B ratio 0.50 respectively. By comparing the load-settlement curve at u/B ratio of 0.25 & 0.5 (Fig 4.1 and 4.2), it is observed that bearing capacity of sand is increased as an increase in u/B ratio from 0.25 to 0.50 and increase in the number of reinforcement layers up to 4. The higher increase in bearing capacity of square footing at u/B ratio 0.50 with four geo-grid layers because the portion of reinforcement which lies within the shear zone below the footing will have its tensile strength effectively mobilized.
V.
CONCLUSION
In this work, the performance of square footingresting over geo-grid reinforced sand has been studied based on a series of experimental tests. The results of all the experiment test have been discussed in previous chapter. On the basis of discussion of results, following conclusion are made:
1. According to investigation, an appreciable increase in bearing capacity of sand was observed as thedepth to the first layer of reinforcement increased.The optimum depth of placement of the first layer was 0.5 times the width of footing.Thebearing capacity of sand for square footings increased by 1.3 times the
unreinforced sand’s bearing capacity.
3. Increasing the number of reinforcement layers from one to four led to the best responseobserved, in terms of load carrying capacity of reinforced sand. A proper placement of geo-grid reinforcement is required to obtain significant load settlement and bearing capacity improvement.
REFRENCES
[1]. Albusoda, B. S. and Hussein, R. S. (2013). Bearing Capacity of Eccentrically Loaded Square Foundation on Compacted Reinforced Dune Sand over Gypseous Soil. Journal of Earth Sciences and Geotechnical Engineering03: 47-62. [2]. Azzam, W. R., & Nasr, A. M. (2015).
Bearing capacity of shell strip footing on reinforced sand. Journal of advanced research, 6: 727-737.
[3]. Badakhshan, E. and Noorzad, A. (2015).The load eccentricity effects on the behavior of circular footing reinforced with geogrid sheet. Journal of Rock Mechanics and Geotechnical Engineering07:691-699.
[4]. Basudhar, P. K., Saha, S., & Deb, K. (2007). Circular footings resting on geotextile-reinforced sand bed. Geotextiles and Geomembranes, 25: 377-384.
[5]. Chakraborty, M., & Kumar, J. (2014). Bearing capacity of circular foundations reinforced with geogrid sheets. Soils and Foundations, 54: 820-832.
[6]. Cicek, E., Guler, E., & Yetimoglu, T. (2015). Effect of reinforcement length for different geosynthetic reinforcements on strip footing on sand soil. Soils and Foundations, 55: 661-677.
[7]. Dash, S. K., Krishnaswamy, N. R. and Rajagopal, K. (2001). Bearing capacity of strip footings supported on geocell-reinforced sand.Geotextiles and Geomembranes19: 235-256.
[8]. Dash, S. K., Sireesh, S., & Sitharam, T. G. (2003). Model studies on circular footing supported on geocell reinforced sand underlain by soft clay. Geotextiles and Geomembranes, 21: 197-219.
[9]. Dewaikar, D. M., Guptha, K. G., & Chore, H. S. (2011). An Experimental Study into Behaviour of Circular Footing on Reinforced Soil. International Journal on Advanced Science, Engineering and Information Technology, 1: 630-634. [10]. Harikumar, M., Sankar, N., &
Chandrakaran, S. (2016). Behaviour of model footing resting on sand bed
reinforced with multi-directional reinforcing elements. Geotextiles and Geomembranes, 44: 568-578.
[11]. Indian Standard Institutions, "Code of Practice". 1498 - Classification & Identification on soils for general Engineering purposes, 1888 - Methods of Load test and soils, 2720 - Methods of tests on soils, Part -III - Determination of Specific Gravity, part IV-1985- sieve analysis, part – XIV- The relative density, Part - V - Grain Size analysis.
[12]. Kolay, P. K., Kumar, S. and Tiwari, D. (2013).Improvement of bearing capacity of shallow foundation on geo-grid reinforced silty clay and sand.Journal of Construction Engineering 10: 205-210. [13]. Kumar, A., Walia, B. S. and Saran, S.
(2005). Pressure-settlement charecteristics of rectangular footings on reinforced sand.Geotechnical and Gelogical Engineering23:469-481.