Submitted14 October 2016 Accepted 9 December 2016 Published31 January 2017
Corresponding author Richard M. Bateman, R.Bateman@kew.org
Academic editor David Roberts
Additional Information and Declarations can be found on page 73
DOI10.7717/peerj.2893
Copyright 2017 Bateman et al.
Distributed under
Creative Commons CC-BY 4.0
OPEN ACCESS
In situ
morphometric survey elucidates
the evolutionary systematics of the
Eurasian
Himantoglossum
clade
(Orchidaceae: Orchidinae)
Richard M. Bateman1, Attila Molnár V.2and Gábor Sramkó2,3
1Royal Botanic Gardens Kew, Richmond, Surrey, United Kingdom 2Department of Botany, University of Debrecen, Debrecen, Hungary
3MTA-DE ‘‘Lendület’’ Evolutionary Phylogenomics Research Group, Debrecen, Hungary
ABSTRACT
Background and Aims. The charismaticHimantoglossum s.l.clade of Eurasian orchids contains an unusually large proportion of taxa that are of controversial circumscriptions and considerable conservation concern. Whereas our previously published study addressed the molecular phylogenetics and phylogeography of every named taxon within the clade, here we use detailed morphometric data obtained from the same populations to compare genotypes with associated phenotypes, in order to better explore taxonomic circumscription and character evolution within the clade.
Methods. Between one and 12 plants found in 25 populations that encompassed the entire distribution of theHimantoglossum s.l.clade were measuredin situfor 51 morphological characters. Results for 45 of those characters were subjected to detailed multivariate and univariate analyses.
Key Results. Multivariate analyses readily separate subgenus Barlia and subgenus
Comperiafrom subgenusHimantoglossum, and also the early-divergentH. formosum
from the less divergent remainder of subgenus Himantoglossum. The sequence of
divergence of these four lineages is confidently resolved. Our experimental approach to morphometric character analysis demonstrates clearly that phenotypic evolution
withinHimantoglossumis unusually multi-dimensional.
Conclusions. Degrees of divergence between taxa shown by morphological analyses approximate those previously shown using molecular analyses.Himantoglossum s.l. is readily divisible into three subgenera. The three sections of subgenusHimantoglossum—
sectioncaprinum. Detailed patterns of gain and loss demonstrate that several different categories of flower markings are inherited independently. Along with the dimensions of labellar lobes, these pigmentation characters have been over-emphasised in previous taxonomic treatments. Increased plant vigour was a crucial element of the origin of the genus, but vegetative characters underwent remarkably little subsequent evolution. Attempts to reconstruct hypothetical ancestors at internal nodes of the phylogeny are weakened by (a) uncertain placement ofSteveniella as sister to Himantoglossum s.l. and (b) uncertain relationships among subtly different putative species within sectioncaprinum. Nonetheless, heterochronic/allometric trends, ultimately limited by functional constraints, clearly dictate transitions between contrasting flower sizes and complex labellum shapes.
SubjectsBiodiversity, Conservation Biology, Evolutionary Studies, Plant Science, Taxonomy
Keywords Barlia,Comperia, Disparity, Functional constraints, Heterochrony,Himantoglossum, Hybridisation, Migration, Molecular phylogeny, Morphometrics, Orchid, Parallelism, Speciation, Systematics
INTRODUCTION
Background to the genus
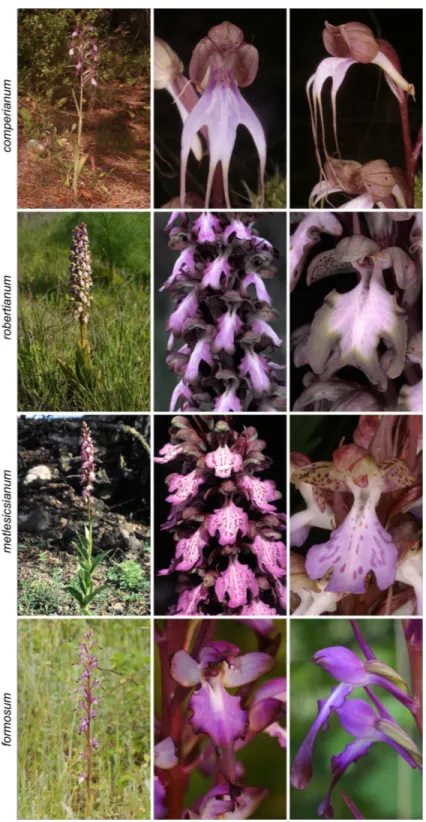
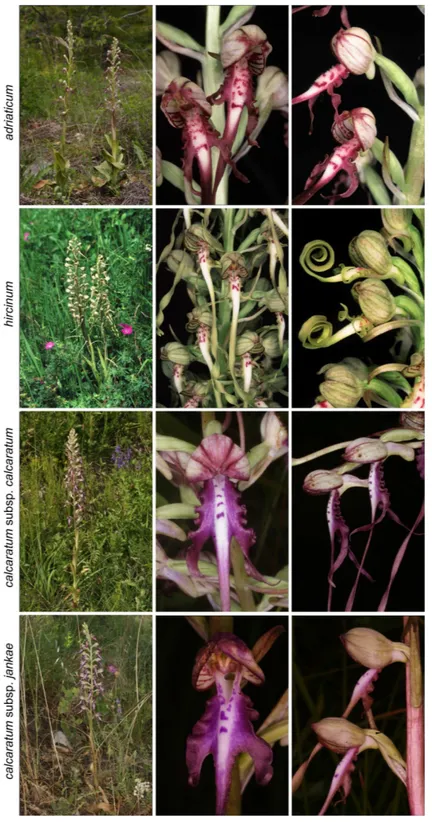
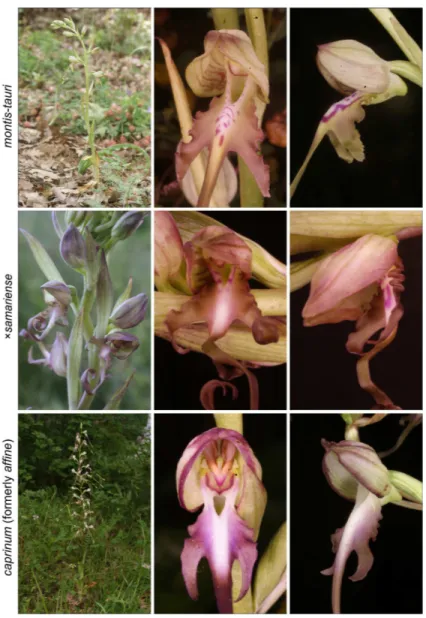
The Himantoglossum s.l. clade (broadly termed the lizard orchids) is a particularly appealing group for detailed examination by evolutionary systematists. All members of Himantoglossumare large and charismatic plants, despite having a more diminutive putative sister-group in the form ofSteveniella satyrioides(Delforge, 2000;Bateman et al., 2003). These terrestrial orchids (well-illustrated byGriebl, 2008) are vegetatively robust and produce long racemes of large flowers that are characterised by distinctive, unusually elaborate labella (Figs. 1–3).
Within the genus, two distinct levels of evolutionary divergence have become evident from phylogenetic studies. At the higher level, four groups—two of them previously viewed as arguably monotypic genera—are readily distinguishable using either morphological or molecular characters. Although the distinctiveness of these four groups is not in question, their evolutionary relationships have been much debated, detailed morphological accounts (e.g.,Nelson, 1968;Teschner, 1980;Delforge, 1999) having graded into molecular phylogenetic studies toward the close of the 20th century (e.g., Pridgeon et al., 1997;
Bateman et al., 2003; reviewed byDelforge, 1999;Bateman, 2012a). More recently,Sramkó et al. (2014) presented a multi-genome phylogenetic study of the group that was strongly supported statistically, and revealed substantial errors in each of the speculative classificatory systems and/or evolutionary scenarios devised by previous authors from morphological observations alone.
At lower taxonomic levels, several taxa that are more subtly differentiated on either morphological or molecular grounds have at various times been recognised formally within the H. robertianumgroup (formerly the genusBarlia) and especially within the
Figure 1 Typical flowers of taxa ofHimantoglossumanalysed in the present study, 1:H. comperianum,
Figure 2 Typical flowers of taxa ofHimantoglossumanalysed in the present study, 2:H. adriaticum,
Figure 3 Typical flowers of taxa ofHimantoglossumanalysed in the present study, 3:H. montis-tauri,
H.×samarienseandH. caprinum(formerlyH. affine). Images: Attila Molnár V.
taxonomic rank of each named taxon (cf.Nelson, 1968;Sundermann, 1973;Vermeulen, 1977;Moore, 1980;Sundermann, 1980;Teschner, 1980;Wood, 1983;Delforge, 1999;Bateman et al., 2003;Kreutz, 2004;Delforge, 2006;Kreutz, 2006;Vakhrameeva & Tatarenko, 2008;
Bateman, 2012a;Sramkó & Molnár, 2012;Bateman et al., 2013;Sramkó et al., 2014;Tsiftsis, 2016). These ambiguities of taxonomic circumscription have contributed to, but have not been wholly responsible for, several past nomenclatural errors, including those that recently required the confusing transfer of the epithet‘caprinum’from one familiar taxon to another (Molnár et al., 2012;Sramkó et al., 2012).
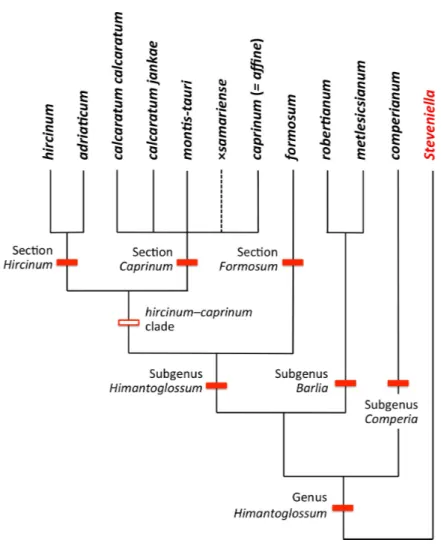
Figure 4 Taxonomy of the genusHimantoglossum s.l.generated by integrating the results of the present study with those ofSramkó et al. (2014).
feature in at least one conservation programme at the more localised scale of individual nations. Interest in theHimantoglossum s.l.clade is by no means confined to taxonomic
issues. Along with many other European orchid species,Himantoglossumtaxa have been
to discussions of founder effects on oceanic islands (Bateman, 2012b;Bateman et al., 2014) and of phenotypic convergence (Bateman et al., 2013).
Project objectives and classificatory preamble
We here report a detailedin situmorphometric survey that, together with the molecular phylogenetic study of Sramkó et al. (2014), constitutes an integrated monograph of the expanded genus. The present morphometric survey arguably includes all of the named Eurasian taxa in theHimantoglossum s.l.clade other than the taxonomically controversial
H. galilaeum (a putative endemic of the Levant). Our study was performed with the following objectives:
(1) Determining the optimal circumscriptions of, and most appropriate ranks for, taxa
previously awarded formal names within theHimantoglossumclade.
(2) Identifying the most diagnostic characters that separate those re-circumscribed taxa, thereby facilitating their eventual re-description.
(3) Assessing the relative rates of morphological divergence (described here) versus molecular divergence (as documented bySramkó et al., 2014) among the taxa. (4) Summarising phenotypic character evolution within the clade, in search of patterns
that could imply the intervention of particular underlying evolutionary processes. (5) Speculating on the nature and relative significance of the inferred evolutionary
processes.
Past taxonomic and nomenclatural treatments have together placedHimantoglossumin
a frustratingly ambiguous quagmire of errors and uncertainties, where the most sensible (though impractical) solution would be to start afresh. In an attempt to avoid inducing yet more confusion, we have summarised asFig. 4our preferred (though still provisional) classification resulting from our studies (i.e., the present work, plus that ofSramkó et al., 2014). As far as possible, the names included in this Figure are used throughout the remainder of this text, though it is important to note that‘‘H. jankae’’is used throughout the text, Figures and Tables as an abbreviation of‘‘H. calcaratum jankae’’.
MATERIALS AND METHODS
Fieldwork
Fieldwork for this study was conducted between spring 2010 and spring 2014, other
than the measurements ofH. metlesicsianumon Tenerife taken during 2001. We sampled
across the entire Eurasiatic distribution of the genusHimantoglossum s.l.(including the former generaBarliaandComperia), excepting only the Kurdish regions of Iran and Iraq
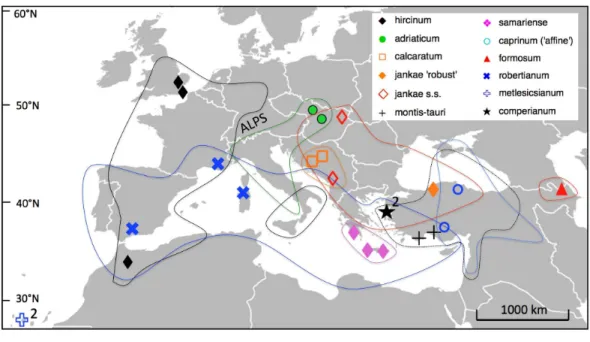
(Fig. 5). Where necessary, collections were made under permits NE662, HNPD 45–2/2000,
HNPD 250–2/2001, MDENCA 19642, and TTENCHA 60547. RMB (accompanied by PJ Rudall) focused on western European and North African populations plusH. comperianum, whereas GS and AMV toured central and eastern Europe. Silica-gel samples for potential DNA analysis were collected from a total of 131 populations (most of them listed in Table S1 ofSramkó et al., 2014), but only a carefully selected subset of 25 populations was subjected to detailed morphometric analysis for the present study. Two or three populations were
Figure 5 Distributions of the study taxa and locations of the populations measured.
measured for only one population, and the Levant endemicH. galilaeum, which we were unable to pursue in the field.
We planned to study at least ten plants per population. However, as the majority of the populations of all species in the group are small, only 11 of the 25 study populations contained more than five measurable plants, and five populations yielded only a single measurable individual. In total, 152 plants were measured, the number of individuals scored per putative species ranging from three (H.×samariense) to 30 (H. jankae, assuming that
this species also includes‘robustissimum’); 115 of the measured plants belonged to the
taxonomically problematichircinum–caprinumclade.
Morphometric characters measured
Our complete list of potentially scorable characters is presented asAppendix 3. While in the field we measuredin situ 12vegetative characters and two floral characters (asterisked
inAppendix 3); the remaining 37 characters were recorded on the same data sheet later
in the same day. Field measurements were made using either a 15 cm steel rule bearing
increments of 0.5 mm (RMB) or electronic calipers (GS +AMV). A flower–bract unit
C18 C16 C23
C17
C15 C19
C35 C34
C22
C26 C25
C24
neck
crotch armpit
torso
ab
d
o
m
e
n
th
o
rax
spur
leg
arm crenulated shoulder
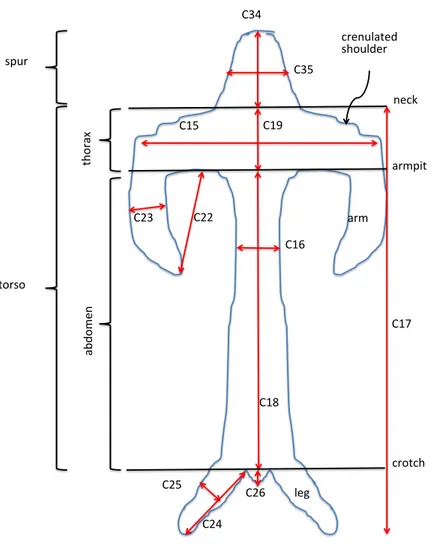
Figure 6 Explanation of labellum terminology and dimensions measured.
graduated ocular (RMB) or an electronic caliper (GS and AMV). Labellum dimensions, and our associated anthropomorphic terminology, are illustrated inFig. 6.
The colours of the ‘limbs’ and the ‘torso’ margin of each labellum, and of the reverse (abaxial) surfaces of the outer perianth segments, were matched to the nearest one or two colour block(s) of the Royal Horticultural Society Colour Chart. They were later quantified through conversion to three CIE (Commission Internationale de I’Eclairage) coordinates. Two of these (‘x’ and ‘y’) define a position on a square grid superimposed onto a near-triangular array of colours that pale toward white at the centre of the triangle. The corners correspond with pure blue, pure green and pure red, respectively. Density of pigment was represented by a third coordinate (reflectivity, ‘Y’), which decreases in value outward from the centre of the triangle.
Characters utilised
(e.g.,Bateman & Denholm, 1985;Bateman, Rudall & Moura, 2013), we then fine-tuned the initial character list to optimally fit theHimantoglossumclade.
Two characters included in this preliminary list were shown to be invariant. All study plants proved to have lanceolate rather than oblanceolate leaves (C14: Shape of longest leaf) and, much to our surprise, all had ‘abdomens’ that spiral sinistrally rather than dextrally (C20: Direction of spiralling of torso). The widest leaf was usually also the longest leaf, prompting omission from the analyses of the character representing width of widest leaf (C13) in favour of width of longest leaf (C12). Another character (C51: Distance separating viscidia) proved impractical to measure, as in all species other thanH. comperianumthe paired viscidia are laterally fused and consequently lack readily measurable separation.
And the two field teams (RMB+PJ Rudall, GS+AMV) applied subtly different criteria
to delineating the near-arbitrary distinction between basal leaves and cauline (bracteoidal) leaves, necessitating summation of values for the two original characters (C9 plus C10) into a single aggregate character (C9A). The above five characters were therefore omitted from all mathematical analyses. A further character (C39: Lateral teeth extending from lateral petals) was scored only after the mathematical analyses had been completed.
The surviving 45 characters described the stem and inflorescence and bracts (8), leaves (3), labellum (18), spur (3), lateral petals (2), lateral sepals (9) and gynostemium (2). They could alternatively be categorised as metric (35), meristic (4), multistate-scalar (5), and bistate (1). Subsets were also specified to represent vegetative characters (C1–C14: 11 of 14 characters usable) and anthocyanin-based pigmentation characters (C3, C27–C31, C41–C46: all 12 characters usable).
Data analysis
Our chosen approach to data analysis and interpretation was both detailed and experimental. Morphometric data for individual plants were summarised on an Excel v14.3 spreadsheet. Mean values, plus sample standard deviations and coefficients of variation for all metric and meristic characters, were calculated for every character in each study population that yielded three or more measurable individuals. Univariate and bivariate analyses were summarised and presented using Deltagraph v5.6 (SPSS/Red Rock software, 2005).
The full morphometric matrix contained 152 individuals ×45 usable characters
and contained only 1.1% missing values. Only two characters incurred more than 4% missing values. The first was basal bract length (C6: 24% missing), a character that was introduced only after data collection had begun. The second was width of longest leaf (C12: 8% missing), a character that was no longer measurable in some plants due to precocious, environmentally-induced desiccation. All calculated ratios were also omitted from the multivariate analyses as, by definition, they duplicated their constituent characters. The assembled data were analysed by multivariate methods using Genstat v14 (Payne et al., 2011).
was in turn used to construct a minimum spanning tree (Gower & Ross, 1969) and subsequently to calculate principal coordinates (Gower, 1966;Gower, 1985)—compound vectors that incorporate positively or negatively correlated characters that are most variable and therefore potentially diagnostic. Principal coordinates are especially effective for simultaneously analysing heterogeneous suites of morphological characters and have the additional advantage of comfortably accommodating missing values; ordinations have proven invaluable for assessing relationships among orchid species and populations throughout the last three decades (e.g., Bateman & Denholm, 1983; analytical approach reviewed in detail byBateman, 2001).
Twelve separate multivariate analyses were conducted, differing in (a) whether the rows of data were individual scores or population means, (b) whether non-hircinum– caprinumgroup species were excluded, and (c) whether either the vegetative organ subset or pigmentation subset of characters was omitted from the analyses:
(A) All 152 individuals measured, all 45 characters included.
(B) All 152 individuals measured, all 11 vegetative characters excluded. (C) All 152 individuals measured, all 12 pigmentation characters excluded.
(D) 115 individuals of thehircinum–caprinumclade only, all 44 characters included. (E) 115 individuals of the hircinum–caprinum clade only, all 11 vegetative characters
excluded.
(F) 115 individuals of thehircinum–caprinumclade only, all 12 pigmentation characters excluded.
(G) All 25 populations measured, all 46 characters included.
(H) All 25 populations measured, all 11 vegetative characters excluded. (I) All 25 populations measured, all 13 pigmentation characters excluded.
(J) 17 populations of thehircinum–caprinumclade only, all 45 characters included. (K) 17 populations of thehircinum–caprinum clade only, all 11 vegetative characters
excluded.
(L) 17 populations of thehircinum–caprinumclade only, all 13 pigmentation characters excluded.
Compared with the above figures, the number of pigmentation characters increased by one in the population-level analyses because we judged it necessary to add a character indicating the proportion of plants within each population that bore any labellum markings (C30a). In addition, the character that in the matrix of individuals represented the length of ‘tail’ on the labellum (C26) was modified to simply represent the proportion of plants in each population that had developed ‘tails’, irrespective of tail length. A further character, position of lateral sepals (C48), became invariant (all plants scoring as state 1) in the six analyses that were restricted to thehircinum–caprinumclade.
Journal nomenclatural statement
The electronic version of this article, produced in Portable Document Format (PDF), will represent a published work according to the International Code of Nomenclature for algae, fungi and plants (ICN). Hence, the new names and new combinations contained in the electronic version are effectively published under that Code from the electronic version alone. In addition, new nomenclatural combinations contained in this article that have been issued with LSID identifiers by International Plant Names Index (IPNI) will eventually be made available by the journal to the Global Names Index. The IPNI LSIDs can be resolved, and the associated information viewed, through any standard Web browser, by appending the LSID contained in this publication to the prefix ‘‘http://ipni.org/’’. The online version of this work is archived and available from the following digital repositories: PeerJ, PubMed Central and CLOCKSS.
RESULTS
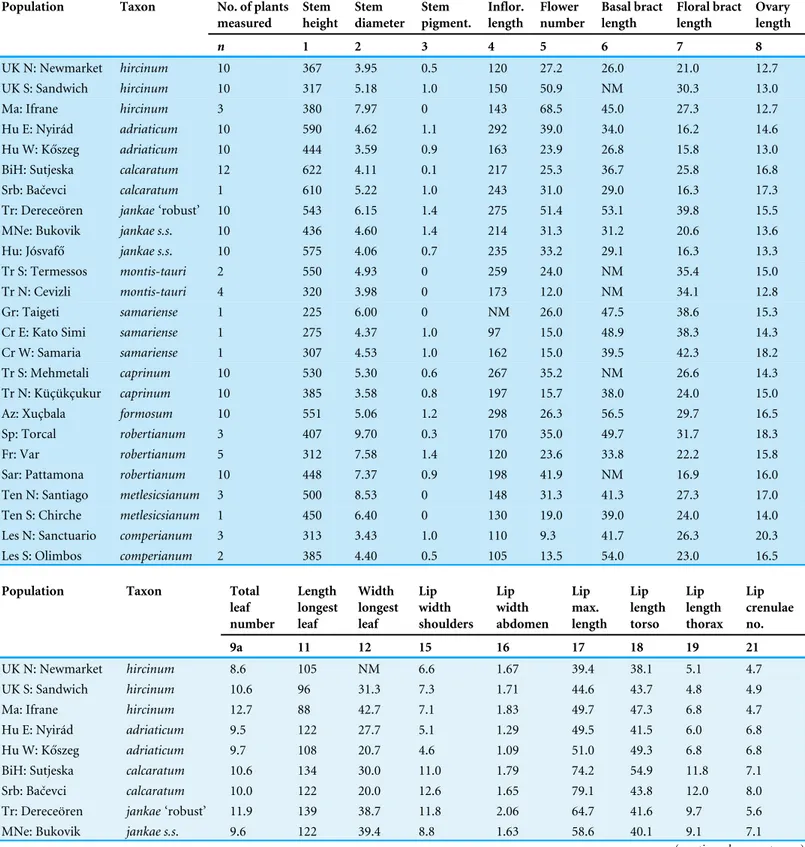
Table 1gives population mean values for all 47 usable characters. These were subjected to a range of multivariate and univariate analyses, seeking to tease out biologically meanigful observations from an unusually complex dataset.
Multivariate analyses
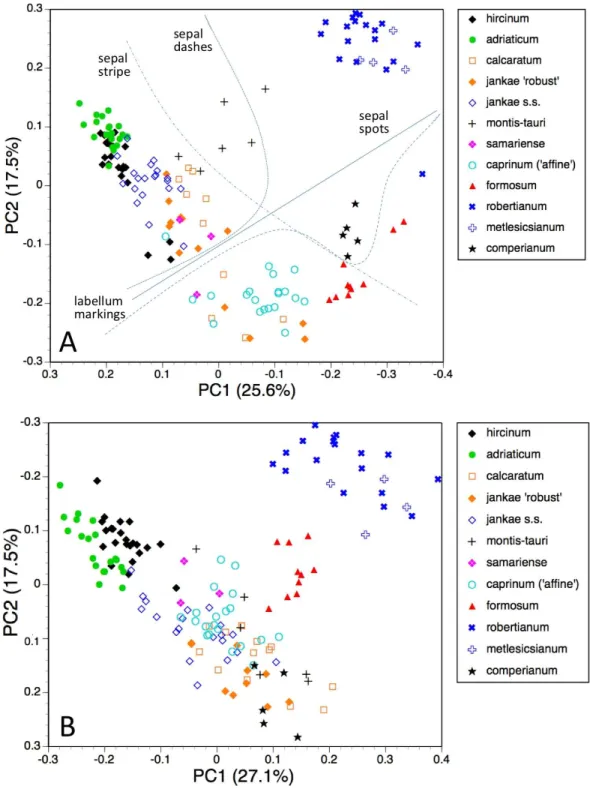
Of the 12 principal coordinates analyses performed (listed as A–L in the ‘Materials and Methods’), eight proved to be more informative than the remaining four and hence form the core of this paper. The four analyses that were discarded were those based on reduced matrices lacking vegetative characters (analyses B, E, H, K above), which yielded results that were only marginally different from those obtained from the full matrices. Moreover, examination of the relative contributions of individual characters to each principal coordinate further emphasised that vegetative characters had proved to be relatively unimportant when analysing theHimantoglossum s.l.clade. The remaining eight plots of principal coordinates 1 versus 2 (lower-order coordinates are not depicted) are presented asFigs. 7–10, and the characters contributing most to the first four axes of each analysis are presented inTables 2–5. Characters that are italicised in these Tables increase in value in parallel with increase in the value of the axis (i.e., from negative to positive scores); non-italicised characters increase in the converse direction.
Individual plants, all taxa present
The first two coordinates based on analysis of individuals of all taxa for all usable characters (Fig. 7A) together account for 43% of the total variance, and work together to organise the plants in a diagonal array. All members of the hircinum–caprinumclade other than
H. montis-tauri form a near-linear arrangement from the top-left to the mid-bottom of the plot, whereas the morphologically distinctive subgenusBarliais isolated in the top-right quadrant. Placed between these two groups as separate clusters areH. montis-tauri,
H. formosumandH. comperianum. Both coordinates are dominated by markings found
on the sepals and/or perianths (Table 2). All individuals located below the solid line
Table 1 Character mean values for the 25 study populations.NM, not measured.
Population Taxon No. of plants measured Stem height Stem diameter Stem pigment. Inflor. length Flower number Basal bract length Floral bract length Ovary length
n 1 2 3 4 5 6 7 8
UK N: Newmarket hircinum 10 367 3.95 0.5 120 27.2 26.0 21.0 12.7
UK S: Sandwich hircinum 10 317 5.18 1.0 150 50.9 NM 30.3 13.0
Ma: Ifrane hircinum 3 380 7.97 0 143 68.5 45.0 27.3 12.7
Hu E: Nyirád adriaticum 10 590 4.62 1.1 292 39.0 34.0 16.2 14.6
Hu W: Kőszeg adriaticum 10 444 3.59 0.9 163 23.9 26.8 15.8 13.0
BiH: Sutjeska calcaratum 12 622 4.11 0.1 217 25.3 36.7 25.8 16.8
Srb: Bačevci calcaratum 1 610 5.22 1.0 243 31.0 29.0 16.3 17.3
Tr: Dereceören jankae‘robust’ 10 543 6.15 1.4 275 51.4 53.1 39.8 15.5
MNe: Bukovik jankae s.s. 10 436 4.60 1.4 214 31.3 31.2 20.6 13.6
Hu: Jósvafő jankae s.s. 10 575 4.06 0.7 235 33.2 29.1 16.3 13.3
Tr S: Termessos montis-tauri 2 550 4.93 0 259 24.0 NM 35.4 15.0
Tr N: Cevizli montis-tauri 4 320 3.98 0 173 12.0 NM 34.1 12.8
Gr: Taigeti samariense 1 225 6.00 0 NM 26.0 47.5 38.6 15.3
Cr E: Kato Simi samariense 1 275 4.37 1.0 97 15.0 48.9 38.3 14.3
Cr W: Samaria samariense 1 307 4.53 1.0 162 15.0 39.5 42.3 18.2
Tr S: Mehmetali caprinum 10 530 5.30 0.6 267 35.2 NM 26.6 14.3
Tr N: Kü¸cük¸cukur caprinum 10 385 3.58 0.8 197 15.7 38.0 24.0 15.0
Az: Xu¸cbala formosum 10 551 5.06 1.2 298 26.3 56.5 29.7 16.5
Sp: Torcal robertianum 3 407 9.70 0.3 170 35.0 49.7 31.7 18.3
Fr: Var robertianum 5 312 7.58 1.4 120 23.6 33.8 22.2 15.8
Sar: Pattamona robertianum 10 448 7.37 0.9 198 41.9 NM 16.9 16.0
Ten N: Santiago metlesicsianum 3 500 8.53 0 148 31.3 41.3 27.3 17.0
Ten S: Chirche metlesicsianum 1 450 6.40 0 130 19.0 39.0 24.0 14.0
Les N: Sanctuario comperianum 3 313 3.43 1.0 110 9.3 41.7 26.3 20.3
Les S: Olimbos comperianum 2 385 4.40 0.5 105 13.5 54.0 23.0 16.5
Population Taxon Total leaf number Length longest leaf Width longest leaf Lip width shoulders Lip width abdomen Lip max. length Lip length torso Lip length thorax Lip crenulae no.
9a 11 12 15 16 17 18 19 21
UK N: Newmarket hircinum 8.6 105 NM 6.6 1.67 39.4 38.1 5.1 4.7
UK S: Sandwich hircinum 10.6 96 31.3 7.3 1.71 44.6 43.7 4.8 4.9
Ma: Ifrane hircinum 12.7 88 42.7 7.1 1.83 49.7 47.3 6.8 4.7
Hu E: Nyirád adriaticum 9.5 122 27.7 5.1 1.29 49.5 41.5 6.0 6.8
Hu W: Kőszeg adriaticum 9.7 108 20.7 4.6 1.09 51.0 49.3 6.8 6.8
BiH: Sutjeska calcaratum 10.6 134 30.0 11.0 1.79 74.2 54.9 11.8 7.1
Srb: Bačevci calcaratum 10.0 122 20.0 12.6 1.65 79.1 43.8 12.0 8.0
Tr: Dereceören jankae‘robust’ 11.9 139 38.7 11.8 2.06 64.7 41.6 9.7 5.6
MNe: Bukovik jankae s.s. 9.6 122 39.4 8.8 1.63 58.6 40.1 9.1 7.1
Table 1(continued)
Population Taxon Total leaf number Length longest leaf Width longest leaf Lip width shoulders Lip width abdomen Lip max. length Lip length torso Lip length thorax Lip crenulae no.
9a 11 12 15 16 17 18 19 21
Hu: Jósvafő jankae s.s. 10.6 103 26.0 8.7 1.53 65.9 45.2 9.9 5.2
Tr S: Termessos montis-tauri 6.0 97 25.0 13.4 1.73 59.6 42.2 10.3 8.0
Tr N: Cevizli montis-tauri 5.8 130 30.0 13.2 1.64 44.8 33.8 8.9 7.3
Gr: Taigeti samariense 7.0 160 39.0 8.4 1.30 45.8 35.3 6.0 6.0
Cr E: Kato Simi samariense 6.0 142 38.0 9.9 1.17 40.1 31.2 8.0 8.0
Cr W: Samaria samariense 5.0 100 33.0 8.1 1.12 53.3 34.0 6.2 5.0
Tr S: Mehmetali caprinum 8.9 125 38.7 8.2 1.74 48.5 39.8 8.7 4.8
Tr N: Kü¸cük¸cukur caprinum 8.4 75 20.8 8.8 1.54 58.2 42.6 8.8 4.4
Az: Xu¸cbala formosum 9.1 130 27.8 8.1 2.58 25.5 23.6 11.4 9.8
Sp: Torcal robertianum 6.3 259 76.0 11.0 6.23 19.3 15.2 8.9 2.0
Fr: Var robertianum 6.2 117 58.0 10.2 5.64 16.7 13.6 7.6 2.6
Sar: Pattamona robertianum 6.4 193 65.8 12.3 4.58 14.4 12.0 6.8 1.8
Ten N: Santiago metlesicsianum 8.3 159 50.0 16.6 5.60 21.6 16.6 11.3 4.0
Ten S: Chirche metlesicsianum 7.0 130 37.0 17.0 8.10 20.0 15.5 12.3 4.0
Les N: Sanctuario comperianum 5.3 118 28.5 10.3 5.17 70.3 22.7 17.7 0
Les S: Olimbos comperianum 5.5 75 24.0 8.5 3.75 63.0 21.0 17.5 0
Population Taxon Lip arm length Lip arm width Lip leg length Lip leg width Lip tail present Lip limbs colour (x) Lip limbs colour (y) Lip limbs colour (Y) Lip spots present 22 23 24 25 26a 27 28 29 30a
UK N: Newmarket hircinum 6.59 1.02 1.21 0.72 0.10 0.374 0.364 12.8 1.00
UK S: Sandwich hircinum 12.88 1.04 1.47 0.76 0 0.400 0.364 9.2 1.00
Ma: Ifrane hircinum 9.67 0.97 2.87 0.60 0 0.415 0.348 13.0 1.00
Hu E: Nyirád adriaticum 7.90 0.98 7.46 0.80 0 0.371 0.347 11.6 1.00
Hu W: Kőszeg adriaticum 6.41 0.86 1.82 0.60 0 0.346 0.298 13.1 1.00
BiH: Sutjeska calcaratum 13.60 1.89 19.80 1.11 0 0.287 0.237 12.2 0.58
Srb: Bačevci calcaratum 19.79 2.05 33.90 1.04 0 0.320 0.201 8.6 1.00
Tr: Dereceören jankae‘robust’ 9.22 2.21 22.90 1.10 0 0.310 0.225 6.3 0.80
MNe: Bukovik jankae s.s. 5.42 2.08 17.80 1.27 0 0.323 0.239 6.7 1.00
Hu: Jósvafő jankae s.s. 4.05 1.78 20.40 0.89 0 0.336 0.286 19.2 1.00
Tr S: Termessos montis-tauri 7.82 2.39 16.50 1.45 0 0.372 0.335 45.1 1.00
Tr N: Cevizli montis-tauri 8.16 2.45 10.90 1.55 0 0.363 0.366 57.5 1.00
Gr: Taigeti samariense 4.12 0.90 10.90 0.91 0 0.409 0.448 16.9 1.00
Cr E: Kato Simi samariense 9.22 1.21 9.10 1.15 0 0.410 0.298 3.4 1.00
Cr W: Samaria samariense 9.21 0.76 19.70 0.57 0 0.310 0.246 4.9 0
Tr S: Mehmetali caprinum 3.78 1.59 8.78 1.28 0 0.373 0.266 11.7 0
Tr N: Kü¸cük¸cukur caprinum 5.04 1.56 14.60 1.14 0 0.354 0.314 12.8 0
Az: Xu¸cbala formosum 1.56 1.43 1.85 1.34 0 0.284 0.189 8.7 0
Sp: Torcal robertianum 6.10 2.97 5.10 3.77 0.67 0.404 0.331 21.3 0.67
Table 1(continued)
Population Taxon Lip arm length Lip arm width Lip leg length Lip leg width Lip tail present Lip limbs colour (x) Lip limbs colour (y) Lip limbs colour (Y) Lip spots present 22 23 24 25 26a 27 28 29 30a
Fr: Var robertianum 5.02 2.66 4.46 3.72 0.20 0.388 0.325 14.4 1.00
Sar: Pattamona robertianum 4.15 1.98 3.15 2.59 0.20 0.351 0.264 9.7 1.00
Ten N: Santiago metlesicsianum 5.27 3.50 4.10 2.00 0.67 0.308 0.262 45.3 1.00
Ten S: Chirche metlesicsianum 3.80 3.80 4.20 3.50 0 0.313 0.274 55.0 1.00
Les N: Sanctuario comperianum 54.70 0.60 47.70 0.30 0 0.289 0.238 32.7 1.00
Les S: Olimbos comperianum 34.00 0.50 42.00 0.40 0 0.298 0.265 46.0 1.00
Population Taxon Lip no. of spots Lip distrib. spots Pos. torso vs stem Pos. arms vs torso Spur length Spur width Spur curvature Lateral petal length Lateral petal width
30 31 32 33 34 35 36 37 38
UK N: Newmarket hircinum 14.7 1.9 2.0 4.0 2.20 1.95 4.4 6.66 1.39
UK S: Sandwich hircinum 9.0 1.3 2.0 3.8 2.62 2.26 4.0 7.69 1.19
Ma: Ifrane hircinum 12.3 1.0 2.0 3.0 3.07 2.37 5.0 8.87 1.63
Hu E: Nyirád adriaticum 10.2 2.9 2.1 3.0 2.72 1.43 4.7 5.97 1.44
Hu W: Kőszeg adriaticum 13.2 3.0 2.0 2.5 2.82 1.79 3.5 6.80 1.07
BiH: Sutjeska calcaratum 6.9 1.9 1.0 3.3 11.15 3.48 4.3 9.06 2.09
Srb: Bačevci calcaratum 17.0 3.0 2.0 4.0 7.49 2.24 4.0 8.33 1.70
Tr: Dereceören jankae‘robust’ 4.3 2.0 1.0 3.2 5.25 2.73 3.9 10.86 2.76
MNe: Bukovik jankae s.s. 14.5 3.0 1.5 3.7 5.76 3.20 4.2 10.60 2.51
Hu: Jósvafő jankae s.s. 13.5 2.6 1.4 3.5 4.41 2.45 4.3 8.14 2.15
Tr S: Termessos montis-tauri 22.0 3.0 1.0 5.0 6.54 4.06 5.0 10.37 2.94
Tr N: Cevizli montis-tauri 20.3 3.0 1.0 5.0 5.60 3.31 4.0 9.48 2.25
Gr: Taigeti samariense 11.0 2.0 3.0 3.0 6.04 2.87 3.0 9.07 1.66
Cr E: Kato Simi samariense 12.0 2.0 2.0 3.0 5.12 2.67 4.0 11.16 2.10
Cr W: Samaria samariense 0 0 3.0 3.0 7.19 2.48 5.0 9.66 1.97
Tr S: Mehmetali caprinum 0 0 1.5 3.4 5.88 3.41 3.3 9.66 2.28
Tr N: Kü¸cük¸cukur caprinum 0 0 1.1 2.9 6.45 2.80 4.4 9.90 2.24
Az: Xu¸cbala formosum 0 0 1.0 1.6 11.80 2.08 5.0 9.43 2.58
Sp: Torcal robertianum 25.0 2.0 1.7 3.3 5.43 3.33 4.0 9.93 3.33
Fr: Var robertianum 12.8 2.0 1.4 2.8 5.34 3.74 4.0 9.18 3.32
Sar: Pattamona robertianum 17.0 3.0 1.6 3.1 4.83 3.28 3.8 6.88 1.94
Ten N: Santiago metlesicsianum 15.3 2.3 1.0 2.0 5.30 3.73 4.0 8.47 2.30
Ten S: Chirche metlesicsianum 20.0 3.0 1.0 2.0 5.60 3.40 4.0 7.80 2.30
Les N: Sanctuario comperianum 42.0 3.0 2.0 3.0 15.70 2.53 5.0 13.30 1.53
Les S: Olimbos comperianum 17.0 2.0 2.0 3.0 14.35 2.75 5.0 13.05 1.35
Population Taxon Lateral sepal length Lateral sepal width Sepal colour (x) Sepal colour (y) Sepal colour (Y) Sepal marginal stripe Sepal internal lines Sepal internal dots Position lateral sepals
40 41 42 43 44 45 46 47 48
UK N: Newmarket hircinum 8.91 4.50 0.377 0.438 83.0 1.0 1.00 0.90 1.0
UK S: Sandwich hircinum 10.27 5.24 0.373 0.454 33.0 1.0 1.00 1.00 1.0
Table 1(continued)
Population Taxon Lateral sepal length Lateral sepal width Sepal colour (x) Sepal colour (y) Sepal colour (Y) Sepal marginal stripe Sepal internal lines Sepal internal dots Position lateral sepals 40 41 42 43 44 45 46 47 48
Ma: Ifrane hircinum 11.93 4.87 0.357 0.421 58.0 1.0 1.00 0 1.0
Hu E: Nyirád adriaticum 8.29 4.60 0.319 0.297 53.8 1.0 1.00 1.00 1.0
Hu W: Kőszeg adriaticum 8.88 4.28 0.336 0.219 11.3 1.0 1.00 1.00 1.0
BiH: Sutjeska calcaratum 13.78 6.68 0.322 0.302 27.1 1.0 0.83 0.67 1.0
Srb: Bačevci calcaratum 12.54 6.01 0.320 0.201 8.6 1.0 1.00 1.00 1.0
Tr: Dereceören jankae‘robust’ 15.22 7.08 0.301 0.240 20.7 1.0 1.00 0.60 1.0
MNe: Bukovik jankae s.s. 14.15 7.35 0.343 0.294 59.0 1.0 1.00 1.00 1.0
Hu: Jósvafő jankae s.s. 12.16 6.19 0.349 0.358 59.6 1.0 1.00 0.80 1.0
Tr S: Termessos montis-tauri 15.98 6.85 0.348 0.350 57.6 0 1.00 1.00 1.0
Tr N: Cevizli montis-tauri 13.39 6.57 0.341 0.356 53.0 0.5 0.75 1.00 1.0
Gr: Taigeti samariense 13.88 5.39 0.416 0.374 23.3 1.0 1.00 0 1.0
Cr E: Kato Simi samariense 14.78 6.06 0.408 0.236 7.6 1.0 1.00 0 1.0
Cr W: Samaria samariense 13.14 5.45 0.324 0.356 58.7 1.0 1.00 0 1.0
Tr S: Mehmetali caprinum 13.15 6.29 0.332 0.322 49.2 1.0 0.10 0 1.0
Tr N: Kü¸cük¸cukur caprinum 13.16 6.25 0.345 0.391 75.7 1.0 0.30 0.10 1.0
Az: Xu¸cbala formosum 12.28 5.28 0.274 0.197 9.6 0.8 0 0 2.3
Sp: Torcal robertianum 12.40 7.47 0.385 0.326 32.0 0 0 0.67 2.3
Fr: Var robertianum 11.34 6.06 0.314 0.248 20.0 0 0 1.00 2.2
Sar: Pattamona robertianum 9.63 5.45 0.306 0.248 35.6 0 0 1.00 2.7
Ten N: Santiago metlesicsianum 12.47 6.10 0.309 0.250 35.7 0 0 1.00 2.3
Ten S: Chirche metlesicsianum 11.50 6.00 0.308 0.233 26.0 0 0 1.00 3.0
Les N: Sanctuario comperianum 19.20 7.47 0.459 0.317 8.0 0 0 0 1.0
Les S: Olimbos comperianum 19.00 6.90 0.457 0.317 8.0 0 0 0 1.0
Population Taxon Column length Column width Lateral petal teeth pres. Lip length abdomen
49 50 39 18a
UK N: Newmarket hircinum 4.02 2.42 0.20 33.0
UK S: Sandwich hircinum 3.80 2.62 <1 38.9
Ma: Ifrane hircinum 4.23 3.33 <1 40.5
Hu E: Nyirád adriaticum 3.12 1.50 0 35.5
Hu W: Kőszeg adriaticum 3.85 2.16 ? 42.5
BiH: Sutjeska calcaratum 6.26 3.44 0.08 43.1
Srb: Bačevci calcaratum 5.99 2.96 0.10 31.8
Tr: Dereceören jankae‘robust’ 5.82 2.88 0 31.9
MNe: Bukovik jankae s.s. 6.12 2.41 0.10 31.0
Hu: Jósvafő jankae s.s. 4.60 2.02 ? 35.3
Tr S: Termessos montis-tauri 8.45 3.12 0 31.9
Tr N: Cevizli montis-tauri 7.09 2.92 0 34.9
Gr: Taigeti samariense 5.67 3.18 0 29.3
Cr E: Kato Simi samariense 6.23 3.18 0 23.2
Cr W: Samaria samariense 6.16 2.89 0 27.8
Tr S: Mehmetali caprinum 6.97 3.46 0 31.1
Table 1(continued)
Population Taxon Column length Column width Lateral petal teeth pres. Lip length abdomen
49 50 39 18a
Az: Xu¸cbala formosum 7.08 3.33 0.73 12.2
Sp: Torcal robertianum 7.05 3.40 ? 6.3
Fr: Var robertianum 6.80 4.20 ? 6.0
Sar: Pattamona robertianum 6.60 4.19 ? 5.2
Ten N: Santiago metlesicsianum NM 3.67 ? 5.3
Ten S: Chirche metlesicsianum NM 3.80 ? 3.2
Les N: Sanctuario comperianum 6.15 3.55 1.00 5.0
Les S: Olimbos comperianum 4.95 3.60 1.00 3.5
H. comperianum lack discrete labellum markings. Larger gynostemia and broader
‘abdomens’ also help to separate thehircinum–caprinumclade (left) from the remainder on the first coordinate. The considerably less informative third and fourth coordinates are not depicted here. The third coordinate partially separatesH. hircinum,H. adriaticum
andH. caprinumfrom the remaining taxa on the basis of the larger sepals and labella of the latter, whereas the fourth coordinate uses primarily the diffuse background colours of the sepals and labella to wholly separate the purple-floweredH. formosumfrom the paler, greenish-floweredH. caprinumandH. montis-tauri.
The main consequence of omitting the 12 pigmentation characters from the full matrix was to collapseH. montis-tauriandH. comperianuminto the main group of plants (Fig. 7B), demonstrating that their apparent morphological distinctiveness relies heavily on anthocyanin-based characters. Their downward displacement on the second coordinate
leaves onlyH. formosumas morphologically intermediate between the main group and
subgenusBarlia. Predictably, the dimensionality of the variation is reduced, such that the first two coordinates account for an increased 47% of the total variance. In compensation,
H. adriaticumbecomes separated (just) fromH. hircinumon the first coordinate, and a
narrow discontinuity opens between them andH. jankae—morphologically the closest
member to sectionhircinumof the remainder of the hircinum–caprinum group. This
separation of H. hircinumand especiallyH. adriaticumfrom the remaining taxa reflects several characters, including their comparatively small columns, narrow shoulders and torsos, and narrow limbs (Table 3). The much weaker third coordinate (not shown) widely separatesH. comperianumand, to a lesser degree,H. formosumfrom the remainder on the basis of their long, curved spurs and, in the case ofH. comperianum, their few-flowered inflorescences. The fourth coordinate separatesH. formosumfromH. comperianum, due primarily to its longer stem and correspondingly longer inflorescence (Table 3).
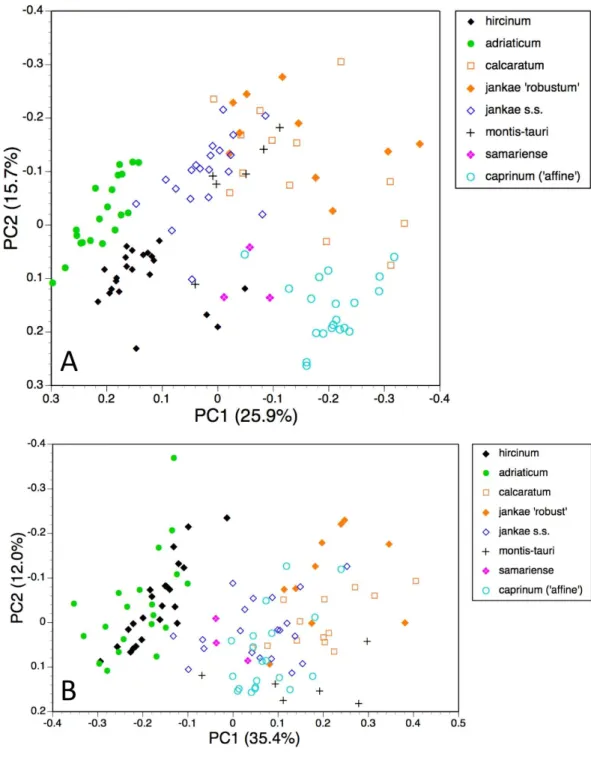
Individual plants, taxa restricted to hircinum–caprinum clade
Himantoglossum comperianum,H. robertianum,H. metlesicsianumandH. formosumwere then removed from the analysis in order to better explore the more subtle variation evident within thehircinum–caprinumclade (Fig. 8).
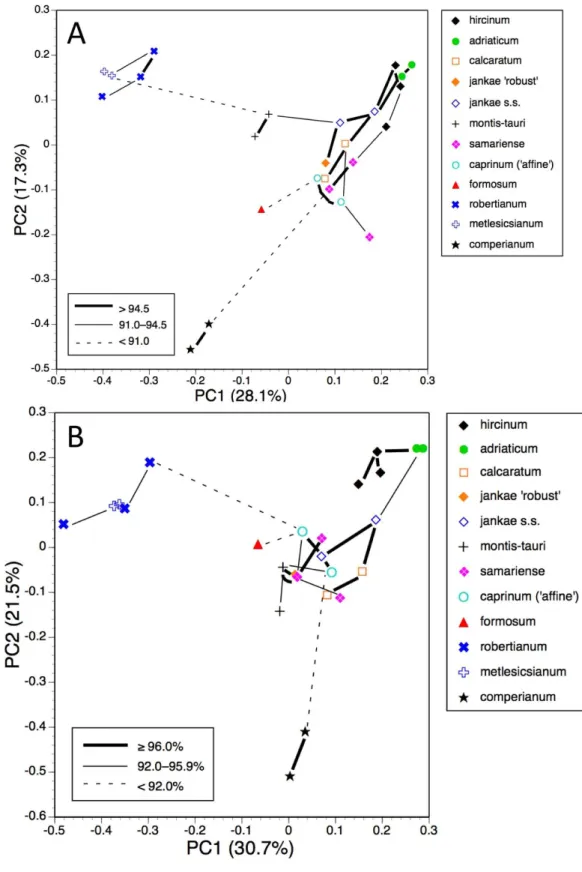
Figure 10 Principal coordinates plots and minimum spanning trees for populations of thehircinum– caprinumclade only.(A) All characters. (B) Pigmentation characters omitted.
range of dimensions of floral organs now dominates the first coordinate (Table 4), the relative positions of the taxa on the first coordinate resemble those evident in the all-taxon analysis (Fig. 7A):hircinumplusadriaticumoccupy one end of the coordinate andcaprinumplusjankae‘robust’ occupy the other. The second coordinate summarises a wide, heterogeneous range of characters, including several that represent anthocyanin markings. It largely separateshircinum,caprinumand×samariense from the remainder,
Table 2 Characters contributing to the first four principal coordinates for individual plants, all taxa and all characters included (seeFig. 7A).
Coordinate PC1 PC2 PC3 PC4
Percentage of variance accounted for
25.6 17.5 9.6 8.2
Taxonomic significance ‘Barlia’+‘Comperia’+
formosum: REST
‘Barlia’ : REST hircinum+adriaticum+
caprinum:jankae+ cal-caratum
formosum:caprinum+
montis-tauri
Sepal interior dashes* Sepal interior spots* Sepal width* Sepal colour x*
Lip torso width Lip markings distribution* Sepal length Lip colour Y* Column width Sepal peripheral stripe Lip leg length Sepal colour y
Column length Lip markings number Lip shoulder width Stem pigmentation Sepal position Lip overall length Lip overall length Inflorescence length
Sepal peripheral stripe Petal length Lip length to armpit Lip colour y Contributory characters,
listed in order of decreasing contribution
Lip torso length Sepal length Lip arm width Lip arm length
Table 3 Characters contributing to the first four principal coordinates for individual plants, all taxa included but pigmentation characters omitted (seeFig. 7B).
Coordinate PC1 PC2 PC3 PC4
Percentage of variance accounted for
27.1 20.0 9.5 8.4
Taxonomic significance ‘Barlia’+‘Comperia’
+formosum: REST :
hircinum+adriaticum
‘Barlia’ : REST : ‘Comperia’ ‘Comperia’ : REST formosum: REST
Column length Lip overall length* Spur curvature* Inflorescence length*
Lip ‘shoulder’ width Sepal length Flower number* Stem height*
Lip torso width Lip leg length Leaf number Spur curvature
Column width Petal length Spur length Lip crenulae number
Lip leg width Lip length to ‘armpit’ Leaf number
Petal width Sepal position Flower number
Lip arm width Sepal width Bract, length basal
Spur median width Lip torso length
Contributory characters, listed in order of decreasing contribution
Sepal position Spur length
third coordinate separates the anthocyanin-deficient, vegetatively comparatively weak
H. montis-taurifrom the remainder.
Table 4 Characters contributing to the first four principal coordinates for individual plants of thehircinum–caprinumclade only, all charac-ters included (seeFig. 8A).
Coordinate PC1 PC2 PC3 PC4
Percentage of variance accounted for
25.9 15.7 8.7 6.8
Taxonomic significance hircinum+adriaticum: REST :caprinum+jankae
‘rob.’
hircinum+caprinum+ ×samariense: REST
montis-tauri: REST hircinum(pp) : REST
Column length* Lip overall length Lip colour Y* Flower number
Sepal length* Crenulae number Flower number Stem diameter
Petal length Lip markings distribution Sepal colour Y Leaf width Spur width Sepal interior spots Sepal peripheral stripe Sepal colour y Spur length Sepal interior dashes Stem pigmentation
Sepal width Arm width Leaf number
Sepal interior spots Lip length to armpit Sepal colour y
Column width Stem height Lip markings number
Petal width Lip colour x
Lip markings distribution Sepal width Lip shoulder width Sepal colour x
Lip length to armpit Lip shoulder width
Sepal colour y
Contributory characters, listed in order of decreasing contribution
Lip colour y
Table 5 Characters contributing to the first four principal coordinates for individual plants of thehircinum–caprinumclade only, pigmenta-tion characters omitted (seeFig. 8B).
Coordinate PC1 PC2 PC3 PC4
Percentage of variance accounted for
35.4 12.0 9.2 7.7
Taxonomic significance hircinum+adriaticum: REST montis-tauri: REST adriaticum+calcaratum+
jankaes.s. : REST
NONE
Sepal length* Number of flowers* Lip overall length Spur curvature
Sepal width* Stem diameter* Leaf width Lip shoulder width Number of leaves Stem height
Petal length Inflorescence length Floral bract length
Column length Stem height Spur curvature
Lip length to armpit Leaf width
Lip arm width Lip torso length
Petal width Leaf length
Lip torso width Basal bract length
Spur length Lip overall length
Lip angle torso vs stem
Lip leg length Column width Lip leg width
Contributory characters, listed in order of decreasing contribution
The most striking feature of both ordinations is that the positions of plants across the plot broadly reflect their relative longitudes, western European plants being confined to the left-hand region of the plot and plants of Asia Minor being confined to the right (Figs. 8Aand8B).
Population means, all taxa present
Ordinations of population means also have superimposed upon them the corresponding minimum spanning trees, which are useful for indicating the relative strengths of the links connecting populations. Theory predicts that populations of the same species should most closely resemble each other rather than populations of other species. Ideally, to optimise this similarity test, more populations of each species would have been measured by us (indeed,H. formosumis represented in our matrix by only one population and so is effectively untestable in this way). Also, within several populations, sample sizes are undesirably small, epitomised by the three populations ofH.×samariense—the single
measurable plant found in each population risks incurring serious sampling error when we are obliged to view that plant as representing the entire source population.
The plot using all characters for all populations (Fig. 9A) encompasses a similar amount of variation as the plots for individual plants (45%). It greatly separates from the main cluster both H. comperianum(on both coordinates) and subgenusBarlia (on the first coordinate only); they are linked to the main cluster of populations only weakly, as is
H. formosum, which is distanced from all other populations on the plot of the third and fourth coordinates (not shown).Himantoglossum montis-tauriis also somewhat distanced from the main cluster. Most conspecific populations link to each other strongly, the exception being the single plant representing the population ofH.×samariense from its
type locality in the Samaria Gorge of western Crete; this instead links weakly toH. caprinum. Omitting pigmentation characters from the analysis (Fig. 9B) increased the variance accounted for to 52% but yielded broadly similar positioning of most populations. The most sigificant changes were thatH. montis-tauriwas pulled deeper into the main cluster
of populations, whereas H. hircinumandH. adriaticumbecame attached to each other
rather than toH. jankae, and were further distanced from sectioncaprinum. In addition, the Bukovki population ofH. jankaebecame interpolated between the two populations of
H. caprinum.
Population means, taxa restricted to hircinum–caprinum clade
Restricting the population-level analysis to the H. hircinum–caprinumclade (Fig. 10A) considerably reduced the degree of disparity among maximum similarities—in other words, the taxonomic relationships appear more egalitarian. Conspecific populations are reliably connected with strong links,H. jankae seemingly occupying a central position within the clade. But as in the all-taxon analysis, the Samaria population ofH.×samariense
is linked toH. caprinum. And in this case, the two remainingH.×samariense‘populations’
(strictly, plants) are linked, albeit weakly, to the Sandwich population ofH. hircinum. The third coordinate (not shown) primarily separatedH. montis-taurifrom the remainder.
as in the all-taxa analysis, the two populations ofH. caprinumbecame separated. More surprisingly, the single population ofH. jankae ‘robust’ became strongly attached to the Mehmetali population ofH. caprinum. The third and fourth coordinates offered no taxonomic separation.
Univariate analyses
Understanding of the patterns of morphological similarity depicted in the principal coordinates plots can be further refined through consideration of individual variables, particularly those identified in the multivariate plots as potentially taxonomically sigificant. In total, 25 of the more informative characters are summarised inFigs. 11–17.
Pigmentation
The summary of frequencies of characters representing discrete floral markings (Fig. 11A; see alsoFig. 7A) makes clear how the presence or absence of each of the four categories of floral marking (discrete spots on the labellum, discrete spots on the interior of the sepals, discrete dashes on the interior of the sepals, peripheral stripes on the exterior of the sepals) interact to diagnose four groups of species. The only species to possess labellum markings but no sepal markings isH. comperianum(labellum markings were especially numerous in the Sanctuario population ofcomperianum), whereasH. robertianumandH. metlesicsianum
also possess sepal spots. The only marking type possessed by most individuals of H. formosum andH. caprinumis the peripheral stripe on the sepals. Most plants of the remaining species possess all four kinds of marking, except that the majority ofH. montis-taurilack peripheral stripes. However, the presence of each kind of marking in each taxon cannot be wholly relied upon; onlyH. adriaticum, together withH. metlesicsianumandH. comperianum, appeared to be fixed for presence or absence of all four categories of marking (Fig. 11A). And given our small sample sizes for these species (only four and five plants, respectively), it is likely that we may simply failed to detect such variants.
Flower colour proved to be challenging to summarise when consideringHimantoglossum
species, as the perianth segments typically had a base colour of yellow-green that then appeared to be ‘overwashed’ with brown, purple or red pigments (Figs. 1–3).Figure 12 shows mean values for two of the three quantified CIE parameters (x and y) that together represent the background colour of the marginal regions of the labellum;Fig. 13presents comparable data for the exterior surfaces of the sepals.
Most study populations of the same taxon averaged similar labellum colours (Fig. 12), though the three plants ofH.×samarienseare spread especially widely on the colour grid
and the Spanish (Torcal) population ofH. robertianumexhibited unusually purplish hues
that approached those more typical ofH. metlesicsianum.Himantoglossum formosumand
H. comperianumtended to have labellar margins that are purplish rather than greenish-brown, whereasH. hircinum,H. adriaticum,H. montis-tauriand especially the mainland Greek (Taygeti)H.×samarienseleaned toward brownish-yellow.
Figure 11 Histograms showing frequencies of (A) flower markings and (B) lateral sepal position.
Character states for (B): 1, incorporated into hood; 2, partially spreading; 3, widely spreading.
labella are purple. The converse is true of two of the three populations ofH. robertianum, which have purplish sepals associated with browner labella. In addition, sepal colour usefully distinguishes the yellow-green-sepalled H. hircinumfrom the mauve-sepalled Köszeg population ofH. adriaticum(Fig. 13).
In addition to the precise hue, we can also usefully consider the depth of coloration of the labellum margin (Fig. 14A). Clearly, the majority of taxa are reliably dark flowered (defined here as a reflectivity of incident light of less than 20%). However,H. caprinum,
Figure 12 Colour plot for interior labellum margin of the study populations.Population mean values are superimposed onto the CIE colour chart.
together with all of theH. montis-tauriandH. metlesicsianumplants measured here and approximately one tenth of theH. robertianum, have comparatively pale flowers that are characterised by reflectivities that exceed 40%.
Sepal, petal and gynostemium
Figure 13 Colour plot for exterior of sepals of the study populations.Population mean values are su-perimposed onto the CIE colour chart.
H. hircinumare shorter than those of the remaining taxa, though there exists partial overlap in size with the gynostemia ofH. jankae s.s.
Dimensions of sepals and lateral petals readily distinguish the long-hooded
Figure 14 Bivariate scattergrams of (A) gynostemium length versus width and (B) lateral sepal length versus width.Gynostemium length was not measured forH. metlesicsianum.
that are both the shortest and narrowest. Also, the sepals ofH.×samarienseare unusually
narrow relative to their length.
Lateral sepal orientation, as perceived relative to the vertical when the flower is viewed from the front, readily distinguishes subgenusBarliaplusH. formosum(Fig. 11B). They show a mixture of partially and wholly spreading sepals, whereas the remaining taxa reliably incorporate the lateral sepals into the hood (galea) that is consistently formed by the median sepal and lateral petals. The hood in turn completely overhangs the gynostemium.
Long, filiform lateral teeth proved to be ubiquitous on the lateral petals of
H. comperianum. Shorter, sturdier teeth projected from the petals of the majority of plants ofH. formosum, as well as from a small minority of plants of each ofH. jankae s.s.,
Figure 18 Mean morphologies of the labella of the study taxa, reconstructed from the morphometric dimensions measured.Also shows the anthropomorphic terminology adopted to describe contrasting re-gions of the labellum.
Labellum, including spur
Several characters were needed to represent with acceptable accuracy the unusually complex labellum shape ofHimantoglossum s.l.species (Figs. 15A,16–18).
The plot of maximum length versus width of the labellum (Fig. 16A) alone is
sufficient to distinguish several of the study species. Comparatively short, broad labella characterise subgenusBarlia, which has an especially high width : length ratio and incurs a greater coefficient of variation for width than for length (mean width is greater for
H. metlesicsianum than for H. robertianum). In contrast, the remaining taxa have labella that are much longer than wide and greater coefficients of variation for
length than for width. Furthermore, section caprinumcan achieve greater mean and
maximum lengths than can section hircinum. The width : length ratio is greatest for
H. montis-tauri and least for H. adriaticum. Individuals ofH. formosum form a fairly compact, intermediate cluster.
A broadly similar pattern is evident in labellum torso dimensions (Fig. 16B); species of subgenusBarliaand subgenusHimantoglossumdiffer radically in length : width ratios,
H. formosum occupying a position intermediate between them. The main exception is
similar length ofH. formosumand similar width toH. robertianum(Figs. 16Band18). Shoulders are reliably narrow in sectionhircinum.
The length of the ‘thorax’—the proximal portion of the labellum that stretches from the spur entrance (‘neck’) to the ‘armpit’ (Fig. 6)—is greatly expanded inH. comperianum
relative to the other species (Figs. 15Aand18), which may be the reason that it lacks the three-dimensional ‘crenulae’ that characterise the shoulders of all other species in the genus. Although present, these marginal irregularities are larger—and therefore fewer in number—in subgenusrobertianum. The ‘thorax’ is also comparatively long inH. formosum
andH. metlesicsianum(which exceedsH. robertianumin this character), whereas it is short inH. adriaticumand especially inH. hircinum. The spread of values for this character is especially wide withinH. montis-tauri.
The main plot of labellum arm versus leg length (Fig. 17A) shows that arms are shortest in H. formosum and, to a lesser degree, in the robertianumgroup. The smaller inset diagram shows clearly that the legs of H. comperianumare on average longer, and the
arms much longer, than those of any other Himantoglossumspecies. Variation in arm
length is great within most species, incurring remarkably large coefficients of variation.
Himantoglossum hircinumandH. calcaratumare capable of generating longer arms than the remaining species. Even more striking variation surrounds leg length in most taxa of thehircinum–caprinumclade, though not inH. hircinumitself (Figs. 17Aand18). Indeed, 11% of theH. hircinumplants studied lacked legs altogether, the central labellar lobe being entire rather than apically notched into the characteristic leg-like ‘lobules’. Legs exceeding 5 mm in length form a great majority of most other taxa in the aggregate, notably in the largest-flowered taxa—H. calcaratumandH. jankae‘robust’ (Fig. 18). The two populations ofH. adriaticumdiffer significantly in this character; those from Köszeg have legs that are considerably shorter than those from Nyirád (mean values 1.8 versus 7.5 mm), thus being more comparable in size with those ofH. hircinum. Arms are considerably longer than legs in most individuals of sectionhircinum(Fig. 18).
Limb widths (Figs. 17B and 18) readily separate the filiform elongations of H. comperianumlabella from the wide-armed and especially wide-legged subgenusBarlia. In between these two extremes, sectionhircinumplusH.×samariensetend to have narrower
limbs than do either sectioncaprinumor H. formosum.Only 32% of subgenusBarlia, together with a single plant of H. hircinum, possessed small fifth lobes (‘tails’) located between the legs in the ‘crotch’ of the labellum.
Spur dimensions (Fig. 15B) are also highly diagnostic. In particular,H. formosum
andH. calcaratumhave long spurs (those ofH. calcaratumbeing broader than those of
H. formosum, comparable in width with spurs ofH. montis-tauriand subgenusBarlia) and
H. comperianumhas even longer spurs; those of bothH. comperianumandH. formosum
typically exceed 75% of the length of the corresponding ovary. Spurs of sectionhircinum
are shortest, and within that section, those ofH. adriaticumtend to be even narrower than those ofH. hircinum. Greater length appears to permit greater downward curvature of the spur, most notably inH. comperianum(Table 2).
contrast, those ofH. metlesicsianumare held even closer to the vertical than are those of
H. robertianum. Also, relative to the attitude of the torso, the minute arms ofH. formosum
project forward, the more substantial arms ofH. metlesicsianumare borne in approximately the same plane as the torso, but those of all other species (includingH. robertianum) usually recurve—most strongly so inH. montis-tauri(Table 2).
Vegetative organs
Unusually for a morphometric study of European orchids, vegetative vigour here plays a comparatively minor role in providing highly variable, and thus potentially taxonomically diagnostic, characters. Moreover, only occasionally do highs and lows in the number and sizes of various vegetative organs strongly co-vary. Hence, vegetative characters are not explored in detail in the present text.
In summary, subgenusBarliahave the most robust stems, though they are matched
in this character by the Ifrane population of H. hircinum. Himantoglossum caprinum,
H.×samariense,H. montis-tauriand especiallyH. comperianumtend to have fewer flowers,
whereas inflorescences are densest in subgenusBarliaand inH. hircinum.
Total leaf numbers are comparatively low in subgeneraComperiaandBarlia, and also inH. montis-tauriandH.×samariense. Both subgenusBarliaand the relevant members of
subgenusHimantoglossumappear to compensate in other ways for this potential deficiency in photosynthetic surface area; subgenus Barliaproduces comparatively large leaves, whereas bothH. montis-tauriandH.×samarienseproduce comparatively large bracts.
DISCUSSION
Contrast between morphometric analyses of individual plants versus population means
Focusing on population means inevitably reduces the (often considerable) impact of ontogenetic variation among individuals, particularly in vegetative characters such as plant height, flower number, and leaf number and dimensions (e.g.,Bateman & Denholm, 1989;
Bateman, 2001). Consequently, multivariate plots based on mean values reliably represent a larger percentage of the total variation than do equivalent plots for individuals, as the dimensionality of the data has inevitably been reduced. In contrast, most ecophenotypic influences would affect entire populations, and thus be fully reflected in the resulting population mean values. However, under some circumstances, means can over-simplify individual-level variation, most notably in situations where one or more of the variables is multi-modal (e.g., a population consisting of half white-flowered individuals and half red-flowered individuals would score on CIE colour coordinates as averaging darkish pink—a condition actually found in none of the plants present in the population). Lastly, it is highly desirable that sets of population mean values should each reflect at least several individuals, in order to avoid the negative effects of exaggerated sampling errors.
Figure 19 Morphology-based dendrograms simplified to the five major groups within Himantoglos-sum s.l., based on (A) all characters and (B) pigmentation characters omitted.Internal nodes bear lin-eage divergence dates estimated via a molecular clock approach bySramkó et al.(2014, their Fig. 8).
data; in particular, there is limited correlation (either positive or negative) among suites of characters reflecting plant size, flower size, labellum shape and flower colour. The net result is thatH. comperianumappears more distinct from the other species in analyses of populations versus those of individuals. Much of the taxonomic overlap evident in the principal coordinates plots of individual plants betweenH. hircinumandH. adriaticum, and among members of the H. jankae–caprinumgroup, is likely to reflect ontogenetic and/or ecophenotypic differences. And the unfortunate fact that the three populations of
H.×samarienseare each represented only by a single individual undoubtedly at least partly
explains their failure to group in the population-level plot for all characters (Fig. 10A).
Congruence between morphological and molecular data
Although most studies that compare phylogenetic trees effectively synonymise ‘congruence’ only with tree topologies, we are equally interested in exploring relative branch lengths (i.e., degrees of divergence) when comparing the results of our morphological (Figs. 7–19) and molecular (Fig. 20) studies of theHimantoglossumclade.
Figure 20 Molecular phylogenies ofHimantoglossum s.l.(A) Low-copy nuclear geneLEAFY. (B) Three fast-mutating plastid regions. (C) nrITS. Abbreviated countries: Az, Azerbaijan; Bg, Bulgaria; BiH, Bosnia-Herzegovina; Ca, Canary Islands; Cr, Crete; Ua, Crimea; Cy, Cyprus; Fr, France; Geo, Georgia; Ge, Germany; Gr, Greece; Hu, Hungary; Is, Israel; CG, Montenegro; Mo, Morocco; Pt, Portugal; Ro, Romania; Sl, Slovenia; Sp, Spain; Sr, Serbia; Tr, Turkey; UK, United Kingdom.
the monotypic genusComperia),H. robertianumplusH. metlesicsianum(formerly viewed by most observers as a monotypic or near-monotypic genus,Barlia),H. formosum, and
the remaining named taxa that together form the more problematichircinum–caprinum
clade. The molecular trees derived respectively from the low-copy nuclear geneLEAFY, three concatenated plastid regions, and the high-copy nuclear ribosomal region ITS all yielded broadly similar topologies and branch lengths between these four groups—the three branches separating the divergences of these groups generally being of approximately equal lengths within each of the three trees summarised inFig. 21.
The main topological uncertainty was caused by H. formosum, which (surprisingly)
Figure 21 Artificial hybrid ofH. jankae×H. robertianum. Images courtesy of Svante Malmgren.
credibly) appeared above these groups in the other two molecular trees. Moreover,
ofLEAFYthat was sequenced for the remaining species. Indeed, one of us (RMB) has gained the impression that low-copy nuclear genes such asLEAFYoften yield topologies that (most commonly at comparatively deep nodes) diverge (both profoundly and improbably) from, and hence are less reliable than, both plastid and ribosomal nuclear data derived from those same sampled individuals (contraSchlüter et al., 2007).
That opinion is supported by the present morphometric analyses, which reliably show
H. formosumto be more similar in overall morphology to thehircinum–caprinumclade than to subgenusComperiaor subgenusBarlia, irrespective of whether the analysis is performed at the demographic level of individual plants (Fig. 7) or population means (Fig. 8). The level of morphological disparity shown byH. formosumbest fits the ITS tree when all morphological characters are included (Fig. 19A), this species being most similar to, but nonetheless distinct from, thehircinum–caprinumclade. However, when pigmentation characters are omitted, the revised morphological tree most closely resembles the plastid tree, the branch subtending thehircinum–caprinumclade being proportionately longer (Fig. 19B) and thus suggesting an earlier divergence ofH. formosum. In both of
these morphological analyses,H. formosumdiverges mid-way between subgenus Comperia
and subgenusBarlia, thus mirroring the topology of the plastid tree (Fig. 20B).
When considered at the level of individual characters,H. formosumcombines features typical of subgenusBarlia, such as spreading sepals (Fig. 9B), with features more typical of thehircinum–caprinum group, such as possession by the sepals of a marginal stripe
(Fig. 11A).Himantoglossum formosumis intermediate between the two groups in relative
(though not absolute) labellum dimensions (Figs. 16and18), but also possesses some more unusual features such as comparatively long, narrow spurs (Fig. 15B), exceptionally short labellar limbs (Figs. 17Aand18), and floral anthocyanins that collectively extend toward the bluer end of the purple spectrum (Figs. 1,12and13).
The remaining topological incongruences among the molecular trees (Fig. 20) occur within the less well-resolvedhircinum–caprinum clade. Most notably, sectionhircinum
is undifferentiable from sectioncaprinumin the ITS tree, and the two groups are both clearly differentiable and monophyletic in the plastid tree, butH. adriaticumis not placed as sister toH. hircinumin theLEAFY tree, instead being placed within sectioncaprinum. The morphometric data provide better discrimination than does the ITS tree and broadly support the topology of the plastid tree. However, when considered at the population level, the multivariate data representing overall similarity are capable of reliably distinguishing
between sectionhircinumand sectioncaprinumonly when pigmentation characters are
omitted (cf.Figs. 9A,10Aand19AversusFigs. 9B,10Band19B). In contrast, multivariate analyses based on individual plants (Figs. 7and8B) are more successful at distinguishing the comparatively conservative sectionhircinumfrom the considerably more morphologically variable sectioncaprinum.