Corresponding Author: Ibrahiem M.M. El Emary, Amman Al Ahliyya University, Amman, Jordan
Abstract: The main objective of this study was to build an expert system for assisting the network administrator in his work of management and administration of the computer communication network. Theory of operation of the proposed expert system depends on using a time series model capable of forecasting the various performance parameters as: delay, utilization and collision frequency. When the expert system finds a difference (with certain tolerance) between the predicted value and the measured value, it informs the network administrator that there exist problems in his network either in the switch or link or router. We examine two types of network by our proposed expert system, the first one is called token bus while the second one is called token ring. When we run our expert system on these two types of computer networks, actually the expert system captures the problem when there exists an excess deviation from the network performance parameters.
Key words: Knowledge base, inference engine, exponential weighted moving average, user interface, forward chaining
INTRODUCTION
The issues involved in proactive detection of network problems are: the identification of which types of anomalies can be detected proactively as performance and the efficiency of the detection scheme[1]. Anomalies that show changes in the statistical behavior of some of the management information base (MIB) variables can be detected proactively. Examples of such predictable anomalies are performance degradations, malfunctioning of network devices, cable degradation, and broadcast storms[2,3]. Because the overhead associated with a network management system has to be minimal, the challenges are to design a simple yet efficient agent for proactive anomaly detections in order to reduce the number of false alarms. Time series have been implemented to perform forecasting in many fields. This study deals with using the time series in computer network management in view point of performance monitoring. Time series forecasting or time series prediction takes an existing series of data xt-n,…, xt-2,xt-1,xt and forecasts the xt+xt-2,xt-1,xt+2,… data values. The goal is to observe or model the existing data series to enable future unknown data values to be forecasted accurately. Examples of data series include financial data series (stocks, indices, rates, etc.), physically observed data series (sunspots, weather, etc.).
In this study, we are concerned with building an expert system depends on EWMA time series in order to assist a network administrator in his working.
BASIC CONCEPTS OF MANAGING A COMPUTER NETWORKS
In a network, there are several problems may occur due to different reasons like hardware component failure or bugs that occur in software applications. Subsequently, these problems can affect the network performance and communication between network users. The occurred problem should be detected and solved quickly as possible before users sense it. Network administrator comes to know about the problems which occurred in the network after its effective reach user[4,5].
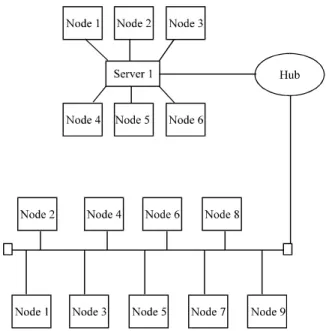
In Fig. 1, if node 1 in the star topology network downed, the load on server 1 will be decreased. Also, if node 5 at bus topology downed, the bus busy time will be decreased, if any node software has problems, then it may send its messages randomly and cause to change the network performance[6]. To assist the network administrator in solving these problems and others, the administrator should know about the problem at the optimal time to be able to solve it before the network users scan it.
EXPONENTIAL WEIGHTED MOVING AVERAGE TIME SERIES MODEL (EWMA)
Fig. 1: Computer network architecture
The trend component reflects the fluctuation in the data that extends throughout the entire time series. The seasonal is the regular variations that occur every period of time. Finally the random component accounts for fluctuations in the data due to undetectable causes.
The basic form of the seasonal time series model is written as:
Xt=b1+b2t+Ct+Єt (1)
Where:
b1 : A constant component b2 : A trend component ct : A seasonal factor
Єt : A random error component
The effect of the seasonal factors ct is to de-seasonalize the current reading X. The length of the seasonal variation is fixed at length L. The parameters b1, b2 and ct, t=1, 2, L must be estimated. These estimates are updated at the end of each period. The model adapts to changes in the data by the use of three smoothing constants α, β and γ. The α, β and γ
Smoothing constants are used to smooth the: constant, trend and seasonal components of the time series model.
The estimates b^1, b^2, and c^t, t=1… L is computed as follows:
b1^ (t)= α [Xt-ct^ (t-L)] + (1- α) [b1^ (t-1) + b2^ (t-1)] (2)
b2^ (t)= β [b1^ (t) - b1^ (t-1)] + (1- β) [b2^ (t-1)] (3)
ct^ (t) = γ [Xt - b1^ (t)] + (1- γ) [ct^ (t-L)] (4)
Where:
0< α, β, γ<1
Fig. 2: A flowchart of EWMA time series approach
A flowchart that illustrates the EWMA approach to predict Xt is shown in Fig. 2.
STRUCTURE OF THE PROPOSED EXPERT SYSTEM
Mainly any expert system consists of four parts as shown in Fig. 3. An expert system approach which is used in managing computer network is shown in Fig. 4. This expert system can reduce or eliminate humane administrator disadvantages.
The purpose of maintaining a model of hosts and process is to be able to, at time t, make a forecast of what the behavior will be at time t+1. If the Forecasted error is out of the accepted error, then some action must be done.
Our proposed expert system architecture is shown in Fig. 5, consisting of knowledge base contains 15 rules, forwarded chaining inference engine, user interface and facts represent the:: system utilization file, system collision frequency file, system delay file, 15 files of nodes collision frequency, and 15 files of node delay which are produced by EWMA time series model.
The 15 rules in our knowledge-base are given by:
SCF_Prob.
5. IF (abs (FSUTi-SUTi) >max (abs (avg (FSUTi)-min (FSUTi)), abs (avg (FSUTi)-max (FSUTi))) THEN SUTi_Prob.
6. IF (abs (FBBT-BBT)> max (abs (avg (FBBT) - min (FBBT)), abs (avg (FBBT) - max (FBBT))) THEN BBT _ Prob.
7. IF (SUTi _ prob and SCF _ Prob) then SD _ Prob. 8. IF (SCF_Prob) then NCF _ Prob.
9. IF (SCF_Prob) then ND_Prob.
10. IF (SCF_Prob) then Alert about system collision frequency problem.
11. IF (NCF_Prob) then Alert about node collision frequency problem.
12. IF (SD_Prob) then Alert about system delay problem.
13. IF (ND_Prob) then Alert about node delay problem.
14. IF (SUti_Prob) then Alert about system utilization problem.
15. IF (BBT_Prob) then Alert about bus busy time problem.
Where:
* Abs: absolute value. * Max: maximum value. * Min: minimum value. * Avg: average value (mean).
* FCFNi: forecasted collision frequency at node i. * CFNi: actual collision frequency at node i. * FNDi: forecasted delay at node i.
* NDi: actual delay at node i.
* FSCF: forecasted system collision frequency. * SCF: actual system collision frequency. * FSD: forecasted system delay.
* SD: actual system delay.
* FSUTi: forecasted system utilization. * SUTi: actual system utilization. * FBBT: forecasted bus busy time. * BBT: actual bus busy time.
When we run our expert system and give the following values at time t:
SCF_Prob = true, SUTi = 0.8415, FSUTi = 0.8301, avg (FSUTi) = 0.8297, min (FSUTi) = 0.8201 and max (FSUTi) = 0.8371
Fig. 3: Expert system components[7]
Fig. 4: The expert system based process[2]
Fig. 5: Structure of the designed expert system
We see that rule 5 action part is: if (abs(0.8301-0.8415)> max (avg(0.8297)-min (0.8201), max(0.8371)-avg(.8297)), Which mean that if (0.0114>0.0096) that is true, this mean that the rule was fired and the action part become true, rules 6, 9, 11, 13 also fired, then the system will alert about system utilization problem, system collision frequency problem and system delay problem.
SIMULATED RESULTS
Fig. 6: Abnormal values of bus busy times detected by our expert system
Fig. 7: Abnormal values of system delay detected by our expert system
An abnormal value of any measurement criteria was detected and alert about it. Figure 6 shows abnormal value of bus busy time at point 18 and it is detected by our expert system.
Since the bus busy time go out of allowed range at times 18 and 29, rule 6 condition part will satisfy if (abs(FBBT-BBT) > max (abs (avg (FBBT)-min (FBBT)), abs(avg(FBBT)-max (FBBT)))), THEN BBT_Prb. As the active part in rule 6 fired, rule 15 also fired and an alert about bus busy time problem printed on the screen of the network administrator.
Figure 7 shows abnormal value of system delay time detected by the expert system. The system delay goes out of allowed range at times 18 and 29; so, rule 3 condition part is satisfied.
If (abs(FSD-SD)> max(abs(avg(FSD)-min (FSD)), abs(avg(FSD)-max (FSD)))) THEN SD_Prob, so rule 3 fired, rule 12 also fired and alert about system delay problem printed on the screen of the network administrator.
Figure 8 shows abnormal value of utilization detected by our expert system, the system utilization goes out of allowed range at times 18 and 29, the rule 5 condition part is satisfied.If (abs (FUTi-UTi) > max (abs (avg (FTUi) - min (FUTi)), abs (avg (FUTi) - max (FUTi))) THEN SUti_Prob, then rule 5 fired, rule 14 also fired and an alert about system utilization problem printed on the screen of the network administrator.
Fig. 8: Abnormal values of utilization detected by our expert system
Fig. 9: Abnormal values of node 0 delay detected by our expert system
Fig. 10: Abnormal values of node 0 collision frequency detected by our expert system
Figure 9 shows abnormal value of node 0 delay detected by our expert system. Node 0 delay goes out of allowed range at times 18 and 29, rule 2 condition part is satisfied.
If (abs(FDNi-NDi)> max(abs(avg(FDNi)-min (FDNi)), abs(avg(FDNi)-max (FDNi))) THEN ND_Prob, so rule 2 fired, rule 13 also fired and an alert about node 0 delay problem printed on the screen of the network administrator.
problem, and system collision frequency problems.
CONCLUSION AND FUTURE WORKS
In this study, we consider a bus network, any failure of network component will affect one of the network measurements (Utilization, system delay, total channel busy time … etc..). If we know about abnormal changing in these measurements, this means that there is some problem in the network. We build an expert system can alert the computer network administrator about network problems based on EWMA time series model.
As a future work, we suggest to work on a comparison between the o/p resulted for EWMA, and neural network, and between EWMA, and fuzzy logic to select the optimal approach that can assist a network administrator in his work of management.
We suggest also updating this system to be an expert system which has the ability not only to detect problems but also specifies and solves problems that occur in the computer communication network.
uses Time Series Model. Supported in part by the Hewlett-Packard Research Grants Program and University of Utah.
3. Suk-Gwon, C., 1992. Fair integration of routing and flow control in communication networks. IEEE Trans. Commun., 40: 821-834.
4. Behrouz A. Forouzan, 2003. Data Communications and Networking. McGraw-Hill Intl. Edn. Sec. Edn. 5. Beyda, W.J. 1996. Data Communications. 2nd Edn.
Upper Saddle River, NJ: Prentice-Hall.
6. William, S., 2004.Data and Computer Communications. Prentice Hall Intl. Edn., 4th Edn. 7. Ulf Lindqvist and A. Philip. Detecting computer
![Fig. 4: The expert system based process [2]](https://thumb-eu.123doks.com/thumbv2/123dok_br/18179454.330921/3.918.470.803.106.806/fig-the-expert-system-based-process.webp)
