Noureddine BELGACEM, Fethi BEREKSI-REGUIG
Biomedical Engineering Laboratory Abou Bekr Belkaid University BP 230 Tlemcen, 13000 Algeria.
Email: {ne_belgacem, f_bereksi}@mail.univ-tlemcen.dz
Amine NAIT-ALI, Régis FOURNIER
Images, Signals and Intelligent Systems Laboratory (LISSI.EA 3956),
UPEC University, France. Email: {naitali, rfournier}@u-pec.fr
Abstract—This paper presents a method to analyze electrocardiogram (ECG) signal, extract the features, for the real time human identification. Data were obtained from short-term Lead-I ECG records (only one lead) of forty students at Paris Est University (UPEC). Signal averaging was applied to generate ECG databases and templates for reducing the noise recorded with palm ECG signals. Time domain signal processing is performed, which comprises the usual steps of filtering, peak detection, heartbeat waveform segmentation, and amplitude normalization. In this paper, an ECG biometric recognition method, that needs detection of one fiducial point only is introduced, based on classification of coefficients from the Fast Fourier Transform (FFT) of the Autocorrelation (AC) sequence of ECG data segments. The FFT is used to reduce extracted features from ECG signals. A 100% subject recognition rate for healthy subjects can be achieved for parameters that are suitable for the database.
Keywords: Biometrics; ECG ; feature extraction; data reduction.
I. INTRODUCTION
Biometric recognition provides airtight security by identifying an individual based on the physiological and/or behavioral characteristics such as face, fingerprint, iris, and behavioral characteristics like gait and keystroke. Theoretically, psychological or behavioral characteristics of human being can be used to make personal identifications possible only if it has the following properties [1], [2]:
Universality, which means that every person, should have the required characteristic which can be used as a biometric.
Uniqueness, which means that any characteristic to be used as a biometric, possessed by two different persons must be distinctive enough.
Permanence means that the characteristics must be invariant with time, position and conditions. Collectability means that the required characteristic must be easily measureable.
Practically following parameters are also required:
Performance means that a system needs to perform quickly and accurately. Acceptability means that the people must accept the system easily.
Circumvention refers to how easy it is to fool the system by fraudulent techniques.
However, these biometrics modalities either cannot provide reliable performance in terms of recognition accuracy (e.g., gait, keystroke) or are not robust enough against falsification.
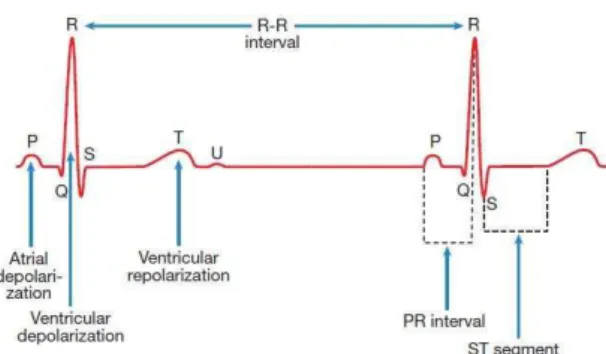
Figure.1. The Standard ECG Waveform.
ECG based biometrics authentication system detects the aliveness of the person, means person’s presence is necessary in alive form [5]. Only single lead ECG signal is required for processing [6]. ECG is easy to record and it requires low cost effective hardware. Therefore, ECG based biometrics system may be easily implemented. A comparative study of different biometric modalities including ECG is presented in Table (I).
Universality Uniqueness Permanence Collectability Performance Acceptability Circumvention
Fingerprint M H H M H M M
Iris H H H M H L L
Retina H H M L H L L
Hand Geometry M M M H M M M
Palm Print M H H M H M M
Hand Vein M M M M M M L
Voice M L L H L M H
Face H L M H L H H
Signature L L L M L H H
DNA H H H L H L L
Keystroke L L L M L M M
ECG H H H M H M L
Table I. Comparison of different biometric modalities.
A. Background and Prior Art
In recent past, different studies have been conducted for the use of ECG in biometrics. Biel et al. [7] have conducted the biometric experiment on ECG recorded from a group of 20 subjects. Twelve features have been selected from each record for identification of a person in a predefined group. Shen et al. [8] have investigated the feasibility of ECG as a new biometric for identity verification. The experiment has been conducted on 20 individuals on seven features, extracted from mainly QRS complex. Using the techniques of neural network and template matching the experiment of human identity verification has been performed. The issues of these studies are mainly: (1) the extraction of ECG features and their accuracy; and (2) the investigation of ECG to change in physiology of the heart. Steven et al. [9] have proposed a set of ECG descriptors to characterize the trace of a heartbeat. Fifteen features have been selected from each heartbeat of 29 individuals. They have been reported the uniqueness of extracted patterns among individuals, unaffected to electrode positions and individual state of anxiety. The drawback of this experiment is the delineation process of ECG characteristic waveforms: P, QRS complex and T wave using an unified approach. Since the fundamental frequency of these waveforms is different therefore the delineation techniques usually depart from one waveform to another.
B. Physiology and ECG
QRS width (ms)
Amplitude P (mV) 0.15-0.16 0.13-0.13 0.12-0.12 0.12-0.14 0.13-0.15
Amplitude R (mV) 0.77-0.68 0.63-0.65 0.62-0.49 0.59-0.54 0.58-0.48
Amplitude S (mV) 0.27-0.35 0.21-0.20 0.22-0.22 0.22-0.16 0.19-0.13
Table II. Normal values of ECG measurements for male and female respectively in upper and lower row [11].
From these observations it can be concluded that aging affects the ECG mainly up to the age of adolescence. Aging does not influence any sexual differences in cardiac electrophysiological properties in the adults.
II. METHODOLOGY
A biometric system is essentially a pattern recognition problem and thus the methodology for this experiment can be broken down into 4 parts: (i) experimental setup, (ii) preprocessing, (iii) feature extraction and (iv) classification. Each part will be explained in detail in the following subsections.
A. Experimental Setup
ECG signals were recorded using an ECG data acquisition unit (Leybold GmbH) that was connected to a computer through an USB National Instrument input/output card (Low Cost Multifunction DAQ 6008) with a sampling frequency of 250Hz, and captured using a LabView software running on a personal computer. A single lead ECG recording was done by following the connections in Figure (2). Participants were required to remain calm and relaxed throughout the recording session. A total of 40 healthy subjects participated in this study. All were male students and staff at Paris Est University (UPEC - Créteil) between the ages of 20 and 40. Four ECG recordings were obtained from each participant with duration of 60 seconds for each recording. The recordings are made on different days and time for every participant. It is then preprocessed using Matlab code. First, individual ECG cycles are separated and waveform cycles are interpolated to get the same size of 185 points.
Figure.2. ECG system acquisition
B. Preprocessing
Figure. 3. Preprocessing of ECG signal.
The preprocessing step consists of two parts: baseline wandering and wideband noise suppression as shown in Figure (3). Baseline wandering usually comes from respiration at frequency wandering between 0.15Hz and 0.3Hz and it can be suppressed by a high pass conventional digital filter or using a non linear Wavelet transform based eliminating the trend of the ECG signal by thresholding the coefficients and constructing the signal without these low component signals. The wavelet approach has been demonstrated to perform better as it does not introduce latency and less distortion [13]. The LabView ASPT (Advanced Signal Processing Toolkit) provides the WA detrend virtual instrument which removes the low frequency of the signal. The trend level is defined as follow:
where t is the sampling duration and N is the number of sampling points. The WA detrend virtual instrument has an option to specify the mother-wavelet type used for the discrete wavelet analysis. The suitable choice for this application was found to be Daubechies (db06) mother-wavelet as it has similarities to the real ECG signal and also Daubechies being orthogonal wavelet is suitable for signal denoising where as biorthogonal wavelet is suitable for signal feature extraction [14]. The VI diagram and the obtained waveforms are shown in Figure (4)
(a) and (b).
Figure. 4. (a) VI diagram to remove baseline wander and noise;
(b) Original ECG, baseline wanders removed signal and denoised signal.
After removing the outliers by thresholding criteria, the heartbeats were aligned with respect to the position of the R peaks, as demonstrated in Figure 5.
detected. The algorithms that perform such a task are built solely for medical applications, where the exact wave boundaries are not needed to diagnose abnormalities. This is not the case for human recognition and authentication systems, where accuracy is crucial in order to facilitate further pattern analysis. Furthermore, there is no universally acknowledged rule about the exact location of wave boundaries, which could constitute the basis of fiducial detectors [19]. Moreover, in ECG monitoring, several kinds of anomalies are met, some of which affect the morphology of the signal significantly, making the boundaries of the waves difficult to localize. To address these problems, nonfiducial points methods can be adopted for feature extraction. The autocorrelation (AC) method has been found to be a suitable candidate for this purpose [20], [21]. In general, the AC captures the repetitive property of the ECG; its shape is primarily dependent on the P, QRS, and T waves. The AC allows a shift invariant representation of similarity features over multiple cycles. The normalized AC is defined as follow:
∑ | | x i x i m
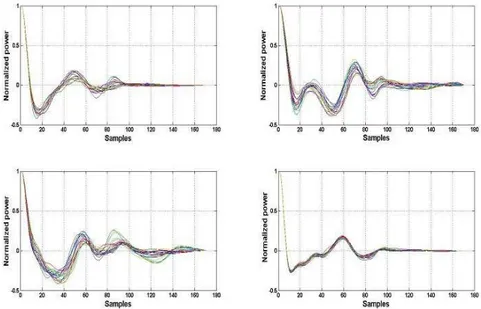
where x[i] is the windowed ECG, for i = 0, 1 ... (N-|m|-1), and x[i+m] is the time-shifted version of the windowed ECG, with a time lag of m = 0, 1, ..., (M-1);M<< N. The autocorrelation (AC) embeds distinctive characteristics for every subject, and thus can be used to capture similarities between signals recorded at different times, can be confirmed by the AC plots in Figure (6).
Figure . 6. Normalized autocorrelation of ECG windows from four subjects. Twenty records are available for every subject, recorded at different times.
This observation implies that an AC vector can be used directly for classification. However, depending on the sampling frequency of the ECGs, the dimensionality of an AC window can be considerably high, and dimensionality reduction is required.
Figure. 7. Fast Fourier transform coefficients (20) of autocorrelated ECG windows from four subjects. Twenty records are available for every subject, recorded at different times.
D. Classification
Classification represents the last step of the identification procedure. For this step, every input feature vector is compared to the ones stored in the gallery set in order to find the best match. The similarity measure used is the Euclidean distance, with the nearest neighbor being a classifier. Template Matching (TM) can be used to achieve this objective, since reducing the number of clusters is equivalent to pruning the search space. TM is based on the correlation coefficient, which is estimated between every input AC ECG window and the corresponding ones in the gallery set. The goal is to locate those subjects in the database, which can be regarded as possible candidates for a given input signal. Having obtained a reduced set of possible identities, classification can be performed in a smaller scope. The correlation coefficient is a normalized statistic that reveals the degree of similarity of signals. The range of values is [-1, 1], with 1 indicating a perfect match, 0 indicating nonrelated signals, and -1 indicating an inverse relationship. However, this measure is not exclusively sufficient to perform identification; therefore, it is used as a pre-classification scheme. In order to reduce the group size for the identification process, a certain threshold, typically between 0.92 and 0.95, was set on the correlation coefficient to eliminate those members that were not likely candidates, so this reduces significantly the number of candidate classes among which classification is then carried out.
The similarity measure is based on normalized Euclidean distance, and the nearest neighbor (NN) is used as the classifier. The normalized Euclidean distance between two feature vectors x and y is defined as:
,
Where V is the dimensionality of the feature vectors, which is the number of FFT coefficients in the proposed method. This factor is there to assure fair comparisons for different dimensions that x might have. The FFT feature vector of the autocorrelated ECG signal is evaluated and compared to the corresponding FFT feature vectors of all subjects in the database to determine the best match. Figure (8) presents the distance matrices obtained with the proposed methodology between enrolment and test templates. The element i, j of the matrix represents the distance from the subject i to the subject j, according to the selected set of features.
signal-to-noise ratio (SNR) of the palm ECG signal is lower than of the chest ECG signal. However, the big advantages for palm ECG are easy to access, to combine with fingerprint/palm biometrics, and to use mental/dry electrodes. The signal averaging method successfully increased the SNR ratio thereby improving the system performance.
Figure. 8. Distance matrix between enrolment and test templates.
IV. CONCLUSION
This work concentrates on measurements of palm ECG signals from 40 normal healthy persons for human identification. For the combined system model, the identification rate was 100% in the predetermined group. Based on this feasability, the Lead-I ECG can be viewed as a potential new biometric for human identity verification. More filter development is desirable for future analysis of palm ECG signals to preserve biometric attributes while improving the signal-to-noise ratio. In addition, the long-term changes of an individual’s ECG signals and their implications for implementing a practical biometric system also need to be investigated.
Ongoing work, concerning more data and subjects tests will be published in the near future elsewhere.
REFERENCES
[1] Colin Soutar, “Implementation of biometric systems security and privacy considerations,” Information Security Technical Report, vol. 7, no. 4, pp. 49–55, December 2002.
[2] S. Pankanti A. K. Jain, L. Hong and R. Bolle, “An identity authentication system using fingerprints,” Proceeding of IEEE,, vol. 85, no. 9, pp. 1365–1388, 1997.
[3] Philipson L. Wide P Biel L., Pettersson O., “Ecg analysis: A new approach in human identification,” IEEE Trans. Instrum. Meas,, vol. 50, pp. 808–812, 2001.
[4] Gavshon L. W. Israel S. Irvine J. M., Wiederhold B. K., “Heart rate variability: A new biometric for human identification,” Proc. Intl. Conf. Artif. Intell,, pp. 1106–1111, 2001.
[5] Worck W. J. Irvine J. M. Israel S. A., Scruggs W. T., “Fusing face and ecg for person identification,” IEEE App. Imag. Paternt. Recogn. Workshop,, p. 226, 2003.
[6] Hu Y. H. Shen T. W., Tompkins W. J., “One-lead ecg for identity verification,” Proc. IEEE EMBS/BMES Conf,, pp. 62–63, 2002. [7] L. Biel, O. Pettersson, P. Lennart and W. Peter, ECG Analysis: A New Approach in Human Identification, IEEE Transaction on
Instrumentation and Measurement, vol. 50(3), 2001, pp. 808-812.
[8] T. W. Shen, W. J. Tompkins and Y. H., One-Lead ECG for Identity Verification. in Proceedings of the Second Joint EMBS/BMES Conference, 2002, pp. 62-63.
[9] S. A. Israel, J. M. Irvine, C. Andrew, D. W. Mark and K. W. Brenda, ECG to Identify Individuals, Pattern Recognition, vol. 38(1), 2005, pp. 133-142.
[10] E. Schrama J. Hess P. R. Rijnbeek, M. Witsenburg and J. A. Kors, “New normal limits for the pediatric electrocardiogram,” European Heart Journal, vol. 22.
[11] R. Passman J. Goldberger T. Taneja, B. W. Mahnert and A. Kadish, “Effects of sex and age on electrocardiographic and cardiac electrophysiological properties in adults,” Pacing and Clinical Electrophysiology PACE, vol. 24(1).
[12] A. J. Manal L. Y. Stanford R. Q. Stephen G. M. Friesen, C. J. Thomas and N. Troy, “A comparison of the noise sensitivity of nine qrs detection algorithms,” IEEE Transaction on Biomedical Engineering, vol. 37(1).
[13] National Instruments Developer zone, ,” in LabVIEW for ECG signal processing. NI, 2008.
[14] S.T.Hamde L.M.Waghmare Channappa B, Kalpana.V, “Estimation of ecg features using labview,” International Journal of Computing Science and Communication Technologies,, vol. 2, no. 1, pp. 320–324, July 2010.
[15] T. W. Shen, “Biometric identity verification based on electrocardiogram ecg,,” Ph.D. thesis, University of Wisconsin, Madison,, 2005. [16] A. Cheng M. D. Wiederhold S. A. Israel, J. M. Irvine and B. K. Wiederhold, “Ecg to identify individuals,” Pattern Recognit., vol. 38,
no. 1, pp. 133–142, 2005.
[17] K. N. Plataniotis Y. Wang and D. Hatzinakos, “Integrating analytic and appearance attributes for human identification from ecg signal,,” in Proceedings of Biometrics Symposiums (BSYM), Baltimore,, September 2006.
[18] D. Kreiseler R. Bousseljot G. W ubbeler, M. Stavridis and C. Elster, “Verification of humans using the electrocardiogram,,” Pattern Recognit. Lett.,, vol. 28, pp. 1175–1175, 2007.
[19] E. Miceheli-Tzanakou Nikolaos V. Boulgouris, K. N. Plataniotis, ,” in Biometrics Theory, methods, and Applications. ed. Wiley and IEEE Press series on cpmutational Intelligence., 2011.
[20] W. J. Scheirer T. E. Boult and R. Woodworth, ,” in Revocable fingerprint biotokens: Accuracy and security analysis. vol. IEEE Conference on Computer Vision and Pattern Recognition. IEEE, June 2007.
[21] F. Farooq S. Tulyakov and V. Govindaraju., ,” in Symmetric hash func- tions for fingerprint minutiae. in Lecture Notes in Computer Science, Springer, Berlin, 2005, vol. 3687, p. 3038.
AUTHORS PROFILE
Noureddine Belgacem was born in 1975 in Tlemcen (Algeria); he received his B.Sc. degree in
Electronics at the University of Abou Bekr Belkaïd of Tlemcen, then his first post graduation degree in Signals and Systems in 2002. Since 2003 he is an Assistant Professor in the Department of Electrical and Electronics Engineering, University of Abou Bekr Belkaïd of Tlemcen, Algeria. His current areas of interest are Pattern recognition, physiological processing and biometrics.
Amine Naït-Ali was born in 1972 in Oran (Algeria); he received his B.Sc. degree in Electrical Engineering at the University of Sciences and Technology of Oran, then his DEA degree in Automatic and Signal Processing at University Paris 11 and his Ph.D. degree in Biomedical Engineering from the University Paris 12 in 1998 and the ability to manage research. He is now Professor in Applied Signal Processing. His research interests are focused on physiological processing, processes modelling and medical signal and image compression.
Fethi Bereksi Reguig received the engineering degree in Electronics from the University of Science and