27
CONSIDERATIONS ON COMMERCIAL GLOBALIZATION (I – THE
DYNAMICS OF THE COMMERCIAL FLOWS: EVOLUTIONS AND
STRUCTURAL MODIFICATIONS)
Bădulescu DanielUniversity of Oradea, Faculty of Economics, Str. UniversităĠii nr. 1, 410087-Oradea, E-mail:
[email protected], Phone: 0259/408410
Abstract:
Following the WW II, the global economic evolution is more and more marked by the relevant dynamic of the commercial trades that had become the core of the economic development both for the developed countries and for the emerging economies. The average annual growth rhythm of the international goods trade was practically double in comparison with that of the production (real GDP), both for the developed and for the developing countries. Thus, between 1960 and 2005, the rate of the commercial trades in the global GDP increased from 24% to 46%, practically doubling in the 45 years.
Key words: globalization, commerce, evolution
Following the WW II, the global economic evolution is more and more marked by the relevant dynamic of the commercial trades that had become the core of the economic development both for the developed countries and for the emerging economies. The average annual growth rhythm of the international goods trade was practically double in comparison with that of the production (real GDP), both for the developed and for the developing countries The dynamic of the international trade has systematically exceeded the dynamic of the GDP (see table no. 2.1):
Table no. 2.1. The comparative evolution of the real GDP and the international goods trade
Categories of countries Annual growth rhythm for the real GDP
Annual growth rhythm for the international goods trade 1987-1996 1997-2006 2006 1987-1996 1997-2006 2006
World total 3,3% 3,9% 4,4% 6,6% 6,9% 8%
Developed countries (the USA, Euro area, Japan, others)
3% 2,7% 3% 6,6% 5,7% 7%
Emerging and
developing countries
3,9% 5,3% 6% 6,8% 9,1% 9,9%
Source: data of the National Bureau for Economic Research, www.nber.org
28
The dynamics of the commercial trades is not a recent phenomenon, their boom beginning together with the industrial revolution. Thus, on a long term, the average annual growth rhythm of the commercial flows had been fairly high even in the previous periods: the growth of the annual volume of exports with the main industrialised countries was 4.2% between 1820 and 1870 and 4% between 1870 and 1989 (Maddison, p. 75).
The analysis of the comparative rhythms of evolution for the two indicators (GDP and global commerce) has to be completed with the analysis of the commerce contribution to the growth of the world GDP.
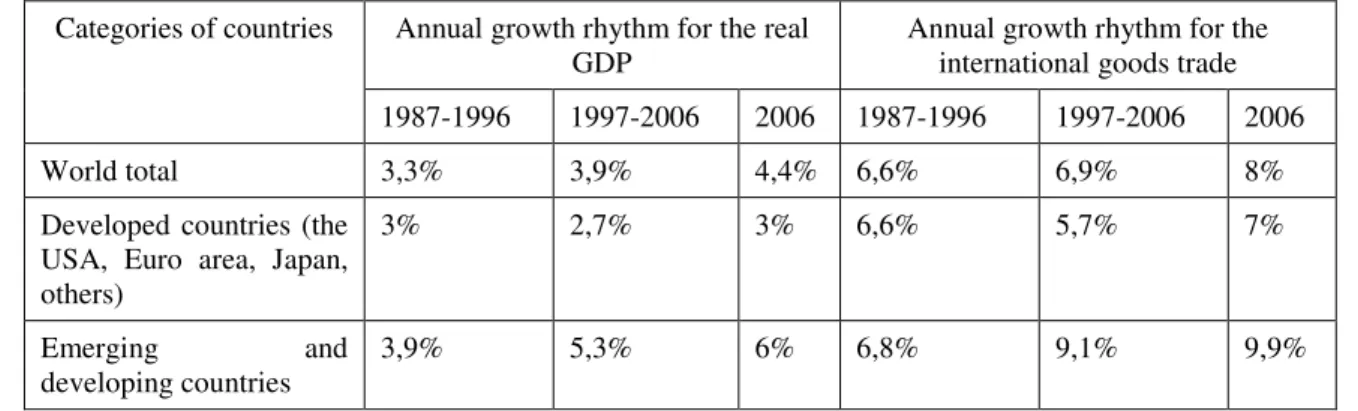
The following chart synthesises data concerning the rate of the international commerce in the GDP of 5 countries, between 1870 and 1995:
Figure no 2.1. The evolution of international trade rate in the GDP of some countries, 1870-1995, in %
Source: Held, D. et al., op. cit, p.191 and 204
As one can notice on a long term the evolution of the rate of the commerce in the GDP did not face major changes. Thus, between 1960 and 2005, the rate of the commercial trades in the global GDP increased from 24% to 46%, practically doubling in the 45 years. Nevertheless, in the case of the industrialized countries in Europe, Japan and North America, the evolution has fluctuated in the past century: the report between exports and GDP was 22% in 1913, the year preceding WWI, decreasing to 15% in the decade 1950-1960, to then come to 22% in 1973, 30% in 1990 and 36% in 2004 (World Development Indicators 2004).
This phenomenon is obviously stimulated by the general trend of liberalization of industrial trades that followed the end of the WWII. This made the subject of multilateral negotiations within GATT (Rainelli 2003). Starting with the first rounds of negotiations organized in Geneva and Annecy at the end of the 1940s, the average customs taxes on imports from the industrialized countries dropped 10 times, getting from 40% to 4% in 2000 (Adda, p.68). The liberalization of the trades was also stimulated by establishing the Common European Market and by various projects of customs unifications or regional agreements of free trade launched afterwards (such as Mercosur, which regroups Brazil, Argentina, Uruguay and Paraguay in Latin America and NAFTA, which unites the United States, Canada and Mexico in North America). It has finally extended, since the beginning of the 1980s, towards the developing countries under the effect of the liberalisation policies imposed by the IMF and the World Bank within the management of the debt crises.
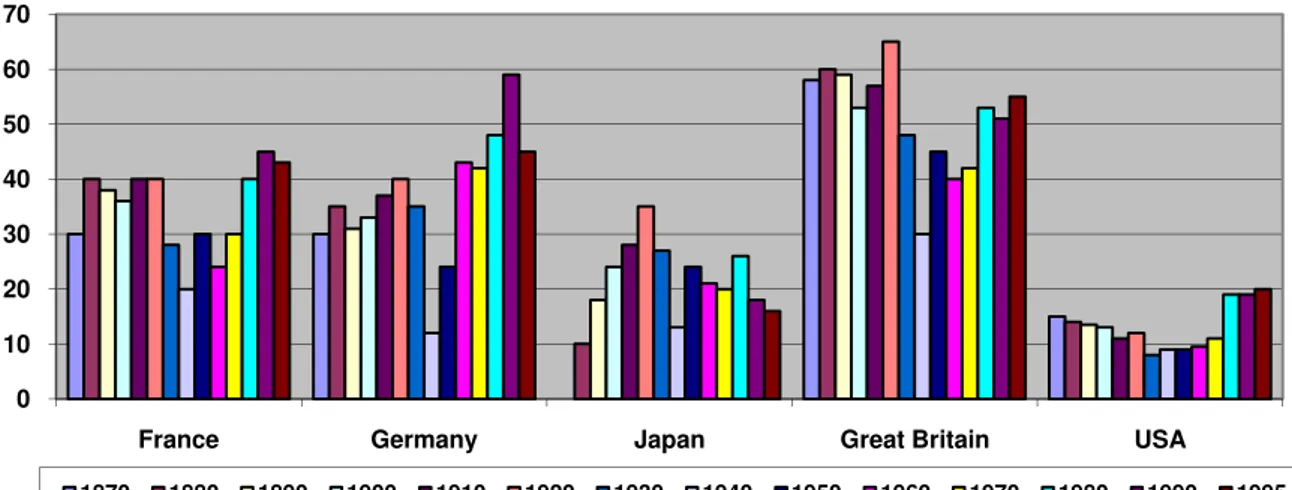
The following figure synthesises the evolution between 1960-2004, of the two indicators mentioned, the average annual growth rhythm of the GDP and the contribution of the international trade to the formation of the world GDP.
0 10 20 30 40 50 60 70
France Germany Japan Great Britain USA
29
Figure no. 2.2. Dynamic of the international commerce, 1960-2004, in %
Note: the values for the GDP growth rhythm correspond to the scale on the left while those for International commerce rate in the GDP correspond to the one on the right
Source: produced by the author on the basis of data available in World Development Indicators and Global Economic Prospects
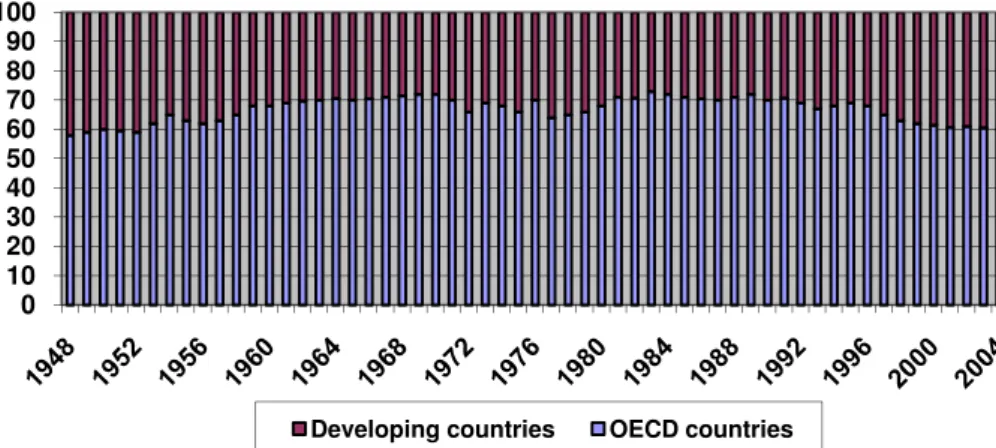
As stated, the global commerce has become a propellant of development in all the countries of the world. Between 1990 and 2003, the number of countries with an international commerce exceeding a third of their GDP raised form 90 to 125, and the number of countries for which the contribution of the international commerce to the GDP exceeds 50% raised form 54 to 92 (World Development Indicators, 2004, p. 306). Commerce remains confined to a small number of countries (the G7 countries concentrate 42% of the global commerce), while the rate of the 150 developing countries to the global commerce stayed stable at 40% all along the after-war period. The evolution of the rate of the developed countries and of the developing ones to the global commerce is presented in the figure beneath:
Figure no. 2.3. Evolution of the developed countries rate and of the developing countries rate in the global commerce
Source: produced by the author on the basis of the data available in World Development Indicators 2004 and Global Economic Prospects, http://econ.worldbank.org/
After 1995, the rate of the developing countries has an ascendant tendency as a result of the policies of economic liberalisation in favour of the economic openness. The countries with the highest level of commercial openness21
21
the sum of commercial flows as share to GDP
0 10 20 30 40 50 60 70 80 90 100
Developing countries OECD countries
0 10 20 30 40 50 60
-5 0 5 10 15
30
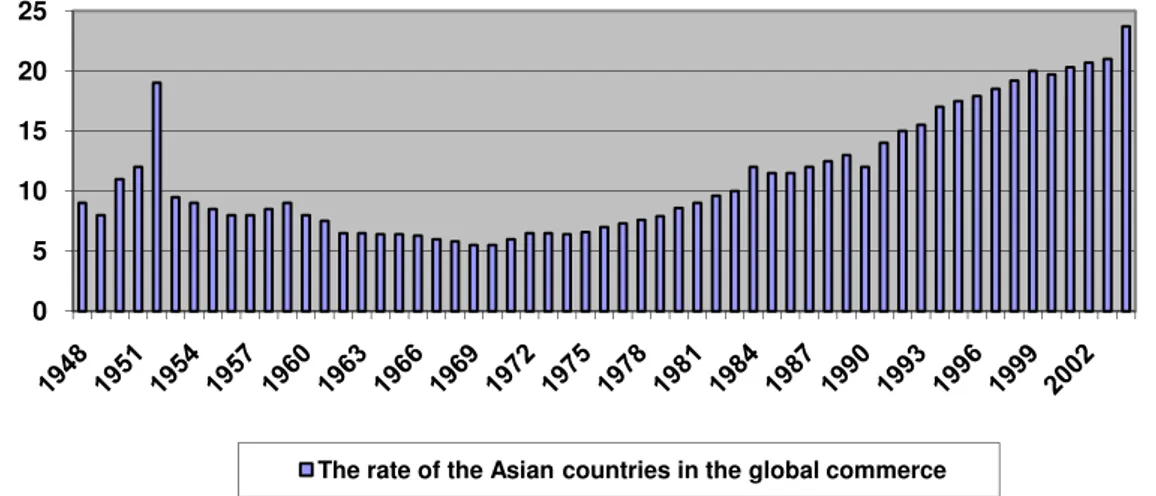
are also the ones best integrated in the globalisation, having a diversified and dynamic economy that attracts foreign investment flows. That holds true mainly for the Asian countries, whose commercial openness ranges between 100% (Thailand, Philippines, and Taiwan) and 300% (Singapore and Hong Kong). The figure below shows the evolution of the rate of the Asian countries in the global commerce:
Figure no. 2.4. The growth of the rate of the Asian countries in the global commerce, 1948-2004, in %
Source: produced by the author on the basis of the data available in World Development Indicators 2004 and Global Economic Prospects
Bibliography:
1. Adda, J., La mondialisation de l'economie, Paris, La Decouverte, 2001
2. Held, D., McGrew, A., Goldblatt, D. úi Perraton, J., Transformări globale. Politică, economie úi cultură, Editura Polirom, Iaúi, 2004
3. Maddison, A., Dynamic Forces in Capitalist Development, Oxford University Press, 1991 4. Rainelli, M., ComerĠul internaĠional, Bucharest, Arc Publishing House, 2003
5. World Development Indicators 2004, http://web.worldbank.org/ 6. www.nber.org
7. http://econ.worldbank.org/ 0
5 10 15 20 25