Contrast Sensitivity and Response Latency in the
Dorsomedial and Middle Temporal Areas of the Primate
Extrastriate Cortex
Leo L. Lui1,2*, James A. Bourne1,3, Marcello G. P. Rosa1,2
1Department of Physiology, Monash University, Clayton, Victoria, Australia, 2Monash Vision Group, Monash University, Clayton, Victoria, Australia,3Australian Regenerative Medicine Institute, Monash University, Clayton, Victoria, Australia
Abstract
Analysis of the physiological properties of single neurons in visual cortex has demonstrated that both the extent of their receptive fields and the latency of their responses depend on stimulus contrast. Here, we explore the question of whether there are also systematic relationships between these response properties across different cells in a neuronal population. Single unit recordings were obtained from the middle temporal (MT) and dorsomedial (DM) extrastriate areas of anaesthetized marmoset monkeys. For each cell, spatial integration properties (length and width summation, as well as the presence of end- and side-inhibition within 15uof the receptive field centre) were determined using gratings of optimal direction of motion and spatial and temporal frequencies, at 60% contrast. Following this, contrast sensitivity was assessed using gratings of near-optimal length and width. In both areas, we found a relationship between spatial integration and contrast sensitivity properties: cells that summated over smaller areas of the visual field, and cells that displayed response inhibition at larger stimulus sizes, tended to show higher contrast sensitivity. In a sample of MT neurons, we found that cells showing longer latency responses also tended to summate over larger expanses of visual space in comparison with neurons that had shorter latencies. In addition, longer-latency neurons also tended to show less obvious surround inhibition. Interestingly, all of these effects were stronger and more consistent with respect to the selectivity for stimulus width and strength of side-inhibition than for length selectivity and end-inhibition. The results are partially consistent with a hierarchical model whereby more extensive receptive fields require convergence of information from larger pools of ‘‘feedforward’’ afferent neurons to reach near-optimal responses. They also suggest that a common gain normalization mechanism within MT and DM is involved, the spatial extent of which is more evident along the cell’s preferred axis of motion.
Citation:Lui LL, Bourne JA, Rosa MGP (2013) Relationship between Size Summation Properties, Contrast Sensitivity and Response Latency in the Dorsomedial and Middle Temporal Areas of the Primate Extrastriate Cortex. PLoS ONE 8(6): e68276. doi:10.1371/journal.pone.0068276
Editor:Manuel S. Malmierca, University of Salamanca- Institute for Neuroscience of Castille and Leon and Medical School, Spain ReceivedSeptember 5, 2012;AcceptedMay 31, 2013;PublishedJune 28, 2013
Copyright:ß2013 Lui et al. This is an open-access article distributed under the terms of the Creative Commons Attribution License, which permits unrestricted
use, distribution, and reproduction in any medium, provided the original author and source are credited.
Funding:This work was funded by the Australian Research Council, www.arc.gov.au, (Grant DP0878965); Bionic Vision Sciences and Technology Initiative (SR100006); and by the National Health and Medical Research Council, www.nhmrc.gov.au, (Grant 491022). LL was funded by CJ Martin Biomedical Fellowship (490908) awarded by the National Health and Medical Council of Australia. The funders had no role in study design, data collection and analysis, decision to publish, or preparation of the manuscript.
Competing Interests:The authors have declared that no competing interests exist. * E-mail: [email protected]
Introduction
The responses of single units in the primate visual system summate over larger areas of visual field during the presentation of low contrast stimuli, in comparison with high contrast stimuli [1,2,3,4,5,6]. In addition, surround inhibition of neuronal responses becomes more prominent, and more frequent across the population of cells, as the stimulus contrast increases [7]. At the same time, we know that increasing the stimulus contrast also leads to a reduction in response latencies throughout the visual system [8,9,10,11,12]. To date, correlations between receptive field size, contrast sensitivity and latency have been demonstrated for single neuron responses. Here, we look at this issue from a different perspective, asking whether these response properties co-vary within neuronal populations. Cells in the same cortical area differ with respect to the way they respond to changes to stimulus
size and contrast [13,14,15,16,17,18], and their response latencies encompass relatively broad ranges. This raises the question of whether there are systematic relationships between the spatial summation properties of different cells, their contrast sensitivities, and response latencies. For example, do cells with low and high contrast sensitivity differ in terms of their spatial summation properties? Is a neuron’s response latency related to its contrast sensitivity? These questions have implications for understanding the spatial and temporal dynamics of how large populations of neurons respond in concert, during viewing of natural scenes.
investigation. For comparison, we studied cells in the dorsomedial area (DM), an extrastriate area that is similar to MT in terms of a dominant afferent input from layer 4 b of V1 [22], heavy myelination, and neuronal receptive field sizes [23,24]. Despite these similarities, DM and MT are physiologically and anatom-ically distinct [25,26,27]. For example, unlike those in MT, DM neurons vary widely with respect to direction selectivity, but tend to be narrowly tuned for orientation [28]. Our results indicate that contrast sensitivity is related, in both areas, to size summation, alluding to common neural mechanisms. In addition, results in MT indicate that the shortest-latency responses to stimuli flashed within the receptive field are associated with the neurons that show the highest contrast sensitivity.
Materials and Methods
Ethics Statement
The experiments were approved by the Monash University Animal Experimentation Ethics Committee (Project Approvals: PHYS/2000/09, PHYS/2003/05, SOBSA/2006/10), which also monitored the welfare of the animals. All procedures followed the guidelines of the Australian Code of Practice for the Care and Use of Animals for Scientific Purposes. Data were collected from 18 adult New World monkeys (Callithrix jacchus, the common marmoset), as part of a series of experiments that also included single-unit recordings from other areas, and analyses of neuronal responses to other types of stimulus [17,28,29,30,31,32,33]. These animals were bred for the purpose of scientific research at the Australian National Primate Facility, sponsored by the National Health and Medical Research Council. They were housed with compatible animals in cages with 0.9 m2floor space and 2 m in height, with daily access to outside runs (1.4 m2floor space and 2 m in height). Throughout their life they hadad libitum daily access to water and balanced nutrient pellets, as well as fruit, vegetables and meal worms on different days of the week. In addition to the outside runs and diet rotation, environmental enrichment was provided in the family cages, in the form of ropes, ladders, hanging toys, bamboo stems, and other substrates to encourage diverse motor activities. Two to four weeks before the electrophysiological experiments they were transported to Monash University, where they were housed in 2 m3cages (1 m2floor area, and 2 m high). Animals were housed in pairs wherever a compatible partner was available, and were always within visual and acoustic range of other individuals of the same species. The same types of indoor enrichment and diet described above were available at this location, and their health was monitored on a daily basis. The animals were anaesthetized for the entire period of the electrophysiological experiments, and were killed by barbiturate overdose at the end of the recording sessions without recovering consciousness.
Preparation
The surgical preparation and the procedures for recording and visual stimulation have been described in detail [34]. Anesthesia was induced with ketamine (50 mg.kg21
) and xylazine (3 mg.kg21
), allowing a tracheotomy, cannulation of the saphe-nous vein, and a craniotomy. The dura mater overlying the dorsal cortical surface was removed, and the cortex covered with a thin layer of silicone oil in order to prevent desiccation. After all surgical procedures were completed, the animal was administered an intravenous infusion of pancuronium bromide (0.1 mg.kg21.h21), combined with sufentanil (6mg.kg21.h21) and dexamethasone (0.4 mg.kg21.h21), in a saline/glucose solution, which induced muscular paralysis while maintaining anesthesia. The animal was artificially ventilated with a gaseous mixture of
nitrous oxide and oxygen (7:3). The level of anesthesia was monitored using electrocardiogram, blood pressure, SpO2, and the level of cortical spontaneous activity. Administration of atropine (1%) and phenylephrine hydrochloride (10%) eye drops resulted in mydriasis and cycloplegia. Appropriate focus and protection of the corneas from desiccation were achieved by means of hard contact lenses, which brought into focus the surface of a computer monitor located 40 cm in front of the animal. Visual stimuli were presented to the eye contralateral to the hemisphere from which the neuronal recordings were obtained.
Recording Sites
Parylene-coated tungsten microelectrodes with exposed tips of 10mm were directed towards areas MT and DM based on stereotaxic coordinates and sulcal morphology. Provisional attri-bution of recording sites to MT during the experiment was based on mapping of multiunit receptive fields, using electrodes that penetrated vertically: a dorsoventral movement of the electrodes in the brain is expected to result in a gradual shift in the position of the MT receptive fields, from the lower quadrant towards the upper quadrant, and a gradual decrease in the eccentricity of receptive fields [35]. This trend, together with the obvious direction selectivity of neurons, allowed us to estimate the dorsal and ventral borders of MT during the recording session. The initial attribution of recording sites to DM was also initially determined by mapping of multiunit receptive fields, conducted at the beginning of the experimental sessions. In this case, sequences of recording sites starting in dorsal V2 (second visual area) and moving progressively more anterior, across DM, revealed recep-tive fields that drift gradually from the horizontal meridian of the visual field to the vicinity of the vertical meridian [36]. Confirming previous reports [37,38], we found that, depending on the mediolateral level, a rostral progression of recording sites within DM resulted in receptive fields that either reverted towards the lower visual field, or moved into the upper field. The present sample of DM recordings was concentrated on the part of DM located on the dorsal surface near the midline, resulting in receptive fields in the lower visual field. In both DM and MT, we obtained samples of receptive fields centred at a similar range of eccentricities (5u–20u). Confirmation of the location of the recording sites in both areas was based on histological examination of the electrode tracks, relative to myeloarchitectural criteria [23,24].
Electrophysiological Recordings
Following the determination of the receptive field centers (points of maximal response), neuronal response properties were studied quantitatively using computer-controlled stimuli. The experiments consisted of two steps, carried out sequentially for each DM or MT neuron. First, we obtained estimates of the cell’s size selectivity and response latency characteristics, using high contrast (60%) gratings of optimal spatial and temporal frequency and optimal direction of motion. Then, the contrast sensitivity functions for the same cells were measured in tests where the contrast was the only variable manipulated, while spatiotemporal characteristics, direction and size were kept constant at near-optimal values (as determined in the course of the initial tests).
Each condition was presented a minimum of eight times, in randomized order within each block. An inter-trial interval of at least 4 s, during which the grey screen was presented, separated trials. The stimuli for all quantitative tests consisted of rectangular patches of drifting gratings presented against a uniform grey background. The grey background had luminance equivalent to the average across the gratings (which was in the low photopic range, 2.7 cd.m22). Each trial started with a 0.5 s presentation of the grey screen, during which measurements of spontaneous activity were obtained. Drifting gratings were then presented for 2 s at constant speed, with the phase at the centre point of the stimulus randomized between trials, drawn from a distribution includingJcycle steps. In the majority of the tests, encompassing cells in both DM and MT, the presentation of the gratings was ‘‘ramped’’, with the contrast increasing from zero to the desired value over the first 500 ms of presentation. This approach was chosen in order to minimize transient responses to the sudden appearance of the grating on the screen (thus dissociating sensitivity to flashes from contrast sensitivity per se). However, this had the obvious consequences of increasing the estimates of response latency because of the additional time required for the stimulus to reach threshold contrast, and possibly allowing cells with higher contrast sensitivity to respond earlier. Thus, in order to investigate the relationships between size summation, contrast sensitivity and latency, in a subset of MT cells the gratings were ‘‘flashed’’ immediately from the first frame of presentation (hence isolating the component due to conduction along the visual pathway). Only cells using ‘‘flashed’’ presentation were used to assess relationships with latency.
The tests conducted for each cell followed the same sequence. First, tests were performed to determine optimal values of direction of motion, spatial frequency (range tested 0.08–2.4 cycles.deg21
) and temporal frequency (0.18–10.9 Hz) for each neuron, using 60% contrast gratings. This range was chosen empirically, to encompass optimal values for most, if not all cells in the sampled regions of DM and MT [28,32]. Once optimal spatiotemporal parameters were determined, we performed size selectivity tests, in which the length and width of the gratings were manipulated independently [17]. For each cell, five values of length and width were tested, resulting in 25 stimulus conditions. These included values that were smaller than the minimum response receptive fields of most MT and DM neurons (2u, 4u), values that approximately coincided with the typical sizes of these receptive fields (8u, 16u), and values that were larger than the vast majority of receptive fields (30u). The different grating dimensions were achieved by electronic ‘‘masking’’ of a single large stimulus. Throughout this paper references to the length of the grating stimulus indicate the dimension along which the grating elements had constant luminance, while along the width dimension the grating luminance changed according to a sine-wave function. The direction of motion was always parallel to the width of the grating. Finally, gratings of 5 different luminance contrasts were presented,
ranging from 2% to 95% at the peak (constant-contrast) part of the presentation. In these tests the gratings had near optimal direction, spatial frequency, temporal frequency, length and width, as determined by the initial tests (i.e., at 60% contrast).
Histology
At the end of the experiment the animal was administered an overdose of sodium pentobarbitone and perfused transcardially with 0.9% saline, followed by 4% paraformaldehyde in 0.1 M phosphate buffer (pH 7.4). After cryoprotection by increasing concentrations of sucrose and sectioning at 40mm, alternate slides were stained for Nissl substance, using cresyl violet, and for myelin, using the Gallyas [39] method. Electrode tracks were reconstruct-ed with the aid of small electrolytic lesions (4mA, 10 s), which were placed at various sites during the experiment. Only cells confirmed as belonging to MT and DM, on the basis of the patterns of myelination [23,24], were included in the present report.
Data Analysis
The responses of each cell were converted into PSTHs with a 10 ms bin width, which formed the basis of all subsequent analysis. A single trial response was computed as the mean firing rate over the entire duration of stimulus (2 sec). Spontaneous activity was calculated from the mean firing rate during the 500 ms before stimulus onset. We only included cells which responded at a level at least two standard deviations above the mean spontaneous activity.
Both size summation properties and contrast response functions were determined by fitting parametric models (see below) using the Matlab function ‘‘lsqcurvefit’’ (MathWorks, Natick, MA). Using this approach, the best fit for each neuron was obtained by minimizing the sum-squared error between the neuronal response and the values obtained by the function. Curve fitting was based on the entire matrix of single trial responses, rather than the mean responses to each stimulus condition. The fittings were always constrained by the requirement that the resulting curves should cross the level of spontaneous activity at zero values of length, width or contrast [29]. Both parametric and non-parametric statistical tests were used in the analyses, as specified in ‘‘Results’’. Since the length and width summation properties of neurons can be interdependent [17], for each cell we fitted a 2 dimensional Gaussian to the matrix of responses as a function of grating length and width, after subtraction of the spontaneous activity:
R(l,w)~A| exp {(l 0)2
sl2
!
" #
| exp {(w 0)2
sw2 !
" #
ð1Þ
Where
l0~log lzloff LoptzLoff
coshzlog WzWoff WoptzWoff
sinh ð2Þ
Where
w0~{log lzloff loptzloff
sinhzlog WzWoff WoptzWoff
The function is a variant of the model used in [17]. Here, R(l, w) represent the response with respect to length (l) and width (w), while A, lopt, wopt, sl, sw, loff, woff, and hare free parameters. Parameter A accounts for the maximum response of the cells above spontaneous activity, and optimal length and width are given by lopt and wopt, respectively, which were constrained to a maximum value of 30u (the maximum length and width of the tested grating patches). Parameters sl and sw determined the width of the curve for each dimension. The offset parameters, loff and woff, are necessary for two reasons. First, they keep the logarithm from becoming undefined as the stimulus size approaches zero. Second, they also allow the rate of increase and decrease to deviate from a strict log-Gaussian function, hence affecting the shape of the tuning curve. Parameter hrepresents rotation of the model around its peak, allowing for interaction between length and width. This function provided good fits to the data, with median R2values of 0.93 and 0.92 for our sample of MT and DM cells respectively. Most importantly, it provided reliable parametric estimates of the optimal grating sizes for all of our neurons (see [17] for discussion). Responses and optimal fits to responses are illustrated in Figures 1 and 2.
In order to determine whether inhibition occurred at longer lengths and widths, confidence intervals for parameter estimates were computed from the Jacobian matrix and the residuals using the Matlab function ‘‘nlparci’’. If the 95% confidence interval prediction for the parameter lopt(optimal length) did not overlap with 30u(maximum patch length tested), the cell was classified as end-inhibited (EI). Conversely, if the 95% confidence interval prediction for parameter wopt(optimal width) did not extend to 30u, the cell was classified as side-inhibited (SI). Cells that were not EI or SI were classified as non-end inhibited by stimuli extending 15uon either side of the receptive field centre (NEI15) or non-side inhibited by stimuli extending 15uon ether side of the receptive field centre (NSI15). This nomenclature reflects the need for caution in the interpretation of results, as the entire visual field could not be stimulated using a CRT-based system; thus, it is possible that NEI15 and NSI15 cells would have revealed some degree of surround inhibition, had the stimuli been extended even further. However, we regard this caveat as unlikely to have affected our main conclusions regarding the relationship between strength of end- and side-inhibition and other variables. Here, it is important to recall that the maximum stimulus size used in the present experiment is at least 50% larger than the known
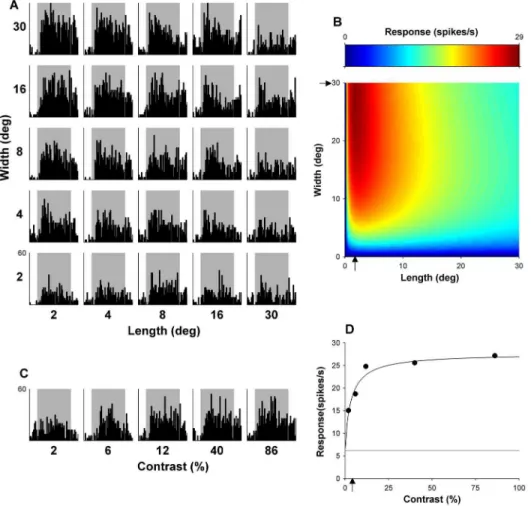
Figure 1. Example MT neuron.(A) Shows the matrix of PSTHs representing trials to all lengths and widths presented. The vertical scale, displaying response rate in spike/sec is located on the bottom left plot; the same scale applies to all histograms. (B) Shows the optimal fit of equation (1), which estimates response with respect to length and width. The arrows indicate estimates of optimal length and width, given by fitted parameters. This neuron is end-inhibited (EI) but shows no evidence of side inhibition when probed with stimuli covering up to 30uof visual angle (NSI15). (C) Displays peri-stimulus time histograms representing response over time to gratings of varying contrasts, shown with the same conversions as in (A). (D) Show the mean responses with respect to varying contrasts over the entire 2 sec presentation, fitted with equation (4). The arrow indicates C50. Thin grey line indicates mean spontaneous activity measured in the 500 ms before the onset of stimuli.
excitatory receptive field sizes of cells in DM and MT at the eccentricities sampled in our experiments (,15u [23,24]). It has been established that many cells in both DM and MT show facilitatory surrounds outside the borders of the classical receptive fields [28,30,40], therefore, size preferences of ,15u should be interpreted as facilitation from beyond the classical receptive field [28] rather than the size of the receptive field itself. Finally, despite these caveats, we note that the majority of neurons classified as NEI15and NSI15reached response plateaus at stimulus size values well below the 30ulimit of our presentation system (e.g. Fig. 1). Extending the stimuli beyond 30u, although possible through the use of a spherical projection system [41], would have resulted in less precise control of stimulus contrast, a key requirement for the present analyses.
To determine contrast sensitivity, the responses of cells to different contrasts were fitted (following subtraction of spontane-ous activity) with the following function:
R cð Þ~A| cn= cnzC
50n
ð Þ
h i
ð4Þ
where R(c) represents responses with respect to contrast (c). There were three free parameters: A, representing the maximal response, n, the exponent indicating the slope, and C50, the half saturation
contrast (See Figs. 1 and 2). This function provides a good fit to contrast response functions of cells from visual cortex of both cat and monkey [42,43,44] Our data were no exception: the MT and DM data had median R2 values of 0.97 when fitted with this function.
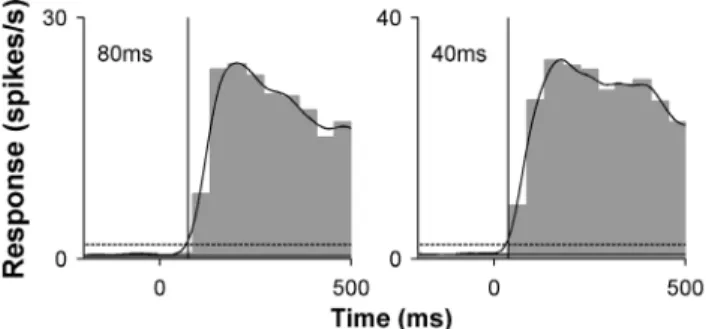
A standardized estimate of neuronal response latency of MT cells to ‘‘flashed’’ gratings was determined using combined data obtained in all trials in the tests aimed at determining size selectivity. As explained above, these trials (25 conditions x 8 repeats, = 200 trials) corresponded to presentations of 60% contrast gratings at optimal direction, spatial and temporal frequency. The neural activity obtained in these tests was combined into a ‘‘grand PSTH’’ [33], which was used to determine response latency. As shown in Figure 3 the spike trains were convolved with a Gaussian kernel (s= 20 ms), in 10 ms steps, and the latency was estimated as the time at which the resulting spike density function first exceeded one standard deviation above spontaneous activity.
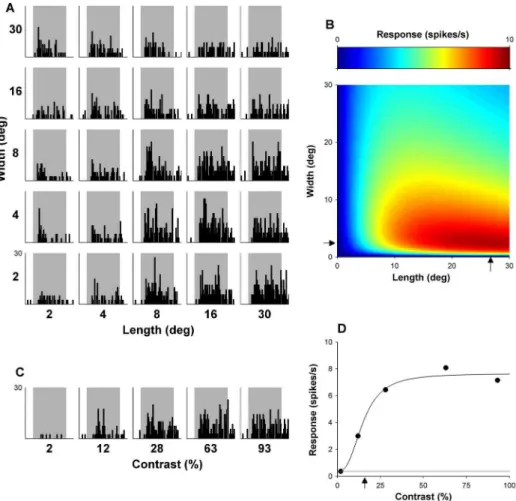
Both parametric and non-parametric statistical tests, depending on the distribution of the data, were used to compare means and evaluate correlations between two variables. To test whether two variables had any effect on a third variable, we fitted linear models to our data. We added one free parameter at a time to the model which represented each variable and possible interaction effects. Figure 2. Responses of an example DM neuron, illustrated with the same conventions used in Figure 2.(A) Shows the matrix of PSTHs obtained by presentation of all lengths and widths tested, and (B) the shows the optimal fit of equation (1), with estimates of optimal length and width (arrows). This neuron is side-inhibited (SI) but shows no evidence of end inhibition when probed with stimuli covering up to 30uof visual angle (NEI15). (C) Displays PSTHs representing response over time to gratings of varying contrasts. (D) Show the mean responses with respect to varying contrasts, and an estimate of C50(arrow).
Sequential F-tests were used to evaluate whether the each extra free parameter in the model provided a better fit to the data. A significant result (P,0.05) would imply that a particular variable was significantly related to the dependent variable.
Results
Comparison of Size Summation Properties
We characterized the size summation properties of 157 MT neurons and 99 DM neurons using high contrast (60% gratings). Previous studies have reported on size summation characteristics of cells in these areas [17,28]. Here, in order to allow for a more direct comparison, we applied the same methods of analysis to samples obtained under identical experimental conditions, and only included receptive fields covering the same range of eccentricities. Therefore, we only included MT data that were obtained with ‘‘ramped’’ stimulus presentation (N = 79), as all DM samples were gathered using this method. This analysis supported the view that cells in these areas have distinct size selectivity properties.
Examples of the dependence of responses of typical MT and DM neurons on grating length and width are illustrated in Figures 1 and 2, respectively. Optimal fits of equation (1) to these data are presented in part B of these figures. As explained in the Materials and Methods, the optimized values of lopt and wopt yielded estimates of optimal length and width, and the confidence intervals of these free parameters were used to determine the presence of end- and side-inhibition within the stimulated zone surrounding the receptive field centre (to a maximum of 30u630u).
Figure 4 (left) summarises the preferred length and width of gratings for our sample of MT (top) and DM (bottom) neurons. On average, MT neurons preferred significantly shorter grating patches, in comparison with DM cells (Optimal length; median [MT] = 17.8u; median [DM] = 26.0u; Wilcoxon rank sum test, P = 0.0001; Fig. 4 middle column). Correspondingly, a signifi-cantly larger proportion of MT cells showed end-inhibition when stimulated with gratings up to 30uin size (52%), in comparison with those in DM (34%;x2(1) = 5.6, P = 0.018). The opposite effect was observed when preference for the width of the stimulus was tested: MT neurons preferred wider patches (i.e., consisting of
more cycles of the grating moving in file) in comparison with DM neurons (Optimal width; median [MT] = 27.7u; median [DM] = 15.6u; Wilcoxon rank sum test p = 0.0004; Fig. 4 right column). The proportion of NSI15 cells was also lower in MT (37%) than in DM (63%;x2(1) = 4.5, P = 0.001). In summary, MT neurons tend to respond maximally to gratings that are relatively short and wide, while those in DM prefer gratings that are long and narrow.
Relationship between Size Selectivity and Contrast Sensitivity
In this section we consider whether the size summation properties of different cells are related to their contrast sensitivity. Figures 5 and 6 illustrate aspects of the relationship between size summation properties and contrast sensitivity. A total of 116 MT and 79 DM neurons were included, for which both the size selectivity test and the contrast sensitivity test were completed. Measures of preferred stimulus size were described above, and C50 was used as a measure of contrast sensitivity (Figs. 1 and 2).
In DM the relationship between preferred length and contrast sensitivity was not significant (Spearman’s r = 0.17, P = 0.16; Fig. 5A, B), and no difference in median C50 was found when cells were classified as EI or NEI15(Wilcoxon rank sum P = 0.58; Fig. 5C). In contrast, a significant positive correlation was found between preferred width and C50(Spearman’s r = 0.33, P = 0.003), as illustrated in Figure 5 (D, E). This relationship was supported by that fact that the SI cells had significantly lower C50, in comparison with NSI15 cells (Wilcoxon rank-sum test, P = 0.0007; Fig. 5F).
Results obtained in area MT resembled those in DM in that there was no significant main effect of preferred length on contrast sensitivity (F = 2.25, P = 0.14; Fig. 6A, B). There was, in addition, no main effect of method of presentation (‘‘ramped’’ versus ‘‘flashed’’) on contrast sensitivity (F = 3.2, P = 0.075). However, the results indicated a significant interaction effect between preferred length and method of presentation, in relation to contrast sensitivity (F = 7.4, P = 0.008). This is evidenced in Figure 6B by a significant positive correlation between optimal length and C50, which was present when MT cells were tested with ‘‘ramped’’ stimuli (Spearman’s r = 0.35, P = 0.01), but not with ‘‘flashed’’ stimuli (Spearman’s r =20.06, P = 0.61). Using evidence of end-inhibition in the neighbourhood of the receptive field as a measure of length selectivity reveals a parallel result (Fig. 6C): there was no effect of end-inhibition on contrast sensitivity (F = 1.45, P = 0.23) and no significant main effect for method of presentation (F = 2.9, P = 0.09), but there was a significant interaction effect (F = 8.45, P = 0.004). EI cells were more sensitive to lower contrasts in the ‘‘ramped’’ condition (Wilcoxon rank sum P = 0.04; Fig. 6C), but not the ‘‘flashed’’ condition (P = 0.51).
The relationship between width summation and contrast sensitivity in MT was simpler, and resembled the results obtained in DM. Cells that preferred narrow gratings tended to be more sensitive to low contrast (F = 6.06, P = 0.015; Fig. 6D, E). A main effect for method of presentation on C50was also found (F = 6.86, P = 0.01), but no interaction was present (F = 0.83, P = 0.36), indicating the relationship between preferred width and C50was applicable to both ‘‘flashed’’ and ‘‘ramped’’ gratings. Analysis of the data according to the presence or absence of significant side-inhibition in the neighbourhood of the receptive field supported these findings (Fig. 6F), with significant main effects being found for presence of side-inhibition (F = 4.3, P = 0.04) and method of presentation (F = 5.3, P = 0.02), but no interaction being evident between these factors (F = 0.60, P = 0.44).
Relationship between Contrast Sensitivity and Response Latency in MT
We asked whether there is a cross-population relationship between contrast sensitivity and response latency, with the hypothesis that neurons that are highly sensitive to contrast also tend to respond earlier (i.e., to have shorter neural latencies) upon the presentation of a same stimulus. For each cell a standardised value of response latency was obtained upon presentation of 60% contrast gratings of optimal spatial and temporal frequency (Fig. 3), and C50 was used as a measure of contrast sensitivity (Figs. 1D, 2D). To eliminate the possible confounds, analysis here was restricted to neurons that were presented with ‘‘flashed’’ gratings; therefore, the analysis presented in Figure 7 includes data from 74 MT neurons. A significant correlation was found (Spearman’s r = 0.63 P,0.00001), where cells which responded earlier were also more sensitive to low contrasts. The mean latency in response to ‘‘flashed’’ gratings in MT was 74.264.1 ms, which compared well with values obtained in the macaque [45,46], although many of the cells with high contrast sensitivity responded with latencies under 50 ms.
Relationship between Preferred Stimulus Size and Response Latency in MT
In this section we consider whether the size summation properties of different cells were related to their response latencies. Our hypothesis was cells that summate across larger expanses of
visual space take longer to respond, as they are likely to represent higher-order levels of hierarchical processing within the same area [47]. Again, this analysis was restricted to the 74 MT cells with ‘‘flashed’’ gratings. We analysed whether both the optimal length and width of visual stimuli, and the presence of end- and side-inhibition in the region of the visual field immediately surrounding the receptive field were related the response latencies of different cells. No significant relationship was found between preferred length and latency (Spearman’s r = 0.23, P = 0.053; Fig. 8A and B), and, correspondingly, the latencies of EI cells were not significantly different to those of NEI15cells (Wilcoxon rank-sum test: P = 0.09; Fig. 8C). However, there was a significant relationship between optimal width and latency: cells that preferred narrow gratings responding significantly earlier than cells that preferred wide gratings (Spearman’s r = 0.51, P,0.00001; Fig. 8D and E). In addition, SI cells also tended to respond earlier than NSI15 cells (Wilcoxon rank-sum test: P = 0.0008; Fig. 8F).
Effect of Firing Rates
P = 0.001). For MT, no significant relationship was found between maximum response rate and preferred grating length, either with the ‘‘ramped’’ (Fig. 10A; r = 0.11, P = 0.30) or the ‘‘flashed’’ (r = 0.21, P = 0.07) methods of presentation. In addition, no relationship was found between preferred width and maximal response rate (Fig. 10B; Ramped: r =20.08 P = 0.50; Flashed: r = 0.00, P = 0.99). An inverse relationship was found between contrast sensitivity and response rates for MT, but only for the ramped method of presentation (Fig. 10C Ramped: r =20.31 P = 0.03; Flashed: r =20.03, P = 0.81). Lastly, no significant
relationship was found between maximal response rate and latency (Fig. 10D; Flashed only: r =20.23, P = 0.053). As the relationships between other parameters and response rate are at best sporadic, the relationships reported in the above sections are unlikely be attributed solely to co-variation with firing rates.
Discussion
Based on single-unit responses recorded in two extrastriate areas (DM and MT), we report on the relationship between three basic response properties of visual cortical neurons: contrast sensitivity, Figure 5. Relationship between contrast sensitivity (half-saturation contrast, C50) and the spatial properties of the receptive fields in area DM.Separate analyses are presented for the length (left column) and width (right column) dimensions of the receptive field. Top row shows the relationship between the optimal length (A) and width (D) of the stimulus, and contrast sensitivity (C50). Data from cells that showed significant spatial inhibition upon presentation of stimuli up to 30uin length or width are indicated by filled circles (end inhibition in panel A, side inhibition in panel D). The middle row summarizes the data shown in the top row, by grouping neurons according to the preferred length (B) and width (E) in three groups, according to optimal size (,10u, 10–20uand.20u). The data points are medians for these groups, and error bars represent the inter quartile ranges. Bottom row illustrates the mean C50for DM cells. Black bars represent means for EI and SI cells (in C and F, respectively), and white bars represent the means for NEI15and NSI15cells.
size summation properties, and response latency. In both areas, neurons that were more sensitive to lower contrast preferred smaller (primarily, narrower) stimuli, and were more likely to show side inhibition when stimulated with gratings of up to 30u. Additionally we found that, in MT, cells with high contrast sensitivity tended to show shorter response latencies. Finally, shorter-latency cells in MT tended to summate over smaller expanses of visual space (again, primarily along the stimulus width dimension), in comparison with neurons that had longer latencies.
Relationship between Contrast Sensitivity, Latency and Spatial Extent Properties
Unlike earlier studies, we did not measure size summation and inhibition properties at different contrasts for the same cell [1,5]. Rather, we asked whether the size summation properties of different neurons in a population, assessed using stimuli of a same contrast, were related to their contrast sensitivity. In general, our results imply that a proportion of the variance observed in the size-summation and surround inhibition properties of DM and MT cells is related to the variance of contrast sensitivity across the Figure 6. Relationship between contrast sensitivity (half-saturation contrast, C50) and the spatial properties of the receptive fields in area MT.Top row shows the relationship between optimal length (A), width (D) and C50, with filled symbols indicating cells that displayed significant end and side-inhibition (in A and D, respectively) upon presentation of stimuli up to 30uin size. Results from cells tested with ‘‘flashed’’ gratings are indicated by blue triangles, and those from cells tested with ‘‘ramped’’ gratings by red circles. The middle row summarizes the data shown in the top row, by grouping neurons according to the preferred length (B) and width (E), in three groups according to optimal size (,10u, 10– 20uand.20u). The data points are medians for these groups, and error bars represent inter quartile ranges. Bottom row illustrates the mean C50for cells in MT, grouped according to their method of presentation and spatial inhibition properties along the length (C) and width (F) dimensions of the receptive field.
population. These relationships were relatively modest, accounting for less than 15% of the total variance, suggesting other factors are also involved in shaping receptive fields. However, these co-variations provide insights into additional mechanism that can be incorporated into current models of cortical population responses, as discussed below.
We also found in MT cells that were sensitive to lower contrasts also responded with shorter latencies. This result is in agreement with many previous reports spaning several visual areas of the brain [8,9,10,12,45]; in fact, this effect becomes even stronger in higher-order association cortices [48]. Predictably, given the relationship between contrast sensitivity and size summation, a corresponding relationship between latency and size summation was also found: MT cells that preferred smaller gratings had shorter latencies.
A previous investigation of the relationship between a number of stimulus parameters and latency in MT found that cells which show obvious spatial inhibition have longer latencies [45], the opposite of what we observed. However, the same study also found this relationship can be attributed to a large extent to covariation with response strength. While some effects of response strength were evident, our data suggest that the relationships between contrast sensitivity, latency and size summation cannot be explained solely on the basis of a covariation (Figs. 9 and 10). The difference between our results in area MT and those of Raiguel et al. [45] can be directly attributed to the type of stimuli used: while we used near-optimal sine-wave gratings, the previous study employed fields of random dots, with distinct discontinuities in luminance which contained multiple spatial frequencies. Interestingly, they also found that the relationship between latency and response strength depended on the type of stimuli used, and others have also found differences in MT receptive field properties when using stimuli of single and multiple spatial frequencies [49]. Altogether, these observations suggest that a model based solely on ‘‘feedforward’’ connections cannot account for the results.
Neural Mechanisms
Our initial hypotheses were based on a hierarchical model, whereby larger receptive fields would require convergence of information from larger pools of ‘‘feedforward’’ afferent neurons. Given that anatomical studies suggest that areas DM and MT occupy the third hierarchical processing level in the marmoset visual cortex [22,26], the initial computations by neurons within these areas are presumably dependent on information sent by V1 and V2 cells, while further processing is likely to be based on intrinsic connections, or feedback from other extrastriate areas [50]. Some aspects of the present data seem to conform to these expectations. For example, in MT cells showing larger receptive fields had longer response latencies, and higher C50 values. Conceptually, these observations parallel differences observed between the granular and supragranular layers of V1, or between V1 and V2 [46,51,52,53]. However, our data suggest that these relationships are based on mechanisms that are more specific than simple hierarchical convergence. First, they indicate that the interdependencies between latency and contrast sensitivity on receptive field size are more evident with respect to variations in the receptive field width, rather than receptive field length. Thus, there is an anisotropy in the cellular interactions that give rise to these effects. Second, they show that the type of size selectivity that underlies our data originates, in part, from inhibitory interactions: cells showing side-inhibition to stimulation of regions up to 15uon either side of the receptive field centre were more likely to respond at shorter latencies, and to have low C50values. Both of these new observations need to be incorporated in models of the circuitry of visual cortex aimed at describing population responses to complex visual stimulation.
Previous work has demonstrated that probing the responses of a same neuron with stimuli of increasingly higher contrasts reveals progressively smaller summation areas, and greater surround inhibition. This led to the hypothesis that, within the neural population of a given area, cells that were more sensitive to contrast would tend to reach peak responses upon presentation of relatively small stimuli. A relationship between different spatial summation and contrast sensitivity properties was reflected in our data, albeit, perhaps surprisingly, only with respect to the width dimension of the gratings. Our results in this respect are, in principle, compatible with those of Pack et al. [5], who have investigated the analogous relationship in macaque area MT, using circularly symmetrical stimuli. In contrast, a study in area V1 has described that an increase in contrast specifically increased the incidence of end-inhibition, resulting in reduced receptive field sizes along the length dimension [3]. A relationship between optimal length and contrast sensitivity was not reflected in our population data, on extrastriate areas.
Contrast-dependent changes in the spatial structure of receptive fields have been previously reported for neurons in various early stages of visual processing [1,2,3,4,6,12], making it possible that the effects we observed in MT and DM in part reflect computations performed in earlier areas. However, the spatial extent of the inhibitory effects observed among many cells in both MT and DM far exceeds that observed in V1 [54]. It has also been suggested that contrast-dependent modulation of responses in V1 depends in part on feedback from MT [55], making it more likely the current observations are at least partly due to neural mechanics within DM and MT, and perhaps beyond (see [5] for discussion).
Historically, gain normalization (a mechanism whereby the activity of neurons is normalized, or divided, by the activity of a general pool of neurons representing neighbouring receptive fields) has been successful in explaining the non-linear relationship Figure 7. Relationship between contrast sensitivity and latency
in MT. Only data using the ‘‘flashed’’ method of presentation is included here. Arrow indicates mean latency and line indicates the best linear fit.
between neuronal firing rates and stimulus contrast [56]. More recently, the same mechanism has been used to explain complex, non-linear and non-retinotopic spatial summation effects in MT neurons [5,17]. It is possible that spatial summation and contrast sensitivity share the same gain normalization mechanisms in the cortex. As neurons in the normalization pool will respond differently to sine-wave gratings and random dot patters, gain normalization can also explain differences in spatial summation properties between stimuli (our results and those of [45]): the activity of the normalization pool will cause the spatial summation properties to change, thus affecting the activity of the recorded cell, even though feedforward connections remain the same.
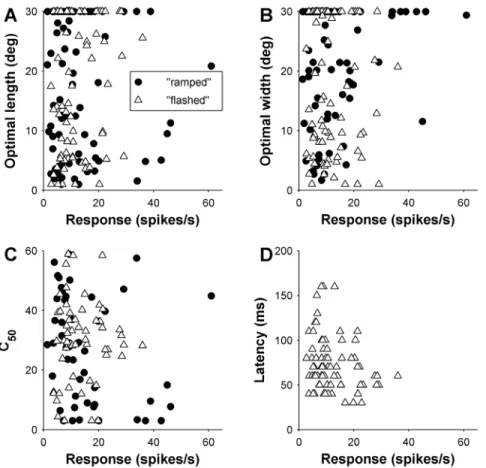
Our observation that the relationship between contrast sensi-tivity and size summation is dependent on receptive field dimension has implications for the likely composition of normal-ization pools. Specifically, the difference between length and width summation properties suggests that the ‘‘shape’’ of the normali-zation pools (i.e., the composition of the neuronal population which, via intrinsic connections, participates in this process) may be more specific than first thought. For example, the rate of which neurons in the pool are recruited is likely to be dependent on the direction of interactions across the topographic maps of DM and MT. The concept of a more specific normalization pool is not new, having been used to explain the network behaviour of Figure 8. Relationship between latency, length (left column) and width (right column) selectivity in area MT.Top row shows the relationship between optimal length (A), width (D) and latency, with filled symbols indicating cells that displayed significant end and side-inhibition (in A and D, respectively) upon presentation of stimuli up to 30uin size. The middle row summarizes the data shown in the top row, by grouping neurons according to the preferred length (B) and width (E), in three groups according to optimal size (,10u, 10–20uand.20u). The data points are medians for these groups, and error bars represent inter quartile ranges. Bottom row illustrates the mean latency for cells in MT, grouped according to spatial inhibition properties along the length (C) and width (F) dimensions of the receptive field. Only data using the ‘‘flashed’’ method of presentation is included here.
neurons in response to the presentation of plaid stimulus. In that case, the range of MT responses were attributed to the contribution of a ‘‘tuned’’ normalization pool consisting of cells that respond well to a particular direction of motion, versus a more generalized ‘‘un-tuned’’, non-specific normalization pool, which encompasses all cells regardless of their direction preference [57]. A similar concept, applied with respect to visual (hence cortical) space, could account for our current observations. Given that cortical areas in which neurons have very different size summation properties (DM and MT) display the same relationship between size selectivity and contrast sensitivity, this may reflects a more general mechanism for motion-sensitive areas (see below).
Comparison between DM and MT
Our data extend earlier reports of functional differences between cells in areas DM and MT, two subdivisions of extrastriate cortex that receive strong inputs that originate from Brodmann’s ‘‘layer 4b’’ of V1 (layer 3c in Hassler’s nomenclature; see [58]). Whereas the V1 input to MT originates almost exclusively from this layer, cells in DM also receive projections from cells located in other subdivisions of supragranular V1 [59]. In addition, while the extrastriate projections to MT reveal a heavy bias in favour of dorsal stream motion-processing areas, the projections to DM reveal a wider variety of influences, including significant projections from ventral stream areas [26]. Our results demonstrate some important functional differences between these areas, but also highlight similarities.
Through systematic tests using identical procedures, we confirmed the suggestion [17] that neurons in these areas are
distinct in terms of selectivity to stimulus size: DM cells tend to summate more extensively along the receptive field length dimension, and tend to show a stronger degree of side-inhibition, while MT cells tend to summate along the receptive field width, and show on average stronger end-inhibition (at least, for stimuli extending up to 15u on either side of the receptive field centre). These findings add to the previously described functional distinctions between these areas, in terms of the relative prevalence of direction and orientation selectivity [25,28]. Nonetheless, the distributions of mid-saturation contrast (C50) revealed no signifi-cant difference between the DM and MT samples. Moreover, in both areas, cells that were highly sensitive to contrast reach maximal responses upon presentation of relatively narrow gratings, whereas a corresponding relationship was not obvious with respect to stimulus length (Figs. 5 and 6).
The distinct size preference of neurons is likely to be related to functionality. Area MT has been described as an integrator and segregator of motion (see [60]). Thus, it is fitting that the optimal stimulus integration window is larger along the axis of motion (grating width), and that this dimension reveals less spatial inhibition, since motion in most naturalistic situations is smooth and continuous [61]. The minority of cells that are inhibited along the axis of motion may serve to code for the beginning or termination of motion, acceleration, or changes of direction or speed. The observed increased contrast sensitivity and shorter latencies for cells that have restricted receptive fields along this dimension may aid in highlighting such discontinuities in motion. Conversely, the more commonly observed cells, which lack obvious inhibition along the axis of motion, will be able to Figure 9. The effects of response strength on preferred size, latency and C50for DM. Top row illustrates the relationship between response and (A) optimal length and (B) optimal width. (C) Illustrates the relationship between response and C50for DM.
capture more motion energy, and may not require as high a level of sensitivity to low contrasts.
Cells in area DM, on the other hand, tend to prefer long contours, with relatively little inhibition along the length of the grating, and the frequent occurrence of facilitation beyond the receptive field. Along with its narrow orientation tuning [28], its receptive fields are well suited to indicating the continuity of borders of larger objects with accuracy. The increased contrast sensitivity of narrow receptive fields, including those with side-inhibition, may serve to enhance the contours of objects. Conversely, the minority of cells that lack side-inhibition may be optimized for integration rather than detection. It is worth noting that, in this area, cells that prefer wider grating also have coarser orientation tuning [28], again pointing to a role in detection and integration across space, rather than fine analysis of borders.
Acknowledgments
We thank Katrina Worthy for the histological work and all administrative tasks that kept the laboratory running smoothly over the period of time that encompassed these experiments. We also thank Janssen-Cilag Pty (Australia) for the donation of sufentanil citrate, which made these experiments possible.
Author Contributions
Conceived and designed the experiments: LL MR. Performed the experiments: LL MR JB. Analyzed the data: LL. Contributed reagents/ materials/analysis tools: LL MR JB. Wrote the paper: MR LL.
References
1. Levitt JB, Lund JS (1997) Contrast dependence of contextual effects in primate visual cortex. Nature 387: 73–76.
2. Sceniak MP, Ringach DL, Hawken MJ, Shapley R (1999) Contrast’s effect on spatial summation by macaque V1 neurons. Nat Neurosci 2: 733–739. 3. Anderson JS, Lampl I, Gillespie DC, Ferster D (2001) Membrane potential and
conductance changes underlying length tuning of cells in cat primary visual cortex. J Neurosci 21: 2104–2112.
4. Cavanaugh JR, Bair W, Movshon JA (2002) Selectivity and spatial distribution of signals from the receptive field surround in macaque V1 neurons. J Neurophysiol 88: 2547–2556.
5. Pack CC, Hunter JN, Born RT (2005) Contrast dependence of suppressive influences in cortical area MT of alert macaque. J Neurophysiol 93: 1809–1815.
6. Solomon SG, White AJ, Martin PR (2002) Extraclassical receptive field properties of parvocellular, magnocellular, and koniocellular cells in the primate lateral geniculate nucleus. J Neurosci 22: 338–349.
7. Tsui JM, Pack CC (2011) Contrast sensitivity of MT receptive field centers and surrounds. J Neurophysiol 106: 1888–1900.
8. Carandini M, Heeger DJ (1994) Summation and division by neurons in primate visual cortex. Science 264: 1333–1336.
9. Carandini M, Heeger DJ, Movshon JA (1997) Linearity and normalization in simple cells of the macaque primary visual cortex. J Neurosci 17: 8621–8644. 10. Lee BB, Elepfandt A, Virsu V (1981) Phase of responses to moving sinusoidal
gratings in cells of cat retina and lateral geniculate nucleus. J Neurophysiol 45: 807–817.
11. Oram MW (2010) Contrast induced changes in response latency depend on stimulus specificity. J Physiol Paris 104: 167–175.
Figure 10. The effects of response strength on preferred size, latency and C50for MT.Top row illustrates the relationship between response and (A) optimal length and (B) optimal width. The method of presentation is identified, see legend in (A). (C) Shows the relationship between response and C50while (D) illustrates the relationship between response and latency for MT.
12. Shapley RM, Victor JD (1978) The effect of contrast on the transfer properties of cat retinal ganglion cells. J Physiol 285: 275–298.
13. DeAngelis GC, Freeman RD, Ohzawa I (1994) Length and width tuning of neurons in the cat’s primary visual cortex. J Neurophysiol 71: 347–374. 14. Edwards DP, Purpura KP, Kaplan E (1995) Contrast sensitivity and spatial
frequency response of primate cortical neurons in and around the cytochrome oxidase blobs. Vision Res 35: 1501–1523.
15. Hawken MJ, Parker AJ (1984) Contrast sensitivity and orientation selectivity in lamina IV of the striate cortex of Old World monkeys. Exp Brain Res 54: 367– 372.
16. Hubel DH, Wiesel TN (1968) Receptive fields and functional architecture of monkey striate cortex. J Physiol 195: 215–243.
17. Lui LL, Bourne JA, Rosa MG (2007) Spatial summation, end inhibition and side inhibition in the middle temporal visual area (MT). J Neurophysiol 97: 1135– 1148.
18. Yang Y, Liang Z, Li G, Wang Y, Zhou Y, et al. (2008) Aging affects contrast response functions and adaptation of middle temporal visual area neurons in rhesus monkeys. Neuroscience 156: 748–757.
19. Albright TD (1984) Direction and orientation selectivity of neurons in visual area MT of the macaque. J Neurophysiol 52: 1106–1130.
20. Maunsell JH, Van Essen DC (1983) Functional properties of neurons in middle temporal visual area of the macaque monkey. I. Selectivity for stimulus direction, speed, and orientation. J Neurophysiol 49: 1127–1147.
21. Raiguel S, Van Hulle MM, Xiao DK, Marcar VL, Orban GA (1995) Shape and spatial distribution of receptive fields and antagonistic motion surrounds in the middle temporal area (V5) of the macaque. Eur J Neurosci 7: 2064–2082. 22. Palmer SM, Rosa MG (2006) Quantitative analysis of the corticocortical
projections to the middle temporal area in the marmoset monkey: evolutionary and functional implications. Cereb Cortex 16: 1361–1375.
23. Rosa MG, Elston GN (1998) Visuotopic organisation and neuronal response selectivity for direction of motion in visual areas of the caudal temporal lobe of the marmoset monkey (Callithrix jacchus): middle temporal area, middle temporal crescent, and surrounding cortex. J Comp Neurol 393: 505–527. 24. Rosa MG, Schmid LM (1995) Visual areas in the dorsal and medial extrastriate
cortices of the marmoset. J Comp Neurol 359: 272–299.
25. Baker JF, Petersen SE, Newsome WT, Allman JM (1981) Visual response properties of neurons in four extrastriate visual areas of the owl monkey (Aotus trivirgatus): a quantitative comparison of medial, dorsomedial, dorsolateral, and middle temporal areas. J Neurophysiol 45: 397–416.
26. Rosa MG, Palmer SM, Gamberini M, Burman KJ, Yu HH, et al. (2009) Connections of the dorsomedial visual area: pathways for early integration of dorsal and ventral streams in extrastriate cortex. J Neurosci 29: 4548–4563. 27. Rosa MG, Tweedale R (2001) The dorsomedial visual areas in New World and
Old World monkeys: homology and function. Eur J Neurosci 13: 421–427. 28. Lui LL, Bourne JA, Rosa MG (2006) Functional response properties of neurons
in the dorsomedial visual area of New World monkeys (Callithrix jacchus). Cereb Cortex 16: 162–177.
29. Bourne JA, Lui L, Tweedale R, Rosa MG (2004) First- and second-order stimulus length selectivity in New World monkey striate cortex. Eur J Neurosci 19: 169–180.
30. Bourne JA, Tweedale R, Rosa MG (2002) Physiological responses of New World monkey V1 neurons to stimuli defined by coherent motion. Cereb Cortex 12: 1132–1145.
31. Lui LL, Bourne JA, Rosa MG (2005) Single-unit responses to kinetic stimuli in New World monkey area V2: physiological characteristics of cue-invariant neurones. Exp Brain Res 162: 100–108.
32. Lui LL, Bourne JA, Rosa MG (2007) Spatial and temporal frequency selectivity of neurons in the middle temporal visual area of new world monkeys (Callithrix jacchus). Eur J Neurosci 25: 1780–1792.
33. Lui LL, Dobiecki AE, Bourne JA, Rosa MG (2012) Breaking camouflage: responses of neurons in the middle temporal area to stimuli defined by coherent motion. Eur J Neurosci 36: 2063–2076.
34. Bourne JA, Rosa MG (2003) Preparation for the in vivo recording of neuronal responses in the visual cortex of anaesthetised marmosets (Callithrix jacchus). Brain Res Brain Res Protoc 11: 168–177.
35. Rosa MG, Tweedale R, Elston GN (2000) Visual responses of neurons in the middle temporal area of new world monkeys after lesions of striate cortex. J Neurosci 20: 5552–5563.
36. Rosa MG, Angelucci A, Jeffs J, Pettigrew JD (2013) The case for a dorsomedial area in the primate ‘third-tier’ visual cortex. Proc Biol Sci 280: 20121372; discussion 20121994.
37. Allman JM, Kaas JH (1975) The dorsomedial cortical visual area: a third tier area in the occipital lobe of the owl monkey (Aotus trivirgatus). Brain Res 100: 473–487.
38. Rosa MG, Palmer SM, Gamberini M, Tweedale R, Pinon MC, et al. (2005) Resolving the organization of the New World monkey third visual complex: the dorsal extrastriate cortex of the marmoset (Callithrix jacchus). J Comp Neurol 483: 164–191.
39. Gallyas F (1979) Silver staining of myelin by means of physical development. Neurol Res 1: 203–209.
40. Born RT (2000) Center-surround interactions in the middle temporal visual area of the owl monkey. J Neurophysiol 84: 2658–2669.
41. Yu HH, Rosa MG (2010) A simple method for creating wide-field visual stimulus for electrophysiology: mapping and analyzing receptive fields using a hemispheric display. J Vis 10: 15.
42. Albrecht DG, Farrar SB, Hamilton DB (1984) Spatial contrast adaptation characteristics of neurones recorded in the cat’s visual cortex. J Physiol 347: 713–739.
43. Albrecht DG, Hamilton DB (1982) Striate cortex of monkey and cat: contrast response function. J Neurophysiol 48: 217–237.
44. Tolhurst DJ, Heeger DJ (1997) Comparison of contrast-normalization and threshold models of the responses of simple cells in cat striate cortex. Vis Neurosci 14: 293–309.
45. Raiguel SE, Xiao DK, Marcar VL, Orban GA (1999) Response latency of macaque area MT/V5 neurons and its relationship to stimulus parameters. J Neurophysiol 82: 1944–1956.
46. Schmolesky MT, Wang Y, Hanes DP, Thompson KG, Leutgeb S, et al. (1998) Signal timing across the macaque visual system. J Neurophysiol 79: 3272–3278. 47. Bullier J, Henry GH (1980) Ordinal position and afferent input of neurons in
monkey striate cortex. J Comp Neurol 193: 913–935.
48. Oram MW, Xiao D, Dritschel B, Payne KR (2002) The temporal resolution of neural codes: does response latency have a unique role? Philos Trans R Soc Lond B Biol Sci 357: 987–1001.
49. Priebe NJ, Cassanello CR, Lisberger SG (2003) The neural representation of speed in macaque area MT/V5. J Neurosci 23: 5650–5661.
50. Shushruth S, Ichida JM, Levitt JB, Angelucci A (2009) Comparison of spatial summation properties of neurons in macaque V1 and V2. J Neurophysiol 102: 2069–2083.
51. O’Keefe LP, Levitt JB, Kiper DC, Shapley RM, Movshon JA (1998) Functional organization of owl monkey lateral geniculate nucleus and visual cortex. J Neurophysiol 80: 594–609.
52. Tootell RB, Hamilton SL, Switkes E (1988) Functional anatomy of macaque striate cortex. IV. Contrast and magno-parvo streams. J Neurosci 8: 1594–1609. 53. Zheng J, Zhang B, Bi H, Maruko I, Watanabe I, et al. (2007) Development of temporal response properties and contrast sensitivity of V1 and V2 neurons in macaque monkeys. J Neurophysiol 97: 3905–3916.
54. Angelucci A, Levitt JB, Walton EJ, Hupe JM, Bullier J, et al. (2002) Circuits for local and global signal integration in primary visual cortex. J Neurosci 22: 8633– 8646.
55. Hupe JM, James AC, Payne BR, Lomber SG, Girard P, et al. (1998) Cortical feedback improves discrimination between figure and background by V1, V2 and V3 neurons. Nature 394: 784–787.
56. Heeger DJ (1992) Normalization of cell responses in cat striate cortex. Vis Neurosci 9: 181–197.
57. Rust NC, Mante V, Simoncelli EP, Movshon JA (2006) How MT cells analyze the motion of visual patterns. Nat Neurosci 9: 1421–1431.
58. Elston GN, Rosa MG (1997) The occipitoparietal pathway of the macaque monkey: comparison of pyramidal cell morphology in layer III of functionally related cortical visual areas. Cereb Cortex 7: 432–452.
59. vogt Weisenhorn DM, Illing RB, Spatz WB (1995) Morphology and connections of neurons in area 17 projecting to the extrastriate areas MT and 19DM and to the superior colliculus in the monkey Callithrix jacchus. J Comp Neurol 362: 233–255.
60. Born RT, Bradley DC (2005) Structure and function of visual area MT. Annu Rev Neurosci 28: 157–189.