www.hydrol-earth-syst-sci.net/16/3551/2012/ doi:10.5194/hess-16-3551-2012
© Author(s) 2012. CC Attribution 3.0 License.
Earth System
Sciences
Trends in rainfall erosivity in NE Spain at annual, seasonal
and daily scales, 1955–2006
M. Angulo-Mart´ınez and S. Beguer´ıa
Department of Soil and Water, Estaci´on Experimental de Aula Dei-Consejo Superior
de Investigaciones Cient´ıficas (EEAD–CSIC), 1005 Avda. Monta˜nana, 50080, Zaragoza, Spain
Correspondence to: S. Beguer´ıa (santiago.begueria@csic.es)
Received: 19 April 2012 – Published in Hydrol. Earth Syst. Sci. Discuss.: 16 May 2012 Revised: 3 September 2012 – Accepted: 15 September 2012 – Published: 10 October 2012
Abstract. Rainfall erosivity refers to the ability of precipita-tion to erode soil, and depends on characteristics such as its total volume, duration, and intensity and amount of energy released by raindrops. Despite the relevance of rainfall ero-sivity for soil degradation prevention, very few studies have addressed its spatial and temporal variability. In this study the time variation of rainfall erosivity in the Ebro Valley (NE Spain) is assessed for the period 1955–2006. The results show a general decrease in annual and seasonal rainfall ero-sivity, which is explained by a decrease of very intense rain-fall events whilst the frequency of moderate and low events increased. This trend is related to prevailing positive condi-tions of the main atmospheric teleconnection indices affect-ing the West Mediterranean, i.e. the North Atlantic Oscil-lation (NAO), the Mediterranean OscilOscil-lation (MO) and the Western Mediterranean Oscillation (WeMO).
1 Introduction
Rainfall erosivity can be defined as the potential of a rainfall event to erode soil, and is a consequence of the interaction of several precipitation characteristics at the event scale. Rain-fall erosivity models take into account the continuous and discrete characters of precipitation by considering precipi-tation amounts and intensities together with the energy re-leased by raindrops when they hit the soil surface. Individual raindrop impacts are able to detach the soil aggregates and strike them up into the air as rain splash, preparing them for being transported by sheet wash or other processes and caus-ing a diffusive displacement of particles down the slope if the topography is not perfectly flat. Rain splash is also able to
disrupt the soil aggregates, and the redistribution of soil par-ticles blocks the soil pores, causing crusting and reduced in-filtration. Infiltration, saturation and excessive overland flow may occur as a consequence of the amount and intensity of precipitation over short time periods, causing sheet and con-centrated flow with high potential for detaching and trans-porting soil particles.
The study of rainfall erosivity is thus highly relevant for soil degradation mitigation. Despite its applied relevance, the climatology of rainfall erosivity (i.e. its interannual and seasonal variation, spatial patterns, etc.) is surprisingly the topic of very few studies. In the context of climate change, a relevant question is whether or not long-term trends can be detected over the last decades that may help confirm the projections made by global climate models. The Mediter-ranean basin is one of the areas of the world where current climate projections suggest the highest changes in precipita-tion (Sauerborn et al., 1999; Kendon et al., 2010; Beaulant et al., 2011; Tramblay et al., 2012). It is expected that the an-nual precipitation will decrease in the Mediterranean, while higher amounts of erosive rainfall can also be expected as a consequence of changes in precipitation variability and pre-cipitation extremes.
patterns affecting precipitation over the IP, such as the North Atlantic Oscillation (NAO), the Mediterranean Oscillation (MO) and the Western Mediterranean Oscillation (WEMO). Very few studies have analyzed trends in rainfall erosiv-ity. Meusburgeret al. (2012) analyzed the spatio–temporal variability of rainfall erosivity in Switzerland and found an increasing trend from May to October. Focusing on the Mediterranean side of the IP, de Luis et al. (2010a) found an overall decrease in annual rainfall and increases in rainfall concentration, while changes in rainfall erosivity varied in space. Their analysis was based on the Modified Fournier In-dex (MFI, Arnoldus, 1977) with monthly precipitation data. This is an important concern, since rainfall erosivity de-pends largely on a few number of short but very intense rain episodes that are largely smoothed when data is aggregated at coarser time resolutions.
The USLE/RUSLE R factor (Wischmeier, 1959; Wis-chmeier and Smith, 1978; Brown and Foster, 1987; Renard et al., 1997) is probably the most widely used rainfall ero-sivity index. It is defined as the mean value of the annual cumulative EI30 index. TheEI30index (MJ mm ha−1h−1)is obtained for each rainfall event as the product of the kinetic energy of the rain (E)and the maximum intensity recorded in 30 min. Its calculation requires high frequency rainfall data – typically one data every 15 min or less – or pluvio-graph records. In addition, reliable values of theRfactor can only be obtained from long data series spanning over several decades. Such conditions are very often not met, so a number of studies have been devoted to estimating rainfall erosiv-ity from coarser data such as highly available daily rainfall time series (Richardson et al., 1983; Bagarello and D’Asaro, 1994; Petkovsek and Mikos, 2004; Angulo-Mart´ınez and Be-guer´ıa, 2009; Meusburger et al., 2012). Such relationships allow undertaking climatological studies of rainfall erosivity with dense and long datasets. In this article we use an estima-tion of the EI30 index based on daily rainfall intensities for assessing the temporal variation of rainfall erosivity in the NE quadrant of the IP at the annual, monthly and daily time scales.
2 Study area and methods
2.1 Study area
The study area is located at NE of Spain, with an area of about 85 000 km2that corresponds to the Ebro River basin (Fig. 1). The area limits to the north with the Cantabric Sea (Atlantic Ocean), the Cantabrian Range and the Pyre-nees. Maximum elevations are above 3000 m a.s.l. At the S and SW the Iberian Range closes the Ebro basin, with max-imum elevations in the range of 2000–2300 m a.s.l. Cata-lan Prelitoral Range, with maximum elevations of 1000– 1900 m a.s.l., limits the valley to the E, and then continues to the Mediterranean Sea. It is a topographical complex area
Fig. 1. Digital Terrain Model of the study area showing the spatial
distribution of the rainfall gauges used in the study (UTM coordi-nates).PAEMETindicates daily rainfall data series for period 1955– 2006 provided by the Spanish Meteorological Agency.PSAIH in-dicates the 15’ rainfall data series for period 1997–2006 provided by the Automatic Hydrologic Information System of the Ebro river basin.
where mountain areas represent approximately 20 % of the study area.
Climate is influenced by the Atlantic Ocean and the Mediterranean Sea, determining a NW–SE climatic gradient. The central area has continental climate with semi-arid con-ditions as a consequence of the isolation from the oceanic influence due to topographical shading (Lana and Burgue˜no, 1998). Precipitation is characterized by alternating wet and dry periods as a consequence of the seasonal displacement of the polar front and its associated pressure systems. Drought situations can be followed by torrential rainfall events. Pre-cipitation variability is the main characteristic, inter and in-tra annually. These properties increase towards the SE and in the center. The most extreme precipitation events are usu-ally recorded along the Mediterranean seaside (Romero et al., 1998; Pe˜narrocha et al., 2002).
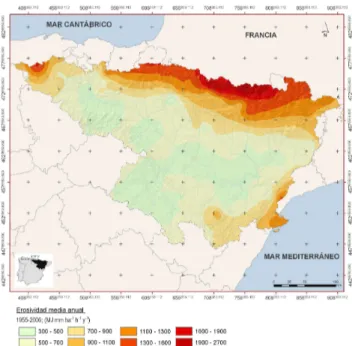
Fig. 2. Mean annual rainfall erosivity during the period 1955–2006
(MJ mm ha−1h−1yr−1).
The main land use in terms of surface is agriculture (rep-resenting approximately 46 % of the area). It is extended around the Ebro Valley occupying a broader area close to the Mediterranean coast. Traditionally, agricultural soils remain uncovered in most cases during autumn and early winter, and as a consequence rainfall erosivity is the main cause of soil erosion during that period.
2.2 Daily rainfall erosivity database
For this study two databases were used (Fig. 1): (i) 110 rain-fall series from the Ebro river basin authority’s hydrologic information system (SAIH Ebro), with a time resolution of 15 min since 1997 (PSAIH); and (ii) 156 daily rainfall se-ries from the Spanish meteorological agency (AEMET) with daily (06:00 to 06:00 h) precipitation amounts for the pe-riod 1955–2006 (PAEMET). Precipitation time series were pre-processed with techniques that included reconstruction, gap filling, quality control and homogeneity testing (Vicente-Serrano et al., 2009a). The SAIH dataset had the adequate time resolution for computing rainfall erosivity, but only cov-ered eleven years. The AEMET dataset had the adequate length for undertaking climatological studies, but its coarser time resolution did not allow direct computation of the EI30 index. Therefore, we used a statistical procedure between the two datasets for obtaining series of daily rainfall erosivity for the period 1955–2006. The process is explained at length in Angulo-Mart´ınez and Beguer´ıa (2009), and a summary is provided as Supplement.
Additionally, time series of three widely known telecon-nection indices (the North Atlantic Oscillation, NAO; the
Mediterranean Oscillation, MO; and the West Mediterranean Oscialltion, WEMO) were used in order to explore atmo-spheric explanations for the time evolution of rainfall ero-sivity. A detailed explanation of the elaboration of these time series is provided in Angulo-Mart´ınez and Beguer´ıa (2012).
2.3 Trend analysis
Annual and seasonal time series were obtained by adding the daily erosivity values at the appropriate aggregation pe-riods. Natural years (from 1 January to 31 December) were used for the annual series, and the usual convention (win-ter = December to February, spring = March to May, sum-mer = June to August, autumn = September to November) was used for the seasonal series. In addition, time series of the number of daily erosivity events within the limits of the quintiles of each series (Q1 = below the 20th percentile, Q2 = between the 20th and 40th percentile, Q3 = between the 40th and 60th percentile, Q4 = between the 60th and 80th per-centile, Q5 = above the 80th percentile) were computed and aggregated at the annual and seasonal time scales.
The Mann-Kendall test for monotonic trends was used for identifying time trends on those series (Mann, 1945). A block bootstrap procedure was used for obtaining improved sig-nificance test when working with time series data (K¨unsch, 1989). The functions tsboot from the R boot library and MannKendall from theR Kendall library were used to per-form the analyses. Maps showing the location of the signifi-cant series were then produced to help identify possible spa-tial patterns.
The per-decade change of the annual and seasonal erosiv-ity and the number of events in the first (Q1) and fifth (Q5) quintiles was also represented in the maps to help visual-ize the sign and magnitude of erosivity trends. Per-decade change was estimated for each series by means of ordinary least squares (OLS) regression upon time, and surface maps were generated by means of local first grade polynomial interpolation.
Relationships between time variation of rainfall erosivity and the three teleconnection indices (NAO, MO and WEMO) were explored by means of the Pearson’s correlation test. The number of significantly correlated series was computed for the annual and seasonal erosivity series and for the number of events in the first and fifth quintile. Significance was evalu-ated atα=0.05 confidence level, so on average a number of
n=7.8 false positives could be expected from the 156 time series sample.
3 Results
3.1 Annual and seasonal rainfall erosivity
Fig. 3. Per decade change of annual rainfall erosivity during the
period 1955–2006 (MJ mm ha−1h−1y−1). Black circles indicate data series for which the trend was significant at theα=0.05 con-fidence level.
Fig. 4. Per decade change of seasonal rainfall erosivity during the
period 1955–2006 (MJ mm ha−1h−1y−1): (a) DJF, (b) MAM, (c) JJA, (d) SON. Black circles indicate data series for which the trend was significant at theα=0.05 confidence level.
in the NE of the study area (eastern Pyrenees), but in most of the area it was lower than 30 MJ mm ha−1h−1yr−1 per
decade. When compared to the mean annual rainfall erosivity (Fig. 2), the highest relative changes occurred at the NE of the study area were they represented 60–80 % of the average over the whole study period (five decades).
Spatial differences were most noticeable when analysed at a seasonal basis (Fig. 4). While in winter and spring trends were negative in most of the study area, with the most neg-ative trends in the NE corner, in summer and autumn there were larger spatial differences. Summer yielded the most heterogeneous results, since in some interior areas slightly
Table 1. Number and proportion of series with significant trends,
significance levelα=0.05.
Time No positive No negative period trends (%) trends (%)
Annual 1 (0.6 %) 23 (14.7 %) Spring 1 (0.6 %) 8 (5.1 %)
Summer 0 9 (5.8 %)
Autumn 1 (0.6 %) 3(1.9 %)
Winter 0 25 (16.0 %)
positive trends were registered, while the NE quadrant and some smaller areas in the N and NW experienced strong neg-ative trends. In autumn negneg-ative trends predominated overall and were especially strong in the SE and NW corners, but positive trends were also found in the N along the Pyrenean range. Although negative trends predominated overall at both annual and seasonal basis, these results should be taken with care since significance was achieved only in a small fraction of the stations (Table 1).
3.2 Daily rainfall erosivity
Variation in the number of daily events grouped by quin-tiles allowed assessing trends in the occurrence of rainfall erosivity events across the range of erosivity values (Fig. 5). Since the range of the quintiles were calculated considering the whole study period (1955–2006), negative values indicate a diminishing number of events, while positive values indi-cate an increasing number of events. The results show that the number of very low and low erosivity events (Q1, below 20 %, and Q2, between 20 and 40 %) increased in a large number of stations, while the number of medium, high and very high erosivity events (Q3 to Q5) decreased. Spatially, the number of events in the first quintile increased between one and four events per year in most of the study area, and only in the NE corner (eastern Pyrenees) was a negative trend found (Fig. 6). Trends were significant in the majority of sta-tions (55.8 %). The number of events in the fifth quintile, on the other hand, decreased between 0.25 and one event per year, with significant trends in 21.8 % of the stations.
The same pattern (increasing number of Q1 events and de-creasing number of Q5 events) was found at the seasonal ba-sis (Figs. 7 and 8), with a few exceptions: (i) the number of Q1 events decreased in winter in the NE corner; and (ii) the number of Q5 events increased in autumn in a small area in the central and western Pyrenees at the N of the study area. The number and proportion of stations with significant trends are shown in Tables 2 and 3.
3.3 Teleconnection patterns
Fig. 5. Boxplots of trends with the number of daily rainfall erosivity
events classified by quintiles of daily erosivity over the whole period 1955–2006.
Table 2. Number and proportion of series with trends in the number
of events in the first quintile (Q1), significance levelα=0.05.
Time No positive No negative period trends (%) trends (%)
Annual 72 (46.2 %) 15 (9.6 %) Spring 59 (37.8 %) 11 (7.1 %) Summer 54 (34.6 %) 11 (7.1 %) Autumn 81 (51.9 %) 7 (4.5 %) Winter 54 (34.6 %) 15 (9.6 %)
values is clear in the case of the NAO and the MO. Correla-tions between the time evolution of rainfall erosivity and the teleconnections (Table 4) revealed a high influence of NAO on winter erosivity (43 % of the series positively correlated) and autumn (31 %), while WEMO and MO had lower influ-ence. With respect to the number of events in the two extreme quintiles, NAO was again the teleconnection with the high-est impact, most especially on the evolution of Q5 in winter (44 % of positively correlated series).
4 Discussion
Planning of soil conservation measurements, especially con-cerning agriculture, requires a good knowledge of all fac-tors affecting soil erosion. Among them, rainfall erosivity is one of the least studied, although its spatial and tempo-ral dynamics can be of paramount importance when they are related to other factors such as land use and cropping prac-tices. The development of long time series of daily rainfall
Fig. 6. Per decade change in the number of daily rainfall erosivity
events corresponding to (a) the first (Q1) and (b) fifth (Q5) quintiles at the annual scale for the period 1955–2006. Black circles indicate significant trends at theα=0.05 confidence level.
Fig. 7. Per decade change in the number of daily rainfall erosivity
Fig. 8. Per decade change in the number of daily rainfall erosivity
events corresponding to the fifth (Q5) quintile at the seasonal scale for the period 1955–2006: (a) DJF, (b) MAM, (c) JJA, (d) SON. Black circles indicate significant trends at theα=0.05 confidence level.
Fig. 9. Temporal evolution of October to March NAO, WeMO and
MO indices obtained from average daily indices (thin black line) and 5-yr running average (thick grey line).
erosivity, even subject to uncertainty, can be of great value in assessing the spatial and temporal dynamics of rainfall ero-sivity. Compared to these, data at coarser temporal resolution such as monthly precipitation may miss the importance of a few, very intense events that account for a large fraction of the annual or seasonal rainfall erosivity amounts. Our results show decreasing rainfall erosivities at the annual and sea-sonal scales over most of the area. This could be explained in part by negative trends in total precipitation amounts over the IP, especially during the wet season from October to May (Rodr´ıguez-Puebla et al., 1998; Esteban-Parra et al., 1998; Paredes et al., 2006; L´opez-Bustins et al., 2008; Gonz´alez-Hidalgo et al., 2009, 2010; Rodrigo, 2010; L´opez-Moreno et al., 2010). However, deeper inspection revealed that this trend in the annual erosivity was related to changes in the
Table 3. Number and proportion of series with trends in the number
of events in the fifth quintile (Q5), significance levelα=0.05.
Time No positive No negative period trends (%) trends (%)
Annual 0 34 (21.8 %)
Spring 1 (0.6 %) 6 (3.9 %)
Summer 0 23 (14.7 %)
Autumn 1(0.6 %) 9 (5.8 %)
Winter 0 28 (21.8 %)
frequency distribution of erosivity events, since the number of events of low erosivity increased while the number of highly erosive events decreased. Due to the exponential dis-tribution of rainfall erosivity, the higher events account for a large part of the total cumulative erosivity, so even a small reduction in the frequency of high events is able to produce a large reduction of the annual or seasonal erosivity. These results are in agreement with previous studies. In their analy-sis of daily precipitation in the NE of Iberia, L´opez-Moreno et al. (2010) found decreasing trends in the number of heavy precipitation events and in the relative contribution of heavy events to the annual rainfall, while the number and relative importance of light and moderate events increased. Similarly, Mart´ınez et al. (2007) described increasing contribution of light and moderate events to total precipitation amounts, and Rodrigo and Trigo (2007) found global decrease in precipi-tation intensity over the IP. Recent results based on the non-stationary peaks-over-threshold approach to extreme events analysis found evidences of decreasing frequency and mag-nitude of extreme rainfall events over most of the IP and in particular in its NE quadrant (Beguer´ıa et al., 2011; Acero et al., 2012).
Based on monthly precipitation data covering the Mediter-ranean basins of the IP, de Luis et al. (2010a) reported a gen-eralized decrease of the Modified Fourier Index (MFI). In the Ebro basin, coinciding with the study area of this study, they found that decreasing trends of the MFI predominated in general, except at the N of the study area (Pyrenees). They did not perform seasonal analysis, but in another study the same authors found that annual and monthly precipitation generally decreased in the Ebro basin, except in February and October when a slightly increase was found along the Pyrenees (Gonz´alez-Hidalgo et al., 2009, 2010; de Luis et al., 2010b). This coincides with our findings, since the fre-quency of high erosivity events (Q5) only increased in au-tumn in the Pyrenees.
Table 4. Number of significant correlations between atmospheric circulation indices and rainfall erosivity (Pearson’s correlation test,
signif-icance levelα=0.05).
Annual DJF MAM JJA SON
Erosivity (EI)
NAOi 13 (8.3 %) 67 (43 %) 0 6 (3.9 %) 49 (31.4 %) WEMOi 8 (5.1 %) 20 (12.8 %) 3 (1.9 %) 1 (0.6 %) 10 (6.4 %) MOi 13 (8.3 %) 7 (4.5 %) 2 (1.9 %) 27 (17.3 %) 8 (5.1 %)
No. of daily erosivity events in the first quintile (Q1)
NAOi 18 (11.5 %) 23 (14.7 %) 17 (11 %) 11 (7.1 %) 25 (16 %) WEMOi 10 (6.4 %) 12 (8 %) 10 (6.4 %) 8 (5.1 %) 11 (7.1 %) MOi 16 (12.2 %) 9 (5.8 %) 7 (4.5 %) 28 (18 %) 3 (1.9 %)
No. of daily erosivity events in the fifth quintile (Q5)
NAOi 2 (1.9 %) 68 (44 %) 2 (1.9 %) 3 (1.9 %) 39 (25 %) WEMOi 19 (12.2 %) 20 (12.8 %) 3 (1.9 %) 4 (2.6 %) 11 (7.1 %) MOi 20 (12.8 %) 15 (9.6 %) 4 (2.6 %) 29 (18.6 %) 3 (1.9 %)
the negative trend in intense precipitation observed in the in-strumental records. As other authors have pointed out, strong precipitation events in the study area are significantly related to negative phases of the NAO, MO and WEMO (Gonz´alez-Hidalgo et al., 2009). The generalized decreasing precipita-tion along the Mediterranean basin of the IP has been related to prevailing positive conditions of NAO and MO. Angulo-Mart´ınez and Beguer´ıa (2012) found a significant relation-ship between rainfall erosivity and these indices, which was largest for MO and WEMO. These authors related the posi-tive trend of these indices with the observed reduction in the occurrence of extreme rainfall events. Similar results were obtained by Vicente-Serrano et al. (2009b) with respect to ex-treme precipitation in NE Spain. Here we found that a high number of rainfall erosivity series were correlated with the NAO, most notably in winter and autumn, and that the re-duction in the number of erosivity events in the fifth quintile was also related to the time evolution of the NAO.
5 Conclusions
Analysis of the temporal evolution of rainfall erosivity revealed generalized decreasingtrends at the annual and monthly scales during the period 1955–2006. This coincided with a decrease in the number of highly erosive events and with increasing number of low erosivity events at the daily scale. Negative trends were also found by other authors an-alyzing extreme precipitation on the Iberian Peninsula, con-trasting with broader studies indicating positive trends in ex-treme precipitation at the global and regional (Mediterranean basin) scales. In the context of the Iberian Peninsula, nega-tive trends can be explained by a relanega-tive displacement of the polar fronts northwards, revealed by the intensification (positive trend) of the North Atlantic Oscillation and the
Mediterranean Oscillation. As it has been pointed out by sev-eral authors before, positive NAO and MO are related with a fewer number (and with lower magnitude) of rainfall events in the region.
This study reveals that rainfall erosivity is characterized by complex patterns in time and space, but their study can be undertaken based on relatively common data (longtime series of daily precipitation and shorter time series of high frequency precipitation). This encourages the climatological study of this rainfall property, given the implications for soil erosion and the hydrological behavior on natural and man-aged landscapes.
Supplementary material related to this article is
available online at: http://www.hydrol-earth-syst-sci.net/ 16/3551/2012/hess-16-3551-2012-supplement.pdf.
Acknowledgements. We want to express our gratitude to the Spanish Meteorological Agency (Agencia Espa˜nola de Me-teorolog´ıa, AEMET) and the Ebro Basin Water Authority (Confederaci´onHidrogr´afica del Ebro, CHE) for providing the data used in this study. We also thank two anonymous reviewers for a fruitful discussion that led to improving the original manuscript. This work has been supported by research projects CGL2011-24185 financed by the Spanish Ministry of Science and Innovation (CICYT) and the European Regional Development Fund (ERDF-FEDER), 2010CZ0021 financed by the Spanish National Research Council (Consejo Superior de Investigaciones Cient´ıficas-CSIC) and the Czech Academy of Sciences, and “Grupo de Investigaci´on E68: Geomorfolog´ıa y Cambio Global” financed by the Arag´on Government and the European Social Fund (ESF-FSE). Research of M. A.-M. was supported by a JAE-Predoc grant from the Spanish National Research Council (Consejo Superior de Investigaciones Cient´ıficas-CSIC).
References
Acero, J. L., Garc´ıa, J. A., and Gallego, M. C.: Peaks-over-Threshold Study of Trends in Extreme Rainfall over the Iberian Peninsula, J. Climate, 24, 1089–1105, 2012.
Angulo-Mart´ınez, M. and Beguer´ıa, S.: Estimating rainfall erosivity from daily rainfall records: A comparison among methods using data from the Ebro Basin (NE Spain), J. Hydrol., 379, 111–121, 2009.
Angulo-Mart´ınez, M. and Beguer´ıa, S.: Evaluation of the Relation-ship Between the NAO and Rainfall Erosivity in NE Spain Dur-ing the Period 1955–2006, Adv. Global Change Res., 46, 183– 197, 2011.
Angulo-Mart´ınez, M. and Beguer´ıa, S.: Do atmospheric teleconnec-tion patterns influence rainfall erosivity? A comparison between NAO, MO and WEMO in NE Spain, 1955–2006, J. Hydrol., 450–451, 168–179, doi:10.1016/j.jhydrol.2012.04.063, 2012. Arnoldus, H. M. J.: Methodology used to determine the maximum
potential average annual soil loss due to sheet and rill erosion in Morocco, FAO Soils Bull., 34, 39–51, 1977.
Bagarello, V. and D’Asaro, F.: Estimating single storm erosion in-dex, T. ASAE, 37, 785–791, 1994.
Beaulant, A. L., Joly, B., Nuissier, O., Somot, S., Ducrocq, V., Joly A., Sevault, F., Deque, M., and Ricard, D.: Statistico-dynamical downscaling for Mediterranean heavy precipitation, J. Roy. Me-teor. Soc., 137, 736–748, 2011.
Beguer´ıa, S., Angulo-Mart´ınez, M., Vicente-Serrano, S. M., L´opez-Moreno, J. I., and El-Kenawy, A.: Assessing trends in ex-treme precipitation events intensity and magnitude using non-stationary peaks-over-threshold analysis: a case study in north-east Spain from 1930 to 2006, Int. J. Climatol., 31, 2102–2114, 2011.
Brown, L. C. and Foster, G. R.: Storm erosivity using idealized in-tensity distributions, T. ASAE, 30, 379–386, 1987.
Brunetti, M., Maugeri, M., and Nanni, T.: Changes in total precipi-tation,rainy days and extreme events in northeastern Italy, Int. J. Climatol., 21, 861–871, 2001.
de Luis, M., Gonz´alez-Hidalgo, J. C., and Longares, L. A.: Is rain-fall erosivity increasing in the Mediterranean Iberian Peninsula?, Land DegradDev, 21, 139–144, 2010a.
de Luis, M., Brunetti, M., Gonz´alez-Hidalgo, J. C., Longares, L. A., and Mart´ın-Vide, L. A.: Changes in seasonal precipitation in the Iberian Peninsula during 1946–2005, Global Planet. Change, 74, 27–33, 2010b.
Esteban-Parra, M. J., Rodrigo, F. S., and Castro-D´ıez, Y.: Spatial and temporal patterns of rainfall in Spain for the period 1880– 1992, Int. J. Climatol., 18, 1557–1574, 1998.
Gonz´alez-Hidalgo, J. C., Brunetti, M., and de Luis, M.: Precipita-tion trends in Spanish hydrological divisions, 1946–2005, Clim. Res., 43, 215–228, 2010.
Gonz´alez-Hidalgo, J. C., Lopez-Bustins, J. A., ˇStep´anek, P., Mart´ın-Vide, J., and de Luis, M.: Monthly rainfall trends on the Mediter-ranean fringe of the Iberian peninsula during the second-half of the twentieth century (1951–2000), Int. J. Climatol., 29, 1415– 1429, 2009.
Goodess, C. M. and Jones, P. D.: Links between circulation and changesin the characteristics of Iberian rainfall, Int. J. Climatol., 22, 1593–1615, 2002.
Kendon, E. J., Rowell, D. P., and Jones, R. G.: Mechanisms and reliability of future projected changes in daily rainfall, Clim. Dy-nam., 35, 489–509, 2010.
K¨unsch, H. R.: The jacknife and the bootstrap for general stationary observations, Ann. Stat., 17, 1217–1241, 1989.
Lana, X., and Burgue˜no, A.: Spatial and temporal characterization of annual extreme droughts in Catalonia (Northeast Spain), Int. J. Climatol., 18, 93–110, 1998.
Lopez-Bustins, J. A., Martin-Vide, J., and Sanchez-Lorenzo, A.: Iberia winter rainfall trends based upon changes in teleconnec-tion and circulateleconnec-tion patterns, Global Planet. Change, 63, 171– 176, 2008.
L´opez-Moreno, J. I., Vicente-Serrano, S. M., Angulo-Mart´ınez, M., Beguer´ıa, S., and El-Kenawy, A.: Trends in daily precipitation on the north eastern Iberian Peninsula, 1955–2006, Int. J. Climatol., 30, 1026–1041, 2010.
Mann, H. B.: Nonparametrictestsagainsttrend.Econometrica, 13, 245–259, 1945.
Mart´ınez, M. D., Lana, X., Burgue˜no, A., and Serra, C.: Spatial andtemporal daily rainfall regime in Catalonia (NE Spain) de-rived fromfour precipitation indices, years 1950–2000, Int. J. Cli-matol., 27, 1527–1632, 2007.
Meusburger, K., Steel, A., Panagos, P., Montanarella, L., and Alewell, C.: Spatial and temporal variability of rainfall erosiv-ity factor for Switzerland, Hydrol. Earth Syst. Sci., 16, 167–177, doi:10.5194/hess-16-167-2012, 2012.
Norrant, C. and Dougu´edroit, A.: Monthly and daily precipitation-trends in the Mediterranean (1950–2000), Theor. Appl. Clima-tol., 83, 89–106, 2006.
Paredes, D., Trigo, R. M., Garc´ıa-Herrera, R., and Franco-Trigo, I.: Understanding rainfall changes in Iberia in early spring: weather typing and storm-tracking approaches, J. Hydrometer., 7, 101– 113, 2006.
Pe˜narrocha, D., Estrela, M. J., and Mill´an, M.: Classification of daily rainfall patterns in a Mediterranean area with extreme in-tensity levels: the Valencia region, Int. J. Climatol., 22, 677–695, 2002.
Petkovsek, G. and Mikos, M.: Estimating the R factor from daily rainfall data in the sub-Mediterranean climate of southwest Slovenia, Hydrolog. Sci. J., 49, 869–877, 2004.
Renard, K. G., Foster, G. R., Weesies, G. A., McCool, D. K., and Yoder, D. C.: Predicting Soil Erosion by Water: A Guide to Con-servation Planning with the Revised Universal Soil Loss Equa-tion (RUSLE), Handbook #703. US Department of Agriculture, Washington, DC, 1997.
Richardson, C. W., Foster, G. R., and Wright, D. A.: Estimation of Erosion Index from Daily Rainfall Amount, T. ASAE, 26, 153– 160, 1983.
Rodrigo, F. S.: Changes in the probability of extreme daily precipi-tation observed from 1951 to 2002 in the Iberian Peninsula, Int. J. Climatol., 30, 1512–1525, 2010.
Rodrigo, F. S., Trigo, R. M.: Trends in daily rainfall in the Iberian Peninsula from 1951 to 2002, Int. J. Climatol., 27, 513–529, 2007.
Romero, R., Guijarro, J. A., Ramis, C., and Alonso, S.: A 30-year (1964–1993) daily rainfall data base for the Spanish Mediter-ranean regions: first exploratory study, Int. J. Climatol., 18, 541– 560, 1998.
Sauerborn, P., Klein, D. A., Botschek, J., and Skowronek, A.: Future rainfall erosivity from large scale climate models – methods and scenarios for a humid region, Geoderma, 93, 269–276, 1999. Tramblay, Y., Badi, W., Driouech, F., El Adlouni, S., Neppel, L.,
and Servat, E.: Climate change impacts on extreme precipitation in Morocco, Global Planet. Change, 82–83, 104–114, 2012. Vicente-Serrano, S. M., Beguer´ıa, S., L´opez-Moreno, J. I.,
Garc´ıa-Vera, M. A., and Stepanek, P.:A complete daily rainfall database for north-east Spain: Reconstruction, quality control and homo-geneity, Int. J. Climatol., 30, 1146–1163, 2009a.
Vicente-Serrano, S. M., Beguer´ıa, S., L´opez-Moreno, J. I., El Ke-nawy, A., and Angulo-Mart´ınez, M.: Daily atmospheric circula-tion events and extreme precipitacircula-tion risk innortheast Spain: Role of the North Atlantic Oscillation, the WesternMediterranean Os-cillation, and the Mediterranean OsOs-cillation, J.Geophys. Res., 114, D08106, doi:10.1029/2008JD011492, 2009b.
Wischmeier, W. H. and Smith, D. D.: Predicting rainfall erosion losses: a guide to conservation planning, USDA Handbook 537, Washington, DC, 1978.