ACPD
13, 4059–4125, 2013Application of WRF/Chem-MADRID
& WRF/Polyphemus in Europe
Y. Zhang et al.
Title Page
Abstract Introduction
Conclusions References
Tables Figures
◭ ◮
◭ ◮
Back Close
Full Screen / Esc
Printer-friendly Version
Interactive Discussion
Discussion
P
a
per
|
Dis
cussion
P
a
per
|
Discussion
P
a
per
|
Discussio
n
P
a
per
|
Atmos. Chem. Phys. Discuss., 13, 4059–4125, 2013 www.atmos-chem-phys-discuss.net/13/4059/2013/ doi:10.5194/acpd-13-4059-2013
© Author(s) 2013. CC Attribution 3.0 License.
Atmospheric Chemistry and Physics
Open Access
Discussions
Geoscientiic Geoscientiic
Geoscientiic Geoscientiic
This discussion paper is/has been under review for the journal Atmospheric Chemistry and Physics (ACP). Please refer to the corresponding final paper in ACP if available.
Application of WRF/Chem-MADRID and
WRF/Polyphemus in Europe – Part 2:
Evaluation of chemical concentrations,
sensitivity simulations, and
aerosol-meteorology interactions
Y. Zhang1, K. Sartelet2, S. Zhu1, W. Wang1,4, S.-Y. Wu3, X. Zhang1, K. Wang1,
P. Tran2, C. Seigneur2, and Z.-F. Wang4
1
Department of Marine, Earth, and Atmospheric Sciences, North Carolina State University, Raleigh, NC 27695, USA
2
CEREA (Atmospheric Environment Center), Joint Laboratory of ´Ecole des Ponts ParisTech
and EDF R&D, Universit ´e Paris-Est, 77455 Marne-la-Vall ´ee, France 3
Department of Air Quality and Environmental Management, Clark County, Nevada, USA 4
ACPD
13, 4059–4125, 2013Application of WRF/Chem-MADRID
& WRF/Polyphemus in Europe
Y. Zhang et al.
Title Page
Abstract Introduction
Conclusions References
Tables Figures
◭ ◮
◭ ◮
Back Close
Full Screen / Esc
Printer-friendly Version
Interactive Discussion
Discussion
P
a
per
|
Dis
cussion
P
a
per
|
Discussion
P
a
per
|
Discussio
n
P
a
per
|
Received: 12 December 2012 – Accepted: 30 January 2013 – Published: 14 February 2013
Correspondence to: Y. Zhang (yang [email protected])
ACPD
13, 4059–4125, 2013Application of WRF/Chem-MADRID
& WRF/Polyphemus in Europe
Y. Zhang et al.
Title Page
Abstract Introduction
Conclusions References
Tables Figures
◭ ◮
◭ ◮
Back Close
Full Screen / Esc
Printer-friendly Version
Interactive Discussion
Discussion
P
a
per
|
Dis
cussion
P
a
per
|
Discussion
P
a
per
|
Discussio
n
P
a
per
|
Abstract
An offline-coupled model (WRF/Polyphemus) and an online-coupled model (WRF/Chem-MADRID) are applied to simulate air quality in July 2001 at horizontal grid resolutions of 0.5◦ and 0.125◦ over western Europe. The model performance is
evaluated against available surface and satellite observations. The two models
sim-5
ulate different concentrations in terms of domainwide performance statistics, spatial distribution, temporal variations, and column abundance. WRF/Chem-MADRID at 0.5◦
gives higher values than WRF/Polyphemus for the domainwide mean and over pol-luted regions in central and southern Europe for all surface concentrations and column variables except for TOR. Compared with observations, WRF/Polyphemus gives better
10
statistical performance for daily HNO3, SO2, and NO2at the EMEP sites, max 1-h O3 at the AirBase sites, PM2.5 at the AirBase sites, max 8-h O3 and PM10 composition at all sites, column abundance of CO, NO2, TOR, and AOD, whereas WRF/Chem-MADRID gives better statistical performance for NH3, hourly SO2, NO2, and O3at the AirBase and BDQA sites, max 1-h O3 at the BDQA and EMEP sites, and PM10 at all
15
sites. WRF/Chem-MADRID generally reproduces well the observed high hourly con-centrations of SO2and NO2at most sites except for extremely high episodes at a few sites, and WRF/Polyphemus performs well for hourly SO2 concentrations at most ru-ral or background sites where pollutant levels are relatively low, but it underpredicts the observed hourly NO2 concentrations at most sites. Both models generally
cap-20
ture well the daytime max 8-h O3 concentrations and diurnal variations of O3 with more accurate peak daytime and minimal nighttime values by WRF/Chem-MADRID, but neither models reproduce extremely low nighttime O3 concentrations at several urban and suburban sites due to underpredictions of NOx and thus insufficient titra-tion of O3 at night. WRF/Polyphemus gives more accurate concentrations of PM2.5,
25
ACPD
13, 4059–4125, 2013Application of WRF/Chem-MADRID
& WRF/Polyphemus in Europe
Y. Zhang et al.
Title Page
Abstract Introduction
Conclusions References
Tables Figures
◭ ◮
◭ ◮
Back Close
Full Screen / Esc
Printer-friendly Version
Interactive Discussion
Discussion
P
a
per
|
Dis
cussion
P
a
per
|
Discussion
P
a
per
|
Discussio
n
P
a
per
|
PM species, as well as biases in the meteorological predictions. The differences in model predictions are caused by differences in the heights of the first model layers and thickness of each layer that affect vertical distributions of emissions, model treatments such as dry/wet deposition, heterogeneous chemistry, and aerosol and cloud, as well as model inputs such as emissions of soil dust and sea-salt and chemical boundary
5
conditions of CO and O3used in both models.
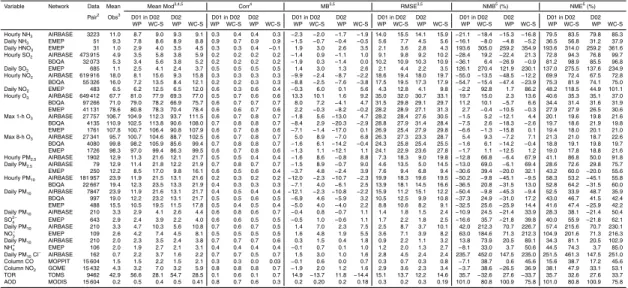
WRF/Chem-MADRID shows a higher sensitivity to grid resolution than WRF/Polyphemus at all sites. For both models, the use of a finer grid resolution generally leads to an overall better statistical performance for most variables, with greater spatial details and an overall better agreement in temporal variations and
10
magnitudes at most sites. The use of online BVOC emissions gives better statistical performance for hourly and max 8-h O3 and PM2.5 and generally better agreement with their observed temporal variations at most sites. Because it is an online model, WRF/Chem-MADRID offers the advantage to account for various feedbacks between meteorology and chemical species. The simulations show that aerosol leads to
15
reduced net shortwave radiation fluxes, 2-m temperature, 10-m wind speed, PBL height, and precipitation and increases aerosol optical depth, cloud condensation nuclei, cloud optical depth, and cloud droplet number concentrations over most of the domain. However, this model comparison suggests that atmospheric pollutant concentrations are most sensitive in state-of-the-science air quality models to vertical
20
structure, inputs, and parameterizations for dry/wet removal of gases and particles in the model.
1 Introduction
Uncertainties in air quality modeling are high and exist in both offline and online-coupled AQMs. The uncertainties lie in model inputs such as meteorological fields,
25
ACPD
13, 4059–4125, 2013Application of WRF/Chem-MADRID
& WRF/Polyphemus in Europe
Y. Zhang et al.
Title Page
Abstract Introduction
Conclusions References
Tables Figures
◭ ◮
◭ ◮
Back Close
Full Screen / Esc
Printer-friendly Version
Interactive Discussion
Discussion
P
a
per
|
Dis
cussion
P
a
per
|
Discussion
P
a
per
|
Discussio
n
P
a
per
|
model simulation set up such as horizontal and vertical grid resolutions. In the frame-work of the European the Air Quality Model Evaluation International Initiative (AQMEII) project, Sartelet et al. (2012) found that for O3, PM2.5, and PM10, differences between the WRF/Polyphemus simulations using different anthropogenic or biogenic emission schemes are much smaller than differences among different AQMEII models. A
num-5
ber of studies examined which physical parameterization, numerical approximations and boundary conditions affect pollutant concentrations the most over Europe (e.g. P ´erez et al., 2006; Roustan et al., 2010). For example, Roustan et al. (2010) found that for most pollutants, modeling of vertical diffusivity and vertical resolution affects the most the simulated concentrations. However, the relative impact of the different
param-10
eterizations varies with the pollutants considered. Using the same model configuration, Real et al. (2011) found that the impact of aerosols on photolysis rates and, therefore, on gas-phase chemistry and aerosol concentrations is also important. Differences in ozone (O3) and PM concentrations were found to occur depending on the gas-phase chemical schemes used (Kim et al., 2009, 2011). A number of studies examined the
15
sensitivity of offline-coupled AQM predictions to horizontal grid resolutions. For exam-ple, Queen and Zhang (2008) found that the simulation at a fine grid resolution of 4 km better captured the mesoscale convection thus predicted more accurate precipitation and wet deposition of chemical species in summer than the simulations at 12- or 36-km grid resolutions. Several studies, on the other hand, showed that a coarser grid
reso-20
lution provided similar or even better air quality predictions than a finer grid resolution (Mathur et al., 2005; Arunachalam et al., 2006; Cohan et al., 2006; Zhang et al., 2006; Queen and Zhang, 2008; Liu et al., 2010). Valeri and Menut (2008) found that model results do not improve monotonously with resolution. In all of these studies, meteo-rology is computed off-line, i.e. independently of the chemical transport model (CTM)
25
ACPD
13, 4059–4125, 2013Application of WRF/Chem-MADRID
& WRF/Polyphemus in Europe
Y. Zhang et al.
Title Page
Abstract Introduction
Conclusions References
Tables Figures
◭ ◮
◭ ◮
Back Close
Full Screen / Esc
Printer-friendly Version
Interactive Discussion
Discussion
P
a
per
|
Dis
cussion
P
a
per
|
Discussion
P
a
per
|
Discussio
n
P
a
per
|
WRF/Chem, Zhang et al. (2010) found that aerosols reduces incoming solar radia-tion by −16 %, 2-m temperatures by up to 0.37◦ C, and daily precipitation by up to
19.4 mm day−1 and lead to 500–5000 cm−3 cloud condensation nuclei (CCN) at a
su-persaturation of 1 % over most land areas in July over the continental US. Such feed-backs can change the abundance and lifetimes of chemical species such as CO, NO2,
5
NH3, and O3 through changing radiation, atmospheric stability, and the rates of many meteorological-dependent chemical and microphysical processes (Zhang et al., 2012a, b). Forkel et al. (2012) estimated the direct and indirect effects of aerosols on surface O3 and PM10 concentrations for June and July 2006 over Europe and found that the agreement between observed and simulated global radiation over Europe was
bet-10
ter for cloudy conditions and the monthly PM10 concentration increased by 1-3 µg m−3
when the indirect effect was taken into account. Tuccella et al. (2012) reported sig-nificant underpredictions of sulfate by WRF/Chem without aerosol feedbacks and at-tributed this to the missing aqueous-phase oxidation of SO2by H2O2and O3, a process that is not included in the standard configuration of WRF/Chem without aerosol-cloud
15
feedbacks.
Similar to offline-coupled AQMs, online-coupled AQMs are subject to all aforemen-tioned uncertainties and additional uncertainties in the meteorology-chemistry feed-back mechanisms such as aerosol direct effects on radiation, photolysis rates, and planetary boundary layer (PBL) meteorology and indirect effects on cloud formation
20
and precipitation through acting as cloud condensation nuclei (CCN) and ice nuclei (IN). More complicatedly, the uncertainties in those feedback mechanisms may be am-plified by uncertainties in model inputs such as biogenic emissions and other model treatments such as gas-phase mechanisms, aerosol treatments, and cloud chemistry and microphysics, with latter uncertainties propagating into the former uncertainties
25
ACPD
13, 4059–4125, 2013Application of WRF/Chem-MADRID
& WRF/Polyphemus in Europe
Y. Zhang et al.
Title Page
Abstract Introduction
Conclusions References
Tables Figures
◭ ◮
◭ ◮
Back Close
Full Screen / Esc
Printer-friendly Version
Interactive Discussion
Discussion
P
a
per
|
Dis
cussion
P
a
per
|
Discussion
P
a
per
|
Discussio
n
P
a
per
|
different gas-phase mechanisms. They found that different gas-phase mechanisms lead to different aerosol mass and number concentrations, which in turn lead to dif-ferent predictions of CCN and cloud droplet number concentration (CDNC) and cloud formation, and subsequently differences in shortwave radiation and PBL meteorology that are affected by cloud formation. These differences are caused by the sensitivity of
5
the chain effects of feedback mechanisms among H2SO4vapor, PM2.5number, CCN, and CDNC through gas-phase chemistry and new particle formation via homogeneous nucleation, aerosol growth, and aerosol activation by cloud droplets. The sensitivity of online-coupled air quality models to horizontal grid resolutions has also be studied (e.g. Misenis and Zhang, 2010; Wolke et al., 2012). For example, Wolke et al. (2012)
10
found that the use of finer grid resolutions in their online coupled model (i.e. COSMO-MUSCAT) can directly affect meteorological predictions, and calculated emission and deposition rates.
In this work, simulations using the offline-coupled model (i.e. WRF/Polyphemus) and the online-coupled model (WRF/Chem-MADRID) are performed for July 2001 over
dou-15
bled nested domains: D01 and D02 as shown in Fig. 1 of Part 1 (Zhang et al., 2012c), at horizontal grid resolutions of 0.5◦and 0.125◦, respectively. Part 2 describes the
eval-uation and comparison of the chemical concentrations simulated by the two models, the sensitivity of chemical concentrations to horizontal grid resolutions for both models and to biogenic emissions for WRF/Chem-MADRID, as well as aerosol and
meteorol-20
ACPD
13, 4059–4125, 2013Application of WRF/Chem-MADRID
& WRF/Polyphemus in Europe
Y. Zhang et al.
Title Page
Abstract Introduction
Conclusions References
Tables Figures
◭ ◮
◭ ◮
Back Close
Full Screen / Esc
Printer-friendly Version
Interactive Discussion
Discussion
P
a
per
|
Dis
cussion
P
a
per
|
Discussion
P
a
per
|
Discussio
n
P
a
per
|
2 Evaluation and intercomparison of WRF/Chem and WRF/Polyphemus
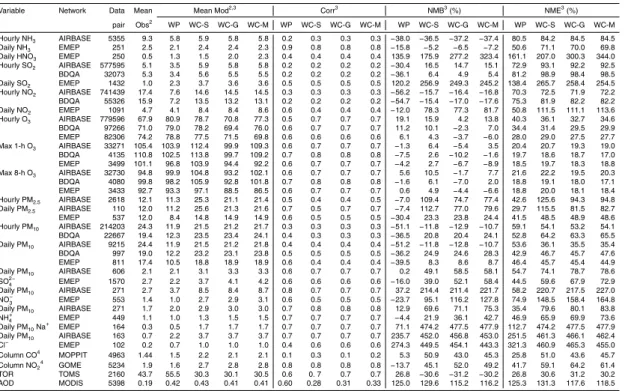
2.1 Spatial distribution and domainwide performance statistics
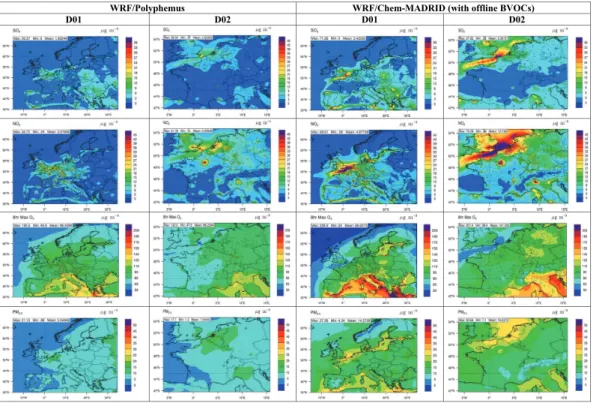
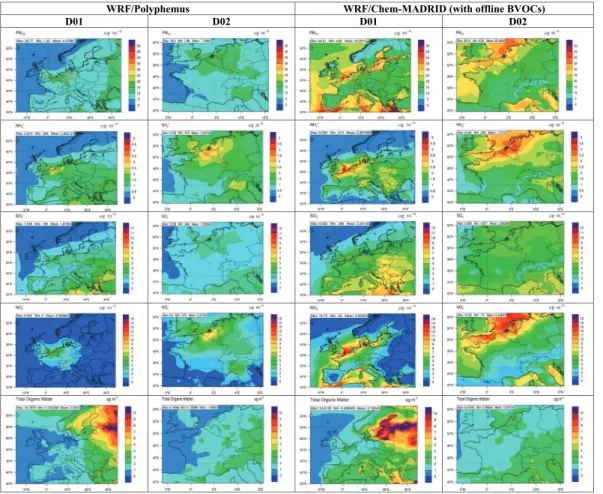
Figures 1 and 2 show simulated spatial distributions of concentrations of SO2, NO2, max 8-h O3, and 24-h average PM2.5, PM10, and major PM10composition (SO2−
4 , NO
−
3,
NH+4, and total organic matter (TOM)) by WRF/Polyphemus and WRF/Chem-MADRID
5
overlaid with observations over D01 and D02 at horizontal grid resolutions of 0.5◦ and
0.125◦ in July 2001. The corresponding domainwide performance statistics for those
species and additional species such as NH3, HNO3, and other PM10composition (Na+, and Cl−) are shown in Table 1. The results over D01 are discussed below and those
over D02 are discussed in Sect. 3.1. The observed concentrations of SO2, NO2, O3and
10
PM2.5are higher in several areas in central and southern Europe than northern Europe (i.e. the Nordic countries such as Denmark, Norway, Sweden, Finland and Baltic coun-tries such as Estonia, Latvia, and Lithuania), because of higher pollutant precursor concentrations, and the weather conditions that are more favorable for O3 and PM2.5 production at these latitudes. The spatial distributions of SO2concentrations predicted
15
from both models are overall similar and consistent with the spatial distribution of SO2 emissions inland and over ship channels. WRF/Chem-MADRID predicts higher SO2 concentrations and greater gradients in several areas including the English Channel, the ship channels over the Mediterranean Sea offthe south of Spain, Italy, and Greece, the northwestern corner of Spain, the southern portions of Poland, Romania, and
Bul-20
garia. Spatially, WRF/Chem-MADRID also predicts higher NO2concentrations in larger areas, particularly over areas with high NO2 emissions including the English Channel and the southern UK, northern France, northern Italy, Germany, Belgium, the Nether-lands, Denmark, the Baltic Sea areas off the coast of Sweden, as well as the ship channels over the Mediterranean Sea. Differences in SO2and NO2concentrations by
25
ACPD
13, 4059–4125, 2013Application of WRF/Chem-MADRID
& WRF/Polyphemus in Europe
Y. Zhang et al.
Title Page
Abstract Introduction
Conclusions References
Tables Figures
◭ ◮
◭ ◮
Back Close
Full Screen / Esc
Printer-friendly Version
Interactive Discussion
Discussion
P
a
per
|
Dis
cussion
P
a
per
|
Discussion
P
a
per
|
Discussio
n
P
a
per
|
emissions, dry and wet deposition treatments, and aerosol treatments as described in Part 1 (Zhang et al., 2013). Given the same surface emissions, lower heights in the first model layer in WRF/Chem can lead to higher surface concentrations. Different thickness of each layer in both models can also lead to differences in concentrations in the surface and upper layers. Compared with WRF/Polyphemus, WRF/Chem-MADRID
5
gives much lower dry deposition fluxes for gases (see Part 1), leading to higher con-centrations of SO2, NOx, and other gaseous species such as NH3, HNO3, O3, and OH radicals. Consequently, the levels of those gaseous precursors for aerosol thermo-dynamic partitioning and the levels of aqueous-phase oxidants such as O3and H2O2 for aqueous-phase formation of secondary aerosols are also higher in
WRF/Chem-10
MADRID, leading to higher production of SO2−
4 , NO
−
3, and NH
+
4. Further, homogeneous
binary nucleation of sulfuric acid (H2SO4) and water vapor (H2O) and aerosol ther-modynamics of Na+ and Cl− are treated in WRF/Chem-MADRID, but not treated in
WRF/Polyphemus. As a result of nucleation treatments, WRF/Chem-MADRID gives higher PM number concentrations and cloud droplet number concentrations, which
15
can enhance cloud formation and thus aqueous-phase formation of SO2−
4 . Inclusion of
Na+ and Cl− in aerosol thermodynamics calculations in WRF/Chem-MADRID may
en-hance the formation of SO2−
4 and NO−3. The heterogeneous reactions of NO3and N2O5
treated in WRF/Polyphemus provide additional pathways to remove reactive nitrogen, therefore decreasing NO2and increasing NO−
3 in the particulate phase, consistent with 20
Roustan et al. (2010). Such different treatments help explain in part lower concentra-tions of NO2predicted by WRF/Polyphemus than by WRF/Chem-MADRID. For domain-wide performance statistics, WRF/Polyphemus underpredicts observed SO2 concen-trations at the AirBase and BDQA sites with NMBs of−30.4 % and−36.1 %,
respec-tively, and overpredicts those at the EMEP sites with an NMB of 120.2 %, whereas
25
ACPD
13, 4059–4125, 2013Application of WRF/Chem-MADRID
& WRF/Polyphemus in Europe
Y. Zhang et al.
Title Page
Abstract Introduction
Conclusions References
Tables Figures
◭ ◮
◭ ◮
Back Close
Full Screen / Esc
Printer-friendly Version
Interactive Discussion
Discussion
P
a
per
|
Dis
cussion
P
a
per
|
Discussion
P
a
per
|
Discussio
n
P
a
per
|
and BDQA sites with NMBs of−15.7 % and −15.4 %, respectively. However, it
signif-icantly overpredicts those at the EMEP sites with an NMB of 78.3 %. Uncertainties in the EMEP emissions of SO2and NOx in terms of total amount and spatial and vertical distributions as reported in several studies (e.g. de Meij et al., 2006, and Mallet and Sportisse, 2006) may contribute to the discrepancies between observations and
pre-5
dictions by both models. For example, 50 % of SO2and NO2emissions in the EMEP inventories is assumed to be emitted at∼150 m (de Meij et al., 2006), which may
ex-plain in part the underpredictions in surface concentrations of NO2 by both models and in those of SO2 by Polyphemus. The EMEP sites are mostly rural background sites and the AirBase and BDQA sites also include suburban and urban background
10
sites. WRF/Polyphemus tends to perform better for SO2 and NO2 at rural sites, while WRF/Chem-MADRID tends to perform better at suburban and urban background sites. For maximum 1-h O3, WRF/Chem-MADRID performs better than WRF/Polyphemus, with small overpredictions against AirBase and small-to-moderate underpredictions against BDQA and EMEP. For maximum 8-h O3, WRF/Polyphemus slightly
underpre-15
dicts with NMBs of−1.6 % to 5.6 % and WRF/Chem-MADRID slightly overpredicts with
NMBs of 4.9–10.5 % at all sites. The differences between the predicted O3 concentra-tions by the two models may be mainly explained by the differences in dry deposition treatments used in both models (as described in Part 1). Compared with WRF/Chem-MADRID, WRF/Polyphemus gives higher dry deposition fluxes for O3, leading to lower
20
O3 concentrations. Spatially, both models predict much larger concentrations of max-imum 8-h O3 (see Fig. 1) and maximum 1-h O3 (figure not shown but very similar to those for maximum 8-h O3) in the Mediterranean Sea, Italy, Greece, and Turkey (>110 µg m−3), with larger magnitudes and several additional areas such as the Baltic
Sea, central Poland, western Hungary by WRF/Chem-MADRID due to lower dry
depo-25
ACPD
13, 4059–4125, 2013Application of WRF/Chem-MADRID
& WRF/Polyphemus in Europe
Y. Zhang et al.
Title Page
Abstract Introduction
Conclusions References
Tables Figures
◭ ◮
◭ ◮
Back Close
Full Screen / Esc
Printer-friendly Version
Interactive Discussion
Discussion
P
a
per
|
Dis
cussion
P
a
per
|
Discussion
P
a
per
|
Discussio
n
P
a
per
|
historic O3trends reported by Engardt et al. (2009). The elevated O3 levels reflect the advection of O3-laden air from continental Europe after periods of O3buildup.
For PM2.5 concentrations, WRF/Polyphemus moderately underpredicts them with NMBs of−30.4 % and−7.4 % at the EMEP and AirBase sites (in particular over Spain),
respectively, for daily concentrations and−7.0 % at the EMEP sites for hourly concen-5
trations. WRF/Chem-MADRID significantly overpredicts hourly and daily PM2.5 con-centrations at the AirBase sites with NMBs of 109.4 % and 112.7 % and moderately overpredicts daily PM2.5concentrations with an NMB of 23.3 %. Spatially, WRF/Chem-MADRID generates much higher PM2.5 concentrations over the whole domain than WRF/Polyphemus, with domain-average values of 14.6 and 5.5 µg m−3, respectively.
10
The highest PM2.5 concentrations are predicted along the ship channels over the Mediterranean Sea, the English Channel, and the Baltic Sea. Similar to O3predictions, both models predict enhanced levels of PM2.5in the Nordic and Baltic countries, reflect-ing the impact of long-range transport of PM2.5and its precursors from central Europe to this region. For PM10 concentrations, WRF/Polyphemus significantly underpredicts
15
them at all sites (in particular over Spain) with NMBs of−51.2 to−36.2 %.
WRF/Chem-MADRID performs better with NMBs of−11.8 % to 24.9 % for daily concentrations and −11.8 % to 20.8 % for hourly concentrations, mainly because of the overprediction
of PM2.5 and sea-salt concentrations as well as the inclusion of mineral dust emis-sions. The spatial distributions of PM10 concentrations are overall similar to those of
20
PM2.5 concentrations in both models. Similar to PM2.5 concentrations, WRF/Chem-MADRID predicts three times higher PM10 concentrations over the whole domain than WRF/Polyphemus, with domain-average values of 20.3 and 6.5 µg m−3,
respec-tively, and the highest concentrations along the ship channels. The domainwide mean concentrations of coarse PM (i.e. PM10−2.5) are 1 µg m−3 for WRF/Polyphemus and
25
5.7 µg m−3 for WRF/Chem-MADRID over D01. WRF/Chem-MADRID predicts higher
ACPD
13, 4059–4125, 2013Application of WRF/Chem-MADRID
& WRF/Polyphemus in Europe
Y. Zhang et al.
Title Page
Abstract Introduction
Conclusions References
Tables Figures
◭ ◮
◭ ◮
Back Close
Full Screen / Esc
Printer-friendly Version
Interactive Discussion
Discussion
P
a
per
|
Dis
cussion
P
a
per
|
Discussion
P
a
per
|
Discussio
n
P
a
per
|
sea-salt emissions used in WRF/Polyphemus. Differences in natural emissions of sea-salt and mineral dust may also contribute to differences in predicted PM2.5 concentra-tions, as a small portion of those emissions is in the size range of PM2.5. Although dust particle emissions from Sahara desert are not explicitly simulated because the simulation domain does not cover Sahara desert, WRF/Chem-MADRID uses
chemi-5
cal boundary conditions from the Global-through-Urban WRF/Chem (GU WRF/Chem) of Zhang et al. (2012b) that simulates mineral dust emissions from all dust source regions including Sahara desert, and it also simulates soil dust emissions from the aforementioned land types within the simulation domain. The enhanced PM10 con-centrations simulated by WRF/Chem-MADRID are consistent with several studies that
10
accounted for contributions of mineral dust to PM10 (e.g. Ji ´enez-Guerrero et al., 2008). In WRF/Polyphemus, PM10−2.5results primarily from the offline sea-salt emissions. Al-though the Goddard Chemistry Aerosol Radiation and Transport (GOCART, Chin et al., 2000) also accounted for the contributions of Saharan dust, those values represented high dust events and were unrealistically high and were divided by four to represent the
15
boundary conditions of coarse PM in WRF/Polyphemus following Sartelet et al. (2007), resulting in small differences between simulated PM10 and PM2.5 concentrations over southern Europe.
In addition to higher dust and sea-salt concentrations, higher concentrations of sec-ondary inorganic aerosols such as NH+4, SO2−
4 , and NO−3, secondary organic aerosols 20
(SOA), and primary PM (e.g. elemental carbon (EC), primary organic carbons (POC), dust, and sea-salt) contribute to higher PM2.5and PM10concentrations by WRF/Chem-MADRID. Those higher concentrations result from the differences in heights of the first model layers and thickness of each layer that affect vertical distributions of emissions of primary PM and gaseous precursors of secondary PM as mentioned previously and in
25
ACPD
13, 4059–4125, 2013Application of WRF/Chem-MADRID
& WRF/Polyphemus in Europe
Y. Zhang et al.
Title Page
Abstract Introduction
Conclusions References
Tables Figures
◭ ◮
◭ ◮
Back Close
Full Screen / Esc
Printer-friendly Version
Interactive Discussion
Discussion
P
a
per
|
Dis
cussion
P
a
per
|
Discussion
P
a
per
|
Discussio
n
P
a
per
|
for PM species, leading to higher PM concentrations. WRF/Chem-MADRID overpre-dicts the concentrations of secondary inorganic aerosol species, whereas to a lesser extent WRF/Polyphemus either underpredicts (e.g. SO2−
4 and NO
−
3 at the EMEP sites)
and overpredicts (e.g. Na+ and Cl− at all sites and NH+
4 and NO−3 at the AirBase
sites). For example, the NMBs of SO2−
4 concentrations are −16.0 % to 0.2 % for 5
WRF/Polyphemus and 39.0 % to 49.1 % for WRF/Chem-MADRID. At the EMEP sites, small-to-moderate underpredictions occur in the NH3 concentrations with an NMB of
−15.8 % for WRF/Polyphemus and−5.2 % for WRF/Chem-MADRID. The HNO3
con-centrations are significantly overpredicted (with NMBs of 135.9 % for WRF/Polyphemus and 175.9 % for WRF/Chem-MADRID). Those model biases contribute to biases in
10
the simulated concentrations of NH+4 and NO−
3, with a small-to-moderate
underpre-diction (with NMBs of −4.4 % and −23.7 %, respectively) by WRF/Polyphemus and
the moderate-to-large overpredictions (with NMBs of 21.9 % and 95.1 %, respectively) by WRF/Chem-MADRID. At the AirBase sites, larger underpredictions occur in the NH3 concentrations with NMBs of −38.0 % for WRF/Polyphemus and −36.5 % for 15
WRF/Chem-MADRID. Although there is no observational data for HNO3from AirBase, moderate-to-large overpredictions of NH+4 and NO−
3 concentrations (NMBs of 12.9 %
and 37.2 % for WRF/Polyphemus and 69.6 % and 214.4 % for WRF/Chem-MADRID, re-spectively) imply an overprediction of HNO3concentrations. They also indicate a NH+4 -rich environment in which ammonium nitrate (NH4NO3) formation is limited by the
20
formation of HNO3 in the simulation domain, which is consistent with the findings of Sartelet et al. (2007). Both models predict high concentrations of SOA (thus TOM) over regions with high isoprene and terpene emissions such as the northeastern por-tion of the domain, which dominates the concentrapor-tions of TOM. WRF/Chem-MADRID also predicts high concentrations of SOA in the southern portion of the domain where
25
ACPD
13, 4059–4125, 2013Application of WRF/Chem-MADRID
& WRF/Polyphemus in Europe
Y. Zhang et al.
Title Page
Abstract Introduction
Conclusions References
Tables Figures
◭ ◮
◭ ◮
Back Close
Full Screen / Esc
Printer-friendly Version
Interactive Discussion
Discussion
P
a
per
|
Dis
cussion
P
a
per
|
Discussion
P
a
per
|
Discussio
n
P
a
per
|
2.2 Evaluation of temporal variations at specific sites
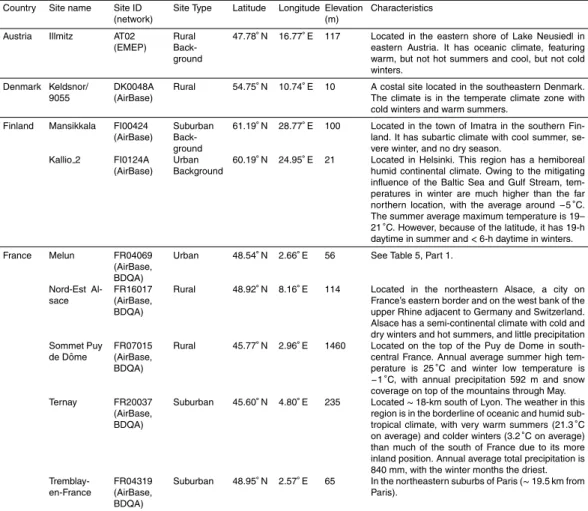
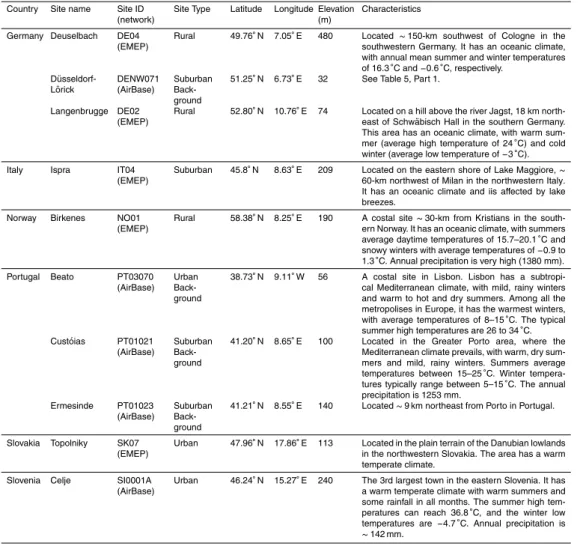
2.2.1 Description of selected sites
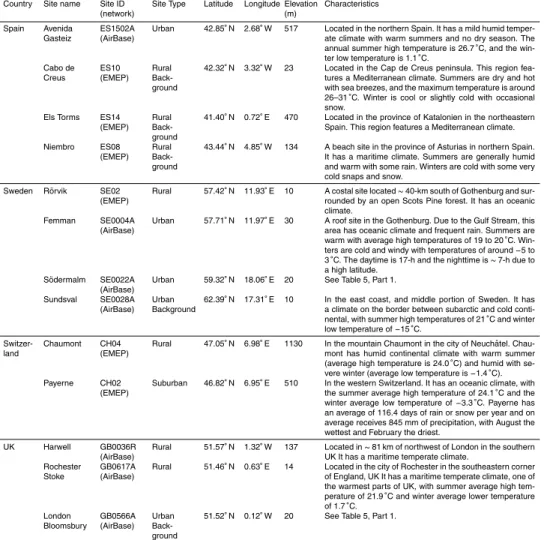
Sixteen and twenty one sites are selected from three observational databases (Air-Base, EMEP, and BDQA) for detailed temporal analyses of chemical predictions of gaseous (e.g. SO2, NO2, and O3) and PM (e.g. PM2.5 and PM10) pollutants,
respec-5
tively. These sites and their characteristics are summarized in Table 3. Among the six-teen sites selected for analyses of SO2, NO2, and O3, eight sites (Melun, Nord-Est Al-sace, and Sommet Puy-de-D ˆome, France; Deuselbach in Germany; Ispra, Italy; Celje, Slovenia; Harwell, UK; and Avenida Gasteiz, Spain) are in D02 and eight sites (R ¨orvik, Femman, and S ¨odermalm, Sweden; Birkenes, Norway; Topolniky, Slovakia; Beato,
10
Cust ´oias, and Emesinde, Portugal) are in D01 but outside D02. Among the twenty one sites selected for analysis of PM2.5 and PM10, thirteen sites (Tremblay-en-France and Ternay, France; Deuselbach and Langenbrugge in Germany; Payerne and Chau-mont, Switzerland; Ispra, Italy; Celje, Slovenia; Harwell, Rochesterstoke, and London Bloomsbury, UK; and Cabo de Creus and Niembro, Spain) are in D02 and eight sites
15
(Celje, Slovenia; Sundsval and S ¨odermalm, Sweden; Birkenes, Norway; Mansikkala and Kallio 2, Finland; Illmitz, Austria; Ermesinde, Portugal) are in D01 but outside D02. Because of a lack of concurrent measurements of gaseous and PM concentrations at the same or co-located sites, the sites selected for gaseous and PM measurements are mostly different. Among the thirty two sites selected, only seven sites are common
20
to both gaseous and PM measurements including Deuselbach, Ispra, Celje, Harwell, S ¨odermalm, Birkenes, and Ermesinde. Only six sites are co-located with the selected meteorological sites from the NCEP or the ECA&D databases (see Table 5 in Part 1) including two AirBase/BDQA sites (Melun and Tremblay-en-France) in France and four AirBase sites (D ¨usseldorf-L ¨orick in Germany, Avenida Gasteiz in Spain, S ¨odermalm in
25
ACPD
13, 4059–4125, 2013Application of WRF/Chem-MADRID
& WRF/Polyphemus in Europe
Y. Zhang et al.
Title Page
Abstract Introduction
Conclusions References
Tables Figures
◭ ◮
◭ ◮
Back Close
Full Screen / Esc
Printer-friendly Version
Interactive Discussion
Discussion
P
a
per
|
Dis
cussion
P
a
per
|
Discussion
P
a
per
|
Discussio
n
P
a
per
|
D ¨usseldorf-L ¨orick is co-located with the NCEP site (D ¨usseldorf 1 (10400)//D ¨usseldorf 210400 (EDDL)). Avenida Gasteiz (ES1502A) is co-located with the NCEP site Bilbao (LEVT). S ¨odermalm (SE0022A) is co-located with the NCEP site Stockholm 1 (02484) and the ECA&D site Stockholm (000010). London Bloomsbury (GB0566A) in the UK is co-located with the NCEP sites, London1 (3779) and Landon 2 (3781).
5
These sites are selected from fourteen countries for their geographical and topo-graphical representations. They are classified into six urban sites (Melun, Topolniky, Celje, Avenida Gasteiz, Femman, S ¨odermalm), four suburban sites (Ternay, Tremblay-en-France, Ispra, Payerne), thirteen rural sites (Keldsnor, Nord-Est Alsace, Sommet Puy-de-D ˆome, Deuselbach, Langenbrugge, Birkenes, Cabo de Creus, Els Torms,
10
Niembro, R ¨orvik, Chaumont, Harwell, and Rochester Stoke), and nine background sites (Illmitz, Mansikkala, Kallio 2, Sundsval, London Bloomsbury, D ¨usseldorf-L ¨orick, Beato, Cust ´oias, and Ermesinde). Among those background sites, one is a rural back-ground site (Illmitz), four are urban backback-ground sites (Kallio 2, London Bloomsbury, Beato, and Sundsval), and the remaining four are suburban background sites. Among
15
all sites, there are eight sites located 200 m above sea level (a.s.l.) including Som-met Puy-de-D ˆome (1460 m), Chaumont (1130 m), Avenida Gasteiz (517 m), Payerne (510 m), Deuselbach (480 m), Celje (240 m), Ternay (235 m), and Ispra (209 m). The altitude, location, and topography affect the climate conditions at all selected sites. Climatic conditions at these selected sites include western European oceanic climate
20
(i.e. Melun, Nord-Est Alsace, Sommet Puy-de-D ˆome, Ternay, and Tremblay-en-France, France; Harwell, Rochester Stoke, and London Bloomsbury, UK; Avenida Gasteiz and Niembro, Spain; Illmitz, Austria; Deuselbach and Langenbrugge, Germany; Ispra, Italy; Birkenes, Norway; R ¨orvik and Femman, Sweden; and Payerne, Switzerland), continen-tal or subtropical Mediterranean climate (Cabo de Creus, Spain; Beato, Cust ´oias, and
25
ACPD
13, 4059–4125, 2013Application of WRF/Chem-MADRID
& WRF/Polyphemus in Europe
Y. Zhang et al.
Title Page
Abstract Introduction
Conclusions References
Tables Figures
◭ ◮
◭ ◮
Back Close
Full Screen / Esc
Printer-friendly Version
Interactive Discussion
Discussion
P
a
per
|
Dis
cussion
P
a
per
|
Discussion
P
a
per
|
Discussio
n
P
a
per
|
between subarctic and cold continental climate (Sundsval, Sweden). Different climatic conditions affect pollutant transport and accumulation.
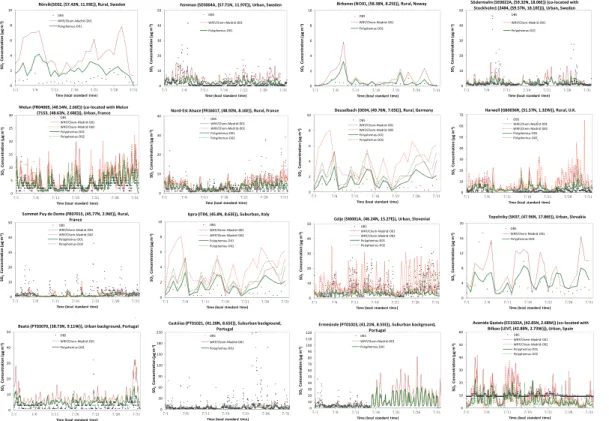
2.2.2 Simulations over D01 at a horizontal grid resolution of 0.5◦
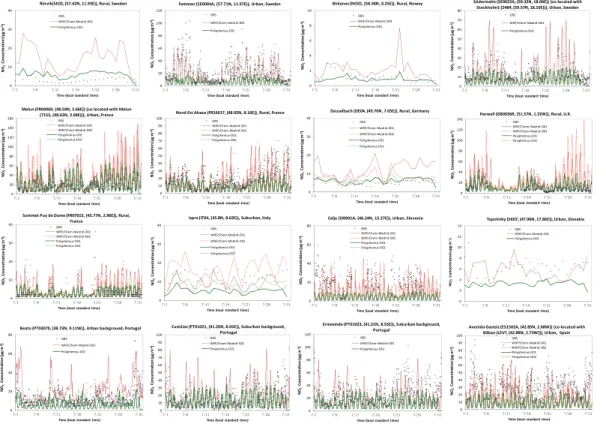
Figure 3 shows simulated and observed hourly concentrations of SO2 at sixteen se-lected sites in four latitude bands: 57–60◦N, 48–52◦N, 45–48◦N, and 38–43◦N. The
5
model performance varies with locations substantially. In the northern latitude band (57–60◦N), both models overpredict the concentrations of SO
2on a typical day but fail
to reproduce the observed extremely high concentrations of SO2 during several pol-lution episodes at two urban sites in Sweden: Femman on 4–6, 20, and 27 July and S ¨odermalm on 7–9 and 26–28 July, with much better agreement on high SO2
con-10
centrations by WRF/Chem-MADRID than WRF/Polyphemus. Femman is a roof site in Gothenburg, the second largest city in southwestern Sweden. The Gothenburg area is known to have relatively limited dispersion, due to complex terrain (i.e. valleys carved down into a flat plateau and its proximity to the sea). This topography favors the devel-opment of stable air and inversions inside the valleys (Haeger-Eugensson et al., 2010).
15
The special topography and the stable, low wind meteorological conditions, coupled with high emissions of SO2, lead to extremely high SO2 episodes on some days in the Gothenburg area. S ¨odermalm is located in central Stockholm in the south-central east coast of Sweden. Stockholm is the capital and the largest city of Sweden and constitutes the most populated urban area in Scandinavia. The topography of
Stock-20
holm is relatively smooth, without dominating ridges or valleys. However, Stockholm has a hemiboreal humid continental climate featuring a warm to hot summer. The wind speeds in Stockholm are typically low (mostly<4 m s−1) (see Fig. 12 in Part 1). The hot,
humid, and low wind summer coupled with high emissions favors the accumulation of air pollutants such as SO2in Stockholm. As shown in Figs. 8, 12, and 14 in Part 1, WRF
25
ACPD
13, 4059–4125, 2013Application of WRF/Chem-MADRID
& WRF/Polyphemus in Europe
Y. Zhang et al.
Title Page
Abstract Introduction
Conclusions References
Tables Figures
◭ ◮
◭ ◮
Back Close
Full Screen / Esc
Printer-friendly Version
Interactive Discussion
Discussion
P
a
per
|
Dis
cussion
P
a
per
|
Discussion
P
a
per
|
Discussio
n
P
a
per
|
much higher SO2 concentrations than WRF/Polyphemus for the reasons mentioned previously. At the two rural sites, R ¨orvik, Sweden and Birkenes, Norway, both mod-els significantly overpredict, with better agreement by WRF/Polyphemus. In the central latitude band (48–52◦N), both models overpredict at an urban site Melun and a rural
site Nord-Est Alsace in France with better agreement by WRF/Polyphemus with
ob-5
served low and average concentrations on most days and by WRF/Chem-MADRID with observed high concentrations (e.g. during 2–5 July at Melun and during 2, 6, 21, 25–26, and 30–31 July at Nord-Est Alsace). As shown in Fig. 12 in Part 1, wind speeds are significantly underpredicted at Melun, which may explain in part the over-predictions in the SO2 concentrations at Melun due to underestimated dispersion. At
10
the other two rural sites (Deuselbach, Germany and Harwell, UK), both models signifi-cantly overpredict SO2concentrations, with less overpredictions by WRF/Polyphemus. In the central south latitude band (45–48◦N), while large overpredictions by both
mod-els occur at an urban site (Topolniky, Slovakia) and a suburban site (Ispra, Italy), un-derpredictions occur at a rural mountain site (Sommet Puy de Dome) on the top of the
15
Puy-de-D ˆome, a large lava dome and extinct volcano in south-central France where observed SO2 concentrations are typically high (>5 µg m−3) and can reach 36 µg m−3
due to regional emissions from industrial sources. At an urban site, Celje in Slovenia where observed SO2 concentrations are high (mostly in the range of 5–34 µg m−3),
while WRF/Polyphemus underpredicts, WRF/Chem-MADRID reproduces well the
ob-20
served high SO2 concentrations. Celje has a climate that is in a transition between continental and alpine influenced by urban heat island. It is located in a basin with regular temperature inversions and prevailing weak local winds (Otorepec and Gale, 2004), which favors pollutant buildup. The main sources of air pollution include traf-fic (in particular, diesel vehicles), poor oil burning in some residential areas, burning
25
ACPD
13, 4059–4125, 2013Application of WRF/Chem-MADRID
& WRF/Polyphemus in Europe
Y. Zhang et al.
Title Page
Abstract Introduction
Conclusions References
Tables Figures
◭ ◮
◭ ◮
Back Close
Full Screen / Esc
Printer-friendly Version
Interactive Discussion
Discussion
P
a
per
|
Dis
cussion
P
a
per
|
Discussion
P
a
per
|
Discussio
n
P
a
per
|
Spain and at an urban background site, Beato in Portugal, where the observed SO2 concentrations are typically low to moderate (mostly<4 and 11 µg m−3, respectively).
As shown in Fig. 8, 12, and 14 in the Part 1 paper, WRF simulates 10-m wind speeds well but largely underpredicts peak 2-m temperatures and overpredicts precipitations on 6–9 and 15–21 July at Avenida Gasteiz. In addition to inaccurate emissions of SO2,
5
the underpredictions in peak 2-m temperatures may partly explain the higher peak SO2 concentrations than observations at this site by both models, due to insufficient conversion of SO2to sulfate through gas-phase oxidation. At a suburban background site, Cust ´oias in Portugal, both models fail to reproduce the extremely higher observed concentrations (mostly >10 µg m−3 and can reach as high as 210 µg m−3). Cust ´oias
10
is located in the Greater Porto area, the second-largest city in northwestern Portu-gal where the pollutant emissions from its urban and industrial areas are among the highest in Portugal with the major pollution sources from road transport and other com-bustion processes (Ribeiro et al., 2012). The Porto area features the Mediterranean climate, with warm, dry summers and mild, rainy winters, which favors pollution build
15
up. At the suburban background site, Ermesinde, located∼9 km northeast from Porto
in Portugal, the observed SO2 concentrations are available during 1–14 July and are much lower than those at Cust ´oias. Both models give higher SO2concentrations in the second half of the month, although no observations are available for comparison.
Figure 4 shows the simulated and observed concentrations of hourly NO2at the
six-20
teen selected sites. In the northern latitude band (57–60◦N), at the two urban sites
in Sweden (Femman and S ¨odermalm), the observed NO2 concentrations are very high, with monthly mean values of 21.4 and 12.7 µg m−3and peak values of 103 and
45 µg m−3, respectively. The high NO
2concentrations at Femman, Gothenburg are due
partly to high NO2 emissions from local vehicles and ships and partly to
meteorolog-25
photo-ACPD
13, 4059–4125, 2013Application of WRF/Chem-MADRID
& WRF/Polyphemus in Europe
Y. Zhang et al.
Title Page
Abstract Introduction
Conclusions References
Tables Figures
◭ ◮
◭ ◮
Back Close
Full Screen / Esc
Printer-friendly Version
Interactive Discussion
Discussion
P
a
per
|
Dis
cussion
P
a
per
|
Discussion
P
a
per
|
Discussio
n
P
a
per
|
chemical reactions (Johansson and Forsberg, 2005), as well as unfavorable weather conditions for dispersion. While WRF/Polyphemus significantly underpredicts observed high NO2concentrations at both sites, WRF/Chem-MADRID shows much better agree-ment, although it underpredicts NO2 concentrations that are greater than 60 µg m−3
during 5–6 and 20 July at Femman and overpredicts peak NO2 concentrations on
5
some days (e.g. 7–8, 21–22, 25–26 July). As discussed above, the discrepancies be-tween simulated and observed NO2concentrations by both models at S ¨odermalm and Femman are most likely caused by the missing of the high emissions in the EMEP inventories, rather than biases in the meteorological predictions. At the two rural sites, R ¨orvik, Sweden and Birkenes, Norway, the observed NO2 concentrations are much
10
lower, with monthly mean values of 2.8 and 1.3 µg m−3 and peak values of 5.6 and
4.9 µg m−3, respectively. Both models overpredict at R ¨orvik, with much larger
over-pedictions by WRF/Chem-MADRID. At Birkenes, WRF/Polyphemus simulates well on most days with underpredictions during 5–7 July. While WRF/Chem-MADRID better simulates the observed NO2 levels during 5–6 July, it still underpredicts those on 7
15
July, and overpredicts significantly those during 19–24 July. In the central latitude band (48–52◦N), the observed NO
2concentrations are typically>10 µg m−3and can be over
70 µg m−3 at the urban site Melun and the rural site Nord-Est Alsace in France, those
are typically between 3–40 µg m−3at Harwell, UK and between 3–7 µg m−3at
Deusel-bach, Germany. The major NO2sources in Paris and at Harwell in the southern UK are
20
traffic emissions (Aphesis, 2002). While WRF/Polyphemus simulates NO2 concentra-tions well at Melun and Harwell, WRF/Chem-MADRID significantly overpredicts them. Despite large underpredictions in 10-m wind speeds at Melun, the good performance in NO2 predictions by WRF/Polyphemus but large overpredictions by WRF/Chem-MADRID indicates that biases in meteorological predictions are not a major factor to
ex-25
ACPD
13, 4059–4125, 2013Application of WRF/Chem-MADRID
& WRF/Polyphemus in Europe
Y. Zhang et al.
Title Page
Abstract Introduction
Conclusions References
Tables Figures
◭ ◮
◭ ◮
Back Close
Full Screen / Esc
Printer-friendly Version
Interactive Discussion
Discussion
P
a
per
|
Dis
cussion
P
a
per
|
Discussion
P
a
per
|
Discussio
n
P
a
per
|
on some days, despite underpredictions on some days. At Nord-Est Alsace, the NO2 concentrations are underpredicted by WRF/Polyphemus and are generally well repro-duced by WRF/Chem-MADRID. Nord-Est Alsace is located in Alsace, which is one of most industrialized regions in France and is known for its hop harvesting and brewing, automobile industry, and phosphate mining. It is also one of the main routes between
5
France and Germany. This area thus has high NO2 emissions from road traffic and various industrial sources. In the central south latitude band (45–48◦N), the observed
NO2 concentrations are high at the urban site, Celje, Slovenia (1–59 µg m−3, mostly
>3 µg m−3, a monthly average of 19.5 µg m−3) due to high NO2emissions from
indus-try, diesel vehicles, and residential combustions and the weather conditions that favor
10
pollutant buildup. They are relatively low at the other three sites due to lower sources of NO2, with 1–36, 6–26, and 3–11 µg m−3and monthly-mean values of 3.7, 13.0, and
6.3 µg m−3, respectively, at Sommet Puy-de-D ˆome, France; Ispra, Italy; and Topolniky,
Slovakia. WRF/Chem-MADRID reproduces the observed NO2 concentrations at Celje and Sommet Puy-de-D ˆome on most days and at Ispra and Topolniky on some days,
15
despite some underpredictions on some days at those sites. WRF/Polyphemus signifi-cantly underpredicts observations at all these sites. In the southern latitude band (38– 43◦N), the observed NO
2 concentrations are above 10 µg m− 3
during most hours at all sites; they range from 3–102, 2–95, 1–83, and 2–74 µg m−3with monthly-mean
val-ues of 24.1, 28.9, 16.3, and 11.8 µg m−3, respectively, at Ermesinde, Portugal; Avenida
20
Gasteiz, Spain; Cust ´oias, Portugal, and Beato, Portugal. Many manufacturing compa-nies have operations in the Gasteiz area including automobiles, tyres, games, cookies, pasta, and flour, producing large NO2emissions. Its mild humid temperate climate with warm summers also favors the photochemistry, which further enhances the local NO2 levels at Avenida Gasteiz. The three urban or suburban background sites are located
25
ACPD
13, 4059–4125, 2013Application of WRF/Chem-MADRID
& WRF/Polyphemus in Europe
Y. Zhang et al.
Title Page
Abstract Introduction
Conclusions References
Tables Figures
◭ ◮
◭ ◮
Back Close
Full Screen / Esc
Printer-friendly Version
Interactive Discussion
Discussion
P
a
per
|
Dis
cussion
P
a
per
|
Discussion
P
a
per
|
Discussio
n
P
a
per
|
further enhances the NO2 levels via greater O3 concentrations available for NO titra-tion. At all these sites, WRF/Chem-MADRID gives better agreement with observations than WRF/Polyphemus, despite discrepancies on some days. While the underpredic-tions in peak 2-m temperatures may contribute to the underpredicunderpredic-tions in peak NO2 concentrations at this site by both models due to less photochemistry as a result of
5
less solar radiation and lower emissions of BVOCs, inaccurate emissions of NO2in the EMEP inventory may play a more important role in the biases in the NO2predictions.
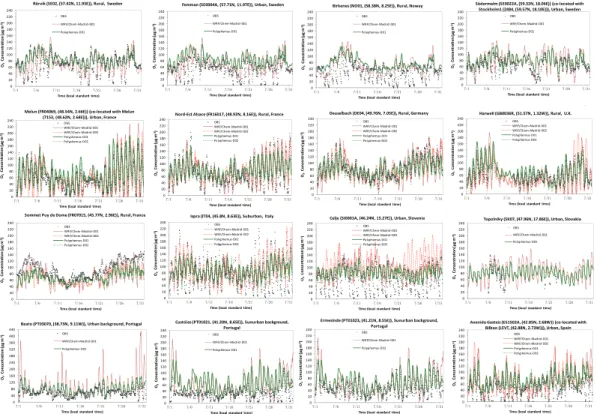
Figures 5 and 6 show simulated and observed concentrations of hourly and maxi-mum 8-h O3, respectively, at the sixteen selected sites. The European Union (EU) air quality standard for maximum 8-h O3 is 120 µg m−3. Some European countries also
10
have a standard for maximum 1-h O3. For example, the maximum 1-h O3 standard of Italy is 180 µg m−3. In the northern latitude band (57–60◦ N), the observed hourly O
3
concentrations at the four sites are similar in terms of magnitudes (up to 132 µg m−3)
and diurnal variations. The O3 concentrations exhibit a strong diurnal variation with nighttime O3 levels as low as 1–3 µg m−3 at these sites, particularly at Birkenes and
15
Femman. The observed daily variation trends and magnitudes (up to 122 µg m−3) in the
maximum 8-h O3are also similar at those sites. Note that the observed high maximum 8-h O3 concentration of 122 µg m−3 is above the EU standard for O
3. At the two
ur-ban sites, Femman and S ¨odermalm, local vehicles and ships are predominant sources of CO, NO2, and VOCs, leading to high O3 formation. While NO2 concentrations at
20
R ¨orvik and Birkenes are low, the O3concentrations are similar to those at the two ur-ban sites, indicating other possible causes such as the long-range transport (LRT) O3 and O3precursors such as NOxand VOCs from other European countries such as the UK, Poland, Denmark, and Russia (Øystein et al., 1997). Tang et al. (2009) studied the correlation between synoptic circulation and surface O3concentrations in southern
25
ACPD
13, 4059–4125, 2013Application of WRF/Chem-MADRID
& WRF/Polyphemus in Europe
Y. Zhang et al.
Title Page
Abstract Introduction
Conclusions References
Tables Figures
◭ ◮
◭ ◮
Back Close
Full Screen / Esc
Printer-friendly Version
Interactive Discussion
Discussion
P
a
per
|
Dis
cussion
P
a
per
|
Discussion
P
a
per
|
Discussio
n
P
a
per
|
to high latitudes, the daytime hours are long (∼18-h) in summer at all these locations,
favoring the photochemical O3 formation. The special topography and/or the stable, low wind meteorological conditions at some sites (e.g. Femman and S ¨odermalm in Sweden) also facilitate the pollution buildup. Both models generally capture high O3 concentrations and the day-to-day variations at these sites (except for slight
overpre-5
dictions on some days). Both models show a good agreement with nighttime O3 at S ¨odermalm, in particular, WRF/Chem-MADRID predicts much higher NO2 concentra-tions that are in much better agreement with observed nighttime O3 concentrations, illustrating the role of NOx titration in determining nighttime O3 levels. Both models, however, fail to reproduce the low O3 concentrations at night at R ¨orvik, Femman, and
10
Birkenes for different reasons. At Femman, the underpredictions of NOxby both mod-els (see Fig. 4) may have led to an insufficient titration of O3 at night. At R ¨orvik and Birkenes where observed NOxconcentrations are low, the very low observed nighttime O3concentrations may be caused by several other mechanisms. For example, O3can be destroyed by hydroxyl, hydroperoxy, or organic radicals (OH, HO2, and RO2) (note
15
that RO2 can be produced from high VOCs transported into these areas) in low-NOx conditions, dominating nighttime O3 chemistry (Monks, 2005). Both sites are on the coast, where the concentrations of sea-salt are high. Chlorine/bromine atom (Cl and Br) may be produced from heterogeneous reactions of sea-salt with acidic species such as H2SO4and HNO3at night (Monk, 2005; Jacobson, 2012), which can then
de-20
stroy nighttime O3efficiently. Both models do not include the heterogeneous reactions of sea-salt, and they may have underpredicted concentrations of VOCs and associated RO2radicals at R ¨orvik and Birkenes, leading to insufficient nighttime destruction of O3 at both sites. For maximum 8-h O3, both models give better agreement than hourly O3, illustrating the models’ capability in capturing daytime high O3.
25
In the central latitude band (48–52◦N), the observed O
3 concentrations at the four
ACPD
13, 4059–4125, 2013Application of WRF/Chem-MADRID
& WRF/Polyphemus in Europe
Y. Zhang et al.
Title Page
Abstract Introduction
Conclusions References
Tables Figures
◭ ◮
◭ ◮
Back Close
Full Screen / Esc
Printer-friendly Version
Interactive Discussion
Discussion
P
a
per
|
Dis
cussion
P
a
per
|
Discussion
P
a
per
|
Discussio
n
P
a
per
|
and at Nord-Est Alsace that is located in an industrialized region, or due likely to the influence of LRT on O3 levels at Deuselbach where there is no significant local sources and emissions from polluted areas east and southeast of Deuselbach such as Frankfurt (Andre et al., 1981). The observed hourly O3concentrations can reach up to 172 µg m−3 at Melun, 199 µg m−3at Nord-Est Alsace, 181 µg m−3 at Deuselbach, and
5
154 µg m−3 at Hawell, close to or above the hourly O
3standard of 180 µg m−3in some
European countries. The observed maximum 8-h O3 concentrations can reach up to 159 µg m−3 at Melun, 176 µg m−3at Nord-Est Alsace, 170 µg m−3 at Deuselbach, and
131 µg m−3 at Hawell, all of which are well above the EU maximum 8-h O
3 standard
of 120 µg m−3. The first and last weeks of July 2001 are high O
3 episodes in these 10
areas. At these sites, WRF/Chem-MADRID reproduces both daytime and nighttime O3 levels very well, despite some overpredictions of daytime peak O3 due in part to overpredicted NO2 concentrations and in part to biases in meteorological predictions (e.g. underpredicted 10-m wind speed at Melun) and underpredictions of nighttime low O3 levels due to overpredicted titration of nighttime O3 by NOx during a few hours at
15
some sites (e.g. 3–5 July at Melun and 26–31 July at Harwell). As shown in Fig. 12 in Part 1, wind speeds are significantly underpredicted at Melun, which may explain in part the overpredictions in the SO2 concentrations at Melun due to underestimated dispersion. WRF/Polyphemus captures well the O3 concentrations and diurnal vari-ations at Melun and Harwell, but tends to underpredict the daytime peak O3 levels
20
and overpredict the nighttime low O3 levels at Nord-Est Alsace and Deuselbach. Both models simulate maximum 8-h O3well on most days at Melun, WRF/Chem-MADRID gives better agreement than WRF/Polyphemus at Nord-Est Alsace and Deuselbach, and WRF/Polyphemus gives better agreement at Harwell.
In the central south latitude band (45–48◦N), the observed hourly and maximum 8-h
25
O3 levels at Ispra are the highest among the four sites, reaching 252 and 197 µg m−3,
ACPD
13, 4059–4125, 2013Application of WRF/Chem-MADRID
& WRF/Polyphemus in Europe
Y. Zhang et al.
Title Page
Abstract Introduction
Conclusions References
Tables Figures
◭ ◮
◭ ◮
Back Close
Full Screen / Esc
Printer-friendly Version
Interactive Discussion
Discussion
P
a
per
|
Dis
cussion
P
a
per
|
Discussion
P
a
per
|
Discussio
n
P
a
per
|
polluted areas such as Milan to Ispra when mountain breeze develops in the after-noon and when the prevailing wind direction is from the south, where the urban and the industrial areas are located (Perrino and Putaud, 2003). Non-attainment of maxi-mum 8-h O3 at other sites on some days also occurred on some days at other sites. The model performance varies strongly form site to site. At the rural site, Sommet
5
Puy-de-D ˆome in France, while both models generally capture the day-to-day varia-tion of hourly O3 (e.g. relatively higher observed O3 levels during 2–7 July and 22–31 July), WRF/Chem-MADRID shows better agreement in terms of amplitudes of daily variations and magnitudes of the peak O3 concentrations. At the suburban site, Is-pra, Italy, WRF/Chem-MADRID gives better agreement with observed hourly O3than
10
WRF/Polyphemus, although it still underpredicts peak O3 on some days and overpre-dicts the minimal O3 on most days. At an urban site, Celje, Slovenia, WRF/Chem-MADRID overpredicts daytime O3 levels and WRF/Polyphemus gives better agree-ment. But both models fail to reproduce the nighttime O3 levels, due mainly to under-predictions in NOx concentrations (see Fig. 4 for NO2 predictions). At another urban
15
site, Topolniky, in Slovakia, a comparison of very limited observational data on a few days shows reasonably good agreement by both models, with better agreement on ob-served peak O3concentrations on 6–7 July and minimal nighttime O3 concentrations on 8–9 July by WRF/Chem-MADRID. The observed maximum 8-h O3 levels are well reproduced but largely underpredicted by WRF/Polyphemus at Sommet Puy-de-D ˆome
20
and Ispra. At Celje and Topolniky, while WRF/Chem-MADRID better captures higher max 8-h O3 values (>100 µg m−3) on some days, WRF/Polyphemus better captures
moderate O3values (80–100 µg m−3) on some days, but neither reproduce lower
maxi-mum 8-h O3values (<80 µg m−3) at Celje, due mainly to underpredictions of NOx(thus
insufficient titration of O3) at this site.
25
In the southern latitude band (38–43◦N), observed O
3 levels are overpredicted by
ACPD
13, 4059–4125, 2013Application of WRF/Chem-MADRID
& WRF/Polyphemus in Europe
Y. Zhang et al.
Title Page
Abstract Introduction
Conclusions References
Tables Figures
◭ ◮
◭ ◮
Back Close
Full Screen / Esc
Printer-friendly Version
Interactive Discussion
Discussion
P
a
per
|
Dis
cussion
P
a
per
|
Discussion
P
a
per
|
Discussio
n
P
a
per
|
Ermesinde in Portugal and Avenida Gasteiz in Spain in terms of both daily and hourly variations and magnitudes, despite overpredictions on some days by both models with greater overpredictions on more days by WRF/Chem-MADRID. For maximum 8-h O3, large overpredictions occur on most days at all sites, in particular, by WRF/Chem-MADRID at Beato and Avenida Gasteiz and by both models at Cust ´oias and
Er-5
mesinde.
Figure 7 shows simulated and observed hourly concentrations of PM2.5 and PM10 at four sites where hourly data are available. At Kallio, an urban background site in Helsinki, the capital of Finland, the observed PM2.5 and PM10 concentrations are 9.9 and 20.4 µg m−3for monthly average and can be up to 35.5 and 369.2 µg m−3,
respec-10
tively. Anthropogenic emissions of PM2.5 and their gaseous precursors in Finland are low as compared with the more polluted regions in Europe (EMEP, 2006a, b). 50–70 % of the PM2.5 mass in the urban areas in Helsinki originates from LRT of high PM con-centrations from several countries such as Estonia, Latvia, Lithuania, Russia, Belarus, Ukraine, and/or Poland where pollutant emissions from various sources (e.g. energy
15
production, traffic, industry, residential burning, and open biomass burning) are high (Vallius et al., 2003; Karppinen et al., 2004; Sogacheva et al., 2005; Kauhaniemi et al., 2007; van Aardenne et al., 2007). However, the extremely high PM10 concentrations observed on 25 July at this site are most likely due to the resuspension of road dust particles, because road dust is a significant source of mineral particles in urban
ar-20
eas of Finland (Pakkanen et al., 2001; Kupiainen and Tervahattu, 2004; Putaud et al., 2004; Tervahattu et al., 2006; Anttila and Salmi, 2006). WRF/Polyphemus generally re-produces hourly PM2.5concentrations well, whereas WRF/Chem-MADRID significantly overpredicts it due likely to several factors. First, the concentrations of gaseous precur-sors of secondary PM2.5 (e.g. SO2−
4 , NH
+
4, and NO−3) such as SO2, NH3, and HNO3 25
ACPD
13, 4059–4125, 2013Application of WRF/Chem-MADRID
& WRF/Polyphemus in Europe
Y. Zhang et al.
Title Page
Abstract Introduction
Conclusions References
Tables Figures
◭ ◮
◭ ◮
Back Close
Full Screen / Esc
Printer-friendly Version
Interactive Discussion
Discussion
P
a
per
|
Dis
cussion
P
a
per
|
Discussion
P
a
per
|
Discussio
n
P
a
per
|
be lower than those of WRF/Polyphemus. Third, the wet scavenging rates calculated in WRF/Chem-MADRID may be lower than those in WRF/Polyphemus. The observed hourly PM10concentrations are significantly underpredicted by WRF/Polyphemus due to neglect of road dust emissions in the EMEP inventories and much better reproduced by WRF/Chem-MADRID due to inclusion of online soil dust emissions and higher
sea-5
salt concentrations even though underpredictions remain on most days. Neither model reproduces several extremely high PM10episodes (>100 µg m−3) during 7, 12, 25, and
30 July, due to missing of the emission sources from road dust in the EMEP inventories. The main sources of PM10in the UK in 2001 include road transport emissions (in par-ticular, exhaust gases from diesel engines), other sectors such as solvent processes,
10
agriculture, and waste treatment, industrial processes (e.g. the production of metals, cement, lime, coke and chemicals, bulk handling of dusty materials, construction, min-ing and quarrymin-ing), commercial, domestic and agricultural combustion (e.g. mainly of coal and solid fuels), industrial combustion, and energy industries (i.e. power genera-tion) (MacCarthy et al., 2012). Observed and simulated PM2.5and PM10concentrations
15
at three sites are shown in Fig. 7. The urban background site, London Bloomsbury, located in central London, is surrounded by a busy two-lane one-way road system and subject to frequent congestion. It has the highest PM2.5 and PM10 concentra-tions among the three sites in the UK The observed PM2.5 and PM10 concentrations at this site are 14.5 and 32.9 µg m−3 for monthly average and can be up to 99 and
20
137 µg m−3, respectively. WRF/Polyphemus generally reproduces hourly PM
2.5
con-centrations in terms of daily variations and magnitudes, whereas WRF/Chem-MADRID significantly overpredicts the concentrations in early and late July. Despite underpre-dictions in the first half of July and overpreunderpre-dictions in late July, WRF/Chem-MADRID gives much higher PM10 concentrations thus better agreement with observations than
25