ACPD
13, 4963–4988, 2013Changes in physical properties during Saharan advections
over Rome
G. P. Gobbi et al.
Title Page
Abstract Introduction
Conclusions References
Tables Figures
◭ ◮
◭ ◮
Back Close
Full Screen / Esc
Printer-friendly Version Interactive Discussion
Discussion
P
a
per
|
Dis
cussion
P
a
per
|
Discussion
P
a
per
|
Discussio
n
P
a
per
|
Atmos. Chem. Phys. Discuss., 13, 4963–4988, 2013 www.atmos-chem-phys-discuss.net/13/4963/2013/ doi:10.5194/acpd-13-4963-2013
© Author(s) 2013. CC Attribution 3.0 License.
Atmospheric Chemistry and Physics
Open Access
Discussions
Geoscientiic Geoscientiic
Geoscientiic Geoscientiic
This discussion paper is/has been under review for the journal Atmospheric Chemistry and Physics (ACP). Please refer to the corresponding final paper in ACP if available.
Changes in particulate matter physical
properties during Saharan advections
over Rome (Italy): a four-year study,
2001–2004
G. P. Gobbi1, F. Angelini1,*, F. Barnaba1, F. Costabile1, J. M. Baldasano2,3, S. Basart2, R. Sozzi4, and A. Bolignano4
1
Institute of Atmospheric Sciences and Climate, ISAC-CNR, Rome, Italy
2
Barcelona Supercomputing Centre – Centro Nacional de Supercomputaci ´on (BSC-CNS), Barcelona, Spain
3
Environmental Modelling Laboratory, Technical University of Catalonia, Barcelona, Spain
4
Latium Environmental Protection Agency (ARPA Lazio), Rome, Italy
*
now at: the Italian National Agency for New Technologies, Energy and Sustainable Economic Development, ENEA, Frascati, Italy
Received: 31 December 2012 – Accepted: 3 February 2013 – Published: 20 February 2013
Correspondence to: G. P. Gobbi ([email protected])
ACPD
13, 4963–4988, 2013Changes in physical properties during Saharan advections
over Rome
G. P. Gobbi et al.
Title Page
Abstract Introduction
Conclusions References
Tables Figures
◭ ◮
◭ ◮
Back Close
Full Screen / Esc
Printer-friendly Version Interactive Discussion
Discussion
P
a
per
|
Dis
cussion
P
a
per
|
Discussion
P
a
per
|
Discussio
n
P
a
per
|
Abstract
Particulate matter mass concentrations measured in the city of Rome (Italy) in the pe-riod 2001–2004 have been cross-analysed with concurrent Saharan dust advection events to infer the impact these natural episodes bear on the standard air quality pa-rameter PM10 observed at two city stations and at one regional background station.
5
Natural events as Saharan dust advections are associated to a definite health risk. At the same time, the Directive 2008/50/EC allows subtraction of PM exceedances caused by natural contributions from statistics used to determine air-quality of EU sites. In this respect, it is important to detect and characterize such advections by means of reliable, operational techniques. To assess the PM10 increase we used both the 10
“regional-background method” suggested by EC Guidelines and a “local background” one, demonstrated to be most suited to this central Mediterranean region. The two approaches provided results within 20 % from each other.
The sequence of Saharan advections over the city has been either detected by Po-larization Lidar (laser radar) observations or forecast by the operational numerical re-15
gional mineral dust model BSC-DREAM8b of the Barcelona Supercomputing Centre. Lidar observations were also employed to retrieve the average physical properties of the dust clouds as a function of height. Along the four-year period, Lidar measurements (703 evenly distributed days) revealed Saharan plumes transits over Rome on 28.6 % of the days, with minimum occurrence in wintertime. Dust was observed to reach the 20
ground on 17.5 % of the days totalling 88 episodes. Most (90 %) of these advections lasted up to 5 days, averaging to∼3 days. Median time lag between advections was
7 days. Typical altitude range of the dust plumes was 0–6 km, with centre of mass at
∼3 km a.g.l. BSC-DREAM8b model simulations (1461 days) predicted Lidar detectable
(532nm extinction coefficient>0.005 km−1) dust advections on 25.9 % of the days, with 25
ACPD
13, 4963–4988, 2013Changes in physical properties during Saharan advections
over Rome
G. P. Gobbi et al.
Title Page
Abstract Introduction
Conclusions References
Tables Figures
◭ ◮
◭ ◮
Back Close
Full Screen / Esc
Printer-friendly Version Interactive Discussion
Discussion
P
a
per
|
Dis
cussion
P
a
per
|
Discussion
P
a
per
|
Discussio
n
P
a
per
|
detection of the presence of dust coincided on 80 % of the cases, 92 % coincidences are found within a±1-day window.
Combination of the BSC-DREAM8b and Lidar records leads to about 21 % of the days being affected by presence of Saharan dust at the ground. This combined dataset has been used to compute the increase in PM with respect to dust-unaffected previous 5
days. This analysis has shown Saharan dust events to exert a meaningful impact on the PM10 records, causing average increases of the order of 11.9 µg m−
3
. Conversely, PM10 increases computed relying only on the Lidar detections (i.e., presence of dust layers actually observed) were of the order of 15.6 µg m−3. Both analyses indicate the annual average contribution of dust advections to the city PM10mass concentrations to 10
be of the order of 2.35 µg m−3. These results confirm Saharan advections in the central Mediterranean as important modulators of PM10loads and exceedances.
1 Introduction
Mass concentration (µg m−3) of particulate matter smaller than 10 micrometers in aero-dynamic diameter (PM10) is one of the parameters widely employed to assess air
qual-15
ity. In this respect, the current European Union (EU) air quality directive 2008/50/EC (EC, 2008) allows no more than 35 exceedances per year of the daily-average thresh-old of 50 µg m−3. At the same time, the PM10 yearly average should not exceed
40 µg m−3. Considering the high levels of PM
10observed in the largest European cities
and the sometimes high values of background PM10 levels (e.g., Putaud et al., 2004;
20
Yttri and Aas, 2006; Querol et al., 2009a; Mol et al., 2011), these limits might result as rather stringent. The directive 2008/50/EC, also allows for subtraction of the natu-ral aerosol contributions to the monitored PM10 levels after assessing their origin and
amount. Methods to implement such an assessment are summarized in the EC Guide-lines on the quantification of the contribution of natural sources under the EU Air Quality 25
ACPD
13, 4963–4988, 2013Changes in physical properties during Saharan advections
over Rome
G. P. Gobbi et al.
Title Page
Abstract Introduction
Conclusions References
Tables Figures
◭ ◮
◭ ◮
Back Close
Full Screen / Esc
Printer-friendly Version Interactive Discussion
Discussion
P
a
per
|
Dis
cussion
P
a
per
|
Discussion
P
a
per
|
Discussio
n
P
a
per
|
sources can be rather strong, it is important to create effective tools to evaluate such contributions to PM levels.
In Mediterranean Europe, the natural phenomenon which mostly affects PM concen-trations is the frequent transport of large quantities of mineral dust from the nearby Sahara desert (e.g., Moulin et al., 1998; Rodriguez et al.; 2001, Barnaba and Gobbi, 5
2004, Mitsakou et al., 2008, Querol et al., 2009b, Basart et al., 2012a; Pay et al., 2012). In the central and western Mediterranean, such outflow of mineral dust reaches its maximum between Spring and Autumn, while minimizing in winter (e.g., Barnaba and Gobbi, 2004; Basart et al., 2009; Pey et al., 2012). In the year 2001, satellite ob-servations showed Saharan dust advections to affect an average 26 % of the central 10
Mediterranean surface area (Barnaba and Gobbi, 2004). In that year, Saharan dust advections observed in Rome by our polarization Lidar extended typically from ground up to 6 km a.s.l. (Gobbi et al., 2004a), and were estimated to increase the urban PM10
loads by an average 19±15 µg m−3(Gobbi et al., 2007). These advections were
ob-served to originate mostly from the desert regions of southern Tunisia and to bear 15
negative health effects on the city population (Mallone et al., 2011).
On a yearly basis, the Saharan emissions transported to the Mediterranean coasts increase the local PM10 loads by a few µg m−
3
(e.g., Querol et al., 2009b; Pey et al., 2012). Single events can however increase the PM10loads by tens to hundreds µg m−3, potentially affecting the number of exceedances of the EU limits (e.g., Rodriguez et al., 20
2001; Gobbi et al., 2007; Perrino et al., 2009; Pey et al., 2012). In a quantitative study conducted by particle-induced X-ray emission techniques (PIXE), Nava et al. (2012) found Saharan advections contribution to PM10 samples collected in Tuscany (central Italy) to range between 3 and 30 µg m−3. Such high levels of natural PM loads imply that, at least in the Mediterranean regions, validated model-based Saharan dust fields 25
ACPD
13, 4963–4988, 2013Changes in physical properties during Saharan advections
over Rome
G. P. Gobbi et al.
Title Page
Abstract Introduction
Conclusions References
Tables Figures
◭ ◮
◭ ◮
Back Close
Full Screen / Esc
Printer-friendly Version Interactive Discussion
Discussion
P
a
per
|
Dis
cussion
P
a
per
|
Discussion
P
a
per
|
Discussio
n
P
a
per
|
This study provides a characterization of Saharan advections and an evaluation of their impact on the PM10mass concentration in the city of Rome, Italy, one of the largest
metropolitan areas in Mediterranean Europe. Time and altitude characterization will be based on model forecasts and polarization Lidar observations, while changes in PM10 will be computed considering average PM10loads recorded in Rome air-quality stations
5
prior and during the dust events. The method to estimate such impact of Saharan dust on PM10 loads will be optimized for the conditions encountered at this central Mediterranean region.
2 Methods
To determine the days affected by the presence of Saharan air masses over the city 10
we employ dust model forecasts and polarization Lidar observations. The increase in PM concentrations due to the advection of Saharan dust is then computed as the dif-ference between the average PM10 loads during the Saharan event and the 5–7 day average PM10 level before the episode for each urban air-quality station. This section
describes the methods employed to measure PM10 (2.1), to infer the presence of
Sa-15
haran advections (2.2 and 2.3) and to determine their contribution to PM10 (2.4).
2.1 PM10 measurements
The PM10records utilized here were collected at three stations run by ARPA Lazio, the
environmental protection agency in charge of the air quality monitoring in the Latium re-gion. Two of the stations, Magna Grecia (MG, 41.88◦N–12.51◦E, 49 m a.s.l.), and Villa 20
Ada (VA, 41.93◦N–12.51◦E, 50 m a.s.l.) are located in central Rome, while the third one is situated at Fontechiari (FC, 41.67◦N–13.67◦E, 388 m a.s.l.), about 70 km SE of Rome. Stations type can be defined as: “urban traffic” for MG, “urban background” for VA, and “regional background” for FC. PM10 mass concentration was measured by
means of Philips Environment MP-101-M, beta-gauge analyzers, performing two PM10
ACPD
13, 4963–4988, 2013Changes in physical properties during Saharan advections
over Rome
G. P. Gobbi et al.
Title Page
Abstract Introduction
Conclusions References
Tables Figures
◭ ◮
◭ ◮
Back Close
Full Screen / Esc
Printer-friendly Version Interactive Discussion
Discussion
P
a
per
|
Dis
cussion
P
a
per
|
Discussion
P
a
per
|
Discussio
n
P
a
per
|
average mass readings per hour. After quality check, the readings were averaged to provide the daily mean values employed in our study.
2.2 The VELIS Lidar
Polarization Lidar (laser radar) measurements are employed here to detect and charac-terize Saharan dust events. This Vehicle-Mountable Lidar System (VELIS) was located 5
at the ISAC Rome laboratories (41.84◦N–12.65◦E, 130 m a.s.l.), in a semi-rural area approximately 12 km South-East of the city centre. An extended description of the Lidar system and of the relevant data analysis to derive aerosol extinction is given in Gobbi et al. (2004). Here we briefly recall that VELIS employs a frequency-doubled Nd:YAG laser, emitting 532 nm, plane-polarized, 30 mJ pulses at 10 Hz. Two co-located tele-10
scopes, allow to collect a full backscatter profile between∼300 m and 14 km from the
ground, with a vertical resolution of 37.5 m. Overlap correction allows to reconstruct the aerosol profile down to 100 m a.g.l. Typical averaging time of each profile is 10 min. Output of the VELIS measurement are tropospheric profiles of aerosol backscatter
βa(z) and extinction σa(z) coefficients, plus depolarization ratio Da(z), all determined
15
at the laser wavelength. The aerosol depolarizationDa=(βa⊥)/(βa//), i.e., the ratio of the aerosol-induced cross-polarized backscatter signal (βa⊥) to the parallel-polarized one (βa//) is a good indicator of the shape of the scattering particles (e.g., Sakai et al., 2010). In fact, spherical particles (as liquid aerosols) do not change the polar-ization plane of the laser beam they backscatter, while non-spherical ones (as dust 20
particles or ice crystals) introduce a marked degree of depolarization. While for conti-nental type aerosols VELIS typically observes depolarizationDc<10 %, in the case of
pure Saharan dust close to the source it measured an average depolarizationDd∼41 %
(e.g., Gobbi et al., 2000). In Rome, dust advections typically show 15 %< Dd<30 %.
In the absence of aerosols, i.e., in pure molecular backscatter, the system measures 25
Dm∼1 %. Aerosol depolarization Da is therefore considered an excellent marker for
ACPD
13, 4963–4988, 2013Changes in physical properties during Saharan advections
over Rome
G. P. Gobbi et al.
Title Page
Abstract Introduction
Conclusions References
Tables Figures
◭ ◮
◭ ◮
Back Close
Full Screen / Esc
Printer-friendly Version Interactive Discussion
Discussion
P
a
per
|
Dis
cussion
P
a
per
|
Discussion
P
a
per
|
Discussio
n
P
a
per
|
is determined as coinciding with regions whereDaincreases above 10 %. Dust
contri-bution to the extinction is then estimated by weighing the aerosol extinction coefficient by the ratio Da/41 %. Since “pure” dust depolarization can happen to be lower than
41 % (e.g., Sakai et al., 2010), this approach provides a lower limit to the retrieved dust extinction coefficient. The VELIS schedule included 2 to 6 profiles per day (depend-5
ing on sky conditions) collected at non-synchronous times between 07:00 a.m. and 09:00 p.m. (UTC). In the period January 2001–December 2004 the observations cov-ered about 50 % of the days. In particular, VELIS was deployed in field campaigns (and therefore did not operate in Rome) in January 2001, from mid July to mid September 2002 (Gobbi et al., 2004b), and during short periods in July 2003 (Tafuro et al., 2006) 10
and August–September 2004 (Barnaba et al., 2007; Highwood et al., 2007). These dates are therefore missing in the present lidar record. Overall, 703 daily profiles have been employed in this study, with a mean number measurement-days per month of 15±6.
2.3 The BSC-DREAM8b model 15
The BSC-DREAM8b model (Nickovic et al., 2001; P ´erez et al., 2006a, b; Basart et al., 2012b) simulates the 3-dimensional field of dust concentration in the troposphere and takes into account all major processes of dust life, such as dust emission, horizontal and vertical diffusion and advection and wet and dry deposition. It also includes the effects of the particle size distribution on aerosol dispersion. The model numerically 20
solves the Euler-type partial differential non-linear equation for dust mass continuity, and it is fully embedded as one of the governing prognostic equations in the atmo-spheric NCEP/Eta model.
The main features of BSC-DREAM8b are a source function based on the arid and semi-arid categories of the 1 km USGS land use dataset, a 8-bin particle size dis-25
ACPD
13, 4963–4988, 2013Changes in physical properties during Saharan advections
over Rome
G. P. Gobbi et al.
Title Page
Abstract Introduction
Conclusions References
Tables Figures
◭ ◮
◭ ◮
Back Close
Full Screen / Esc
Printer-friendly Version Interactive Discussion
Discussion
P
a
per
|
Dis
cussion
P
a
per
|
Discussion
P
a
per
|
Discussio
n
P
a
per
|
and as dust research tools in North Africa and the Mediterranean (e.g. Amiridis et al., 2009; Papanastasiou et al., 2010; Marinou et al., 2012). Several evaluation studies outlined the good skills of BSC-DREAM8b concerning both the horizontal and vertical extend of the dust plume in the Mediterranean Basin for a single dust event (P ´erez et al., 2006a,b; Haustein et al., 2009; Papanastasiou et al., 2010) and over longer time 5
periods (Kishcha et al., 2007; Pay et al., 2012; Basart et al., 2012b).
The present analysis includes a dust simulation of BSC-DREAM8b for the period from 1 January 2001 to 31 December 2004 on hourly basis. The initial state of dust concentration in the BSCDREAM8b model is defined by the 24-h forecast from the previous-day model run. The NCEP/FNL Reanalysis-II (at 1◦×1◦) at 00:00 UTC are
10
used as initial conditions and boundary conditions at intervals of 6 h. The resolution is set to 1/3 in the horizontal and to 24 layers extending up to approximately 15 km in the vertical. The domain of simulation covers northern Africa, Middle East and Europe.
The BSC-DREAM8b output analyzed here consists of 1-h time resolution forecasts of dust advections transiting over Rome, so that the entire dataset is made of over 15
35 000 records. The data provided are: dust load, dust concentration and PM10 at the
surface, 550 nm AOD and extinction coefficient at 24 levels (from 86 to 15000 m a.s.l.). Since these levels are not equally spaced, the values were averaged over a regular, 1 km-thick vertical grid. The dust load, surface concentration and extinction coefficient records from the BSC-DREAM8b model show continuous distributions, with a large 20
occurrence of small, but non null, values. For this reason, these time series show “ab-solute dust-free conditions” to occur in less than 2 % of cases. This makes difficult to perform a direct comparison with the Lidar data. In order to do so a screening process was introduced.
An advection, whatever its altitude, is counted when BSC-DREAM8b simulations pre-25
dicted the presence over the city of “Lidar detectable” (532 nm Extinction>0.005 km−1)
ACPD
13, 4963–4988, 2013Changes in physical properties during Saharan advections
over Rome
G. P. Gobbi et al.
Title Page
Abstract Introduction
Conclusions References
Tables Figures
◭ ◮
◭ ◮
Back Close
Full Screen / Esc
Printer-friendly Version Interactive Discussion
Discussion
P
a
per
|
Dis
cussion
P
a
per
|
Discussion
P
a
per
|
Discussio
n
P
a
per
|
considering a Lidar sensitivity of 0.005 km−1 up to 6 km and 0.01 km−1 above, have been classified as “dust cases” only those profiles where the average extinction ex-ceeds the Lidar-derived threshold at least in one layer. In such way, a total of 9084 dust layers have been detected in the BSC-DREAM8b record, with a time incidence (days per year) of about 26 %.
5
2.4 Determining dust-driven PM10increase
Operational evaluation of the PM10 increase due to Saharan advections is commonly performed by subtracting a “background” value from the PM10 load during the dust
event. Current EU guidelines (EC, 2011), suggest to calculate such an increase at a regional background station and to use this value for all the PM10monitoring sites in 10
that region. In this approach, the background is computed by averaging the PM10load
at the regional background station in the 15-day period preceding and following the event (EU, 2011). This method was originally developed and optimized for the Iberian Peninsula (Escudero et al., 2007).
In our previous work (Gobbi et al., 2007) we choose to compute background and dust 15
PM10loads at each station being considered, averaging the background over the 15-day period preceding the event. In this work, the best PM10averaging period over which
to evaluate background conditions has been defined after exploring the behaviour of meteorological variables and of PM10 loads at various stations during the Saharan advection events. Our starting assumption being: the best estimate of the dust PM10
20
component during a Saharan advection should be measured against the PM10 load
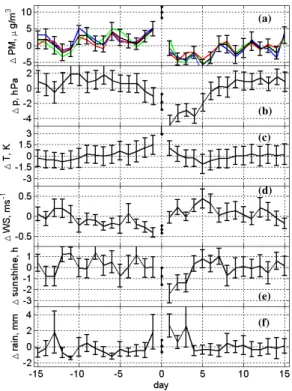
averaged along the shortest number of days preceding the event at the very same station. Figure 1 reports the daily variation of meteorological and PM10parameters with
respect to their average in the 15-day time span preceding and following all the dust advections encountered in the 4-year study. Error bars represent the 95 % confidence 25
ACPD
13, 4963–4988, 2013Changes in physical properties during Saharan advections
over Rome
G. P. Gobbi et al.
Title Page
Abstract Introduction
Conclusions References
Tables Figures
◭ ◮
◭ ◮
Back Close
Full Screen / Esc
Printer-friendly Version Interactive Discussion
Discussion
P
a
per
|
Dis
cussion
P
a
per
|
Discussion
P
a
per
|
Discussio
n
P
a
per
|
At all stations, PM10 mass concentrations (Fig. 1a) follow a rather similar behaviour,
showing a systematic increase during the six days preceding the events and a de-crease during the five days following it. The same pattern is recorded at urban stations (MG and VA), as well as at the regional background one (FC). Such pattern is found to be anti-correlated with respect to wind (Fig. 1d), and precipitation (Fig. 1f), two me-5
teorological drivers of PM10 concentration. Conversely, it is correlated with respect to
pressure (Fig. 1b), temperature (Fig. 1c) and sunshine (Fig. 1e). The picture resulting from such comparison indicates a systematic accumulation of PM10 due to stagnation and low precipitation in the five days preceding the events, (2) increasing wind, precip-itation, and temperature, i.e., conditions favouring removal of PM, during the events, 10
and (3) return to pre-advection conditions some 6–8 days past the event.
The previous results indicate that averaging PM10 over the –15 to +15 period
across the Saharan advections (as the EU guidelines suggest) provides a lower PM10background than averaging over the 15 days before the events (as in Gobbi et al., 2007). However, both these approaches include PM10conditions rather dissimilar
15
from the ones the Saharan events build upon. In particular, employing the data fol-lowing the event may introduce a bias due to the highly probable presence of rain in the 4-day period along the events. One further parameter to consider is the typical lag between advections. In our case, mean and median time lags between the observed 83 non-wintertime advections (out of the total 88 ones) were 9.2 and 7 days, respec-20
tively. Choosing longer averaging times may then introduce biases due to contiguous events. Therefore, the 9-day period preceding the events results to be a preferable range to evaluate such background conditions in this central Mediterranean region. In this time span, choice of the averaging length must then be a trade-offbetween statis-tical significance and closeness to the event. For these reasons we decided to restrict 25
the averaging period to the 7–5 days (depending on data availability) preceding each advection event. The weekly PM10cycle present at all stations was evaluated to impact
ACPD
13, 4963–4988, 2013Changes in physical properties during Saharan advections
over Rome
G. P. Gobbi et al.
Title Page
Abstract Introduction
Conclusions References
Tables Figures
◭ ◮
◭ ◮
Back Close
Full Screen / Esc
Printer-friendly Version Interactive Discussion
Discussion
P
a
per
|
Dis
cussion
P
a
per
|
Discussion
P
a
per
|
Discussio
n
P
a
per
|
To support our choice of evaluating Saharan dust loads employing same station background and in-dust PM10mass concentrations (local approach) we compared dust
load estimates made at various sites in the Rome region. In particular, we evaluated the mean bias and root mean square (RMS) difference between the dust load esti-mates performed at the regional background station of Fontechiari (FC) with respect to 5
equivalent estimates performed at the two city stations of VA and MG, and at the two other regional background stations of Allumiere (located some 50 km NW of Rome at 500 m a.s.l.), and of Leonessa (located some 70 km NE of Rome at 950 m a.s.l.). The relevant results are reported in Table 1. In spite of a smaller bias present between back-ground stations, these comparisons show no significant changes in RMS differences 10
and in standard deviations of background or city stations with respect to FC. In this respect, regional background stations do not seem to show with respect to FC a more coherent estimate of dust contribution to PM10than urban stations do. We interpret this
as supporting the local station approach. In this respect, next sections will also show that the estimates performed by the two methods are well within their variability bars. 15
While suffering of the larger variability of PM loads at urban sites (e.g., the daily cy-cle discussion above), this approach provides additional information about the spatial variability of Saharan dust clouds.
According to Fig. 1, the shorter averaging time employed in this analysis tends to provide a higher value of the background PM10 load with respect to EC (2011), and 20
consequently a lower (by about 2.5 µg m−3in this dataset), more conservative, estimate of the increase due to the advection. Overall, choice of the averaging time to evaluate “background” PM10 loads is found to be an important condition in the estimate of the increase due to Saharan dust advections. Meteorological parameters as well as other modulators of PM10loads as the weekly cycle, should definitely be considered in such
25
ACPD
13, 4963–4988, 2013Changes in physical properties during Saharan advections
over Rome
G. P. Gobbi et al.
Title Page
Abstract Introduction
Conclusions References
Tables Figures
◭ ◮
◭ ◮
Back Close
Full Screen / Esc
Printer-friendly Version Interactive Discussion
Discussion
P
a
per
|
Dis
cussion
P
a
per
|
Discussion
P
a
per
|
Discussio
n
P
a
per
|
3 Results
3.1 Saharan dust episodes statistics
The VELIS Lidar dataset consists of 703 measurement-days, with 197 days with Sa-haran event detected. In the same days, BSC-DREAM8b forecasted 248 dust events with extinction coefficient>0.005 km−1(26 % more than VELIS), 158 of which coincide 5
in time with the Lidar-observed ones. Overall, 80 % of the VELIS observations of dust coincide in time with the BSC-DREAM8b forecasts, 92 % fall within one day, and 96 % within 3 days of the BSC-DREAM8b forecasts.
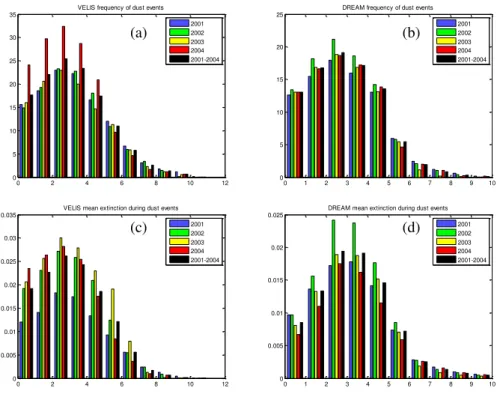
The vertical distribution of the dust layers constitutes an important information in terms of both air quality and climate impacts. Figure 2 depicts the statistics of such 10
parameter (1-km altitude bins) as retrieved by the VELIS Lidar (left column) or modelled by BSC-DREAM8b (right column). Fig. 2a and b report the frequency of Saharan dust presence in at least one altitude bin. Figure 2c and d quantify the bin average extinction coefficient (km−1 at 532 nm) during such events. Both frequency plots maximize at 2– 3 km (25 % VELIS and 18 % BSC-DREAM8b). At the ground, VELIS retrieves dust 15
presence on about 17.5 % of the days, while BSC-DREAM8b forecasts it on 13 %. In both the VELIS and BSC-DREAM8b extinction statistics, the centre of mass of the extinction profile is found at approximately 3 km altitude. It is found from the Lidar record that the altitude seasonal (DJF, MAM, JJA, SON) sequence of this centre of mass is 2.6, 3.2, 3.2 and 2.8 km, respectively.
20
Average extinction values reported in Figure 2d and e are referred to the overall ad-vections frequency (28.6 %), i.e., it counts as zero the absence of dust at one level while an event is triggered at another level. To evaluate the average extinction of Saharan plumes we need to refer to the actual frequency of dust layers at the level addressed (Figure 2a and b). The multiplying conversion factors (ratios between the overall ad-25
ACPD
13, 4963–4988, 2013Changes in physical properties during Saharan advections
over Rome
G. P. Gobbi et al.
Title Page
Abstract Introduction
Conclusions References
Tables Figures
◭ ◮
◭ ◮
Back Close
Full Screen / Esc
Printer-friendly Version Interactive Discussion
Discussion
P
a
per
|
Dis
cussion
P
a
per
|
Discussion
P
a
per
|
Discussio
n
P
a
per
|
typical dust event extinction to be rather constant (0.029±0.023 km−1) up to 6 km
alti-tude.
By employing the dust extinction-to-mass conversion of Barnaba and Gobbi (2004) for 2.5 g cm−3 density particles, we obtain an extinction to mass ratio of the order of 1.36 m−2g−1. This factor would lead to an average mass content during the events of 5
the order of 22±18 µg m−3. This is the typical increase in total PM (TSP) expected to
occur over the 62 days/year when Saharan advections are observed at the ground level bin by the VELIS Lidar (Fig. 2a). The same computation applied to the BSC-DREAM8b extinction record would lead to an average increase of 12 µg m−3. On a yearly basis,
the dust contribution to PM (TSP) evaluated by VELIS and BSC-DREAM8b is of 3.9 10
and 1.6 µg m−3, respectively.
On average, the Saharan advections observed by the ISAC-CNR Lidar over the four-year period lasted 3 days. About 35 % of the events lasted one day and 10 % lasted over 5 days. Only 0.5 % (i.e., once every two years) reached the duration of two weeks. Table 2 summarizes the statistical properties of the dust advections as retrieved by 15
means of VELIS in terms of percent of days in which dust was detected at any level or at ground level, plus average and standard deviation of dust optical depth (532 nm AOD). Overall, the data shows that some 100 days per year were affected by Saharan dust transiting over Rome, while dust reached the ground on about 60 days per year. In terms of AOD, the typical optical depth during these Saharan events is of the order 20
of 0.13±0.11. Considering again an average extinction coefficient of 0.03 km−1 this
converts (Barnaba and Gobbi, 2004) into an average column load of 96±81 µ g/m2in
the VELIS statistics and of 59±66 µ g/m2in the BSC-DREAM8b one.
3.2 The impact of dust on PM10records
This analysis is performed using as indicators of dust presence at the ground either 25
ACPD
13, 4963–4988, 2013Changes in physical properties during Saharan advections
over Rome
G. P. Gobbi et al.
Title Page
Abstract Introduction
Conclusions References
Tables Figures
◭ ◮
◭ ◮
Back Close
Full Screen / Esc
Printer-friendly Version Interactive Discussion
Discussion
P
a
per
|
Dis
cussion
P
a
per
|
Discussion
P
a
per
|
Discussio
n
P
a
per
|
non-dust PM loads, while the second fosters a “verified” assessment of dust presence when evaluating the PM10changes.
Table 3 reports the statistics of PM10 changes observed during dust episodes at the
three air quality stations addressed in this work. Observations cover at least 91 % of the 1417 days enclosed in the 2001-2004 period (line 1). Union of the BSC-DREAM8b 5
and VELIS dust records increases the frequency of dust presence at the ground to 20– 21 % (line 3). The average PM10 levels (line 4) and the number of exceedances of the
50 µg m−3limit (line 7) at the three stations reflect their type, with MG above the yearly EU limits of 40 µg m−3and 3550 µg m−3exceedances, respectively. The yearly average increase due to Saharan advections (line 6) ranges between 1.9 and 2.5 µg m−3, right 10
within the range estimated by means of the VELIS profiles and BSC-DREAM8b fore-casts. In this respect, it is important to repeat that the estimates based on extinction data concern the TSP (total suspended particles) rather than PM10, and that in the
case of Saharan dust PM10is expected to be of the order of 60–75 % of TSP (e.g., Ozer et al., 2006).
15
Magna Grecia is the site exceeding both the maximum average (40 µg m−3) and number (35) recommended PM10 yearly limits. Even though Saharan advections are responsible of 26 % of these exceedances (line 9), their subtraction would not reduce the number below the threshold of 35. Conversely, subtracting the dust contribution to yearly PM10 mass brings this average close to the 40 µg m−3limit. The other two sites
20
(VA and FC) do not surpass EU yearly limits. It is however important to notice that between 32 and 43 % of the exceedances at these locations is attributable to Saharan advections.
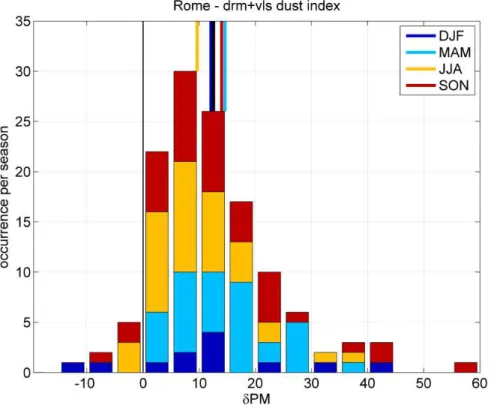
The average PM10change attributable to the events of the VELIS+BSC-DREAM8b
dataset is reported at line 10. The relevant seasonal frequency distribution of the 25
PM10change for the two city stations of MG and VA is plotted in Fig. 3. These results show the quite large variability of both events number and dust contributions to PM10
ACPD
13, 4963–4988, 2013Changes in physical properties during Saharan advections
over Rome
G. P. Gobbi et al.
Title Page
Abstract Introduction
Conclusions References
Tables Figures
◭ ◮
◭ ◮
Back Close
Full Screen / Esc
Printer-friendly Version Interactive Discussion
Discussion
P
a
per
|
Dis
cussion
P
a
per
|
Discussion
P
a
per
|
Discussio
n
P
a
per
|
and rather low average loads (of the order of 10 µg m−3) in summer, and (2) the pres-ence of negative changes, i.e., average PM10 are lower during the events with respect
to previous days. This latter point is explained by the disappearing of negative loads (line 13 with respect to line 12), when the VELIS record alone is employed to assess the occurrence of dust advection events. Erroneous advections forecast and/or rainout 5
effects are the likely cause of such conditions. In this Lidar framework, PM10increases per event are 20–40 % larger (line 14) while the average yearly increase remains of the order of 2.7 µg m−3due to the lower frequency of the events in this record. Unfortu-nately, VELIS observations cover only 50 % of the time period and cannot be used for air quality purposes as indicated by the EU Guidelines (EC, 2010).
10
As mentioned, results in this section were obtained applying the “local background method”. This was shown in Section 2.4 to be better suited than the “regional back-ground” one to our central Mediterranean region. However, it is worth mentioning that for the regional background station of Fontechiari, use of the two averaging methods brings to estimates of the impact of Saharan dust PM10 loads within 20 % from each 15
other (9.15 vs. 10.81 µg m−3, respectively).
4 Conclusions
A four-year (2001–2004) database of PM10 mass concentrations, together with
mod-elled and observed Saharan dust advection events have been used to evaluate the impact of Saharan dust on the PM10 mass concentrations in the city of Rome, Italy. 20
In this period, BSC-DREAM8b model forecasts and Lidar observations indicate that advection of Saharan dust crossed over Rome on 26 % and 29 % of the days, respec-tively. These events occurred mostly between March and November. Advection to the ground, possibly affecting the PM10levels, was expected to take place on 13 and 18 %
of the days, respectively. 25
Analysis of the meteorological parameters and of PM10 loads accompanying
ACPD
13, 4963–4988, 2013Changes in physical properties during Saharan advections
over Rome
G. P. Gobbi et al.
Title Page
Abstract Introduction
Conclusions References
Tables Figures
◭ ◮
◭ ◮
Back Close
Full Screen / Esc
Printer-friendly Version Interactive Discussion
Discussion
P
a
per
|
Dis
cussion
P
a
per
|
Discussion
P
a
per
|
Discussio
n
P
a
per
|
to define the “background” PM10level is represented by the 7 days preceding the event
rather than the±15 days suggested by the EU Guidelines (EC, 2011). However, for the
regional background station of Fontechiari use of the two averaging methods brings to estimates of the impact of dust within 20 % from each other (9.15 vs. 10.81 µg m−3, respectively).
5
Between 26 and 32 % of the city yearly exceedances of the 50 µ g m−3 limit were found to be associated to Saharan advections. On a year basis, such advections caused a PM10increase of the order of 2.35 µ g m−3. Even though subtracting the
“Sa-haran” exceedances (28) is not sufficient to reduce the yearly number of exceedances of the MG traffic station (107) below the EU mandatory limit of 35, subtraction of the 10
mass contribution may be sufficient at lowering the year average PM10 (43.85 µg m−3)
close to the EU limit of 40 µg m−3. It was also shown that a better assessment of trans-port events as allowed by the polarization Lidar measurements tends to increase the amount of PM10attributable to the Saharan advection. This study also showed that the altitude and time matching between the model forecasts and the Lidar observations are 15
rather good. In fact, Lidar observations require model analysis to infer sources of the observed aerosols. At the same time, model forecasts require observations to confirm the actual presence of dust at the location under study. Therefore, synergy between the two techniques is demonstrated to be very important to correctly assess the contri-bution of this natural aerosol to PM levels.
20
Main results of this work were obtained by means of a research-type polariza-tion Lidar coupled with PM10 observations and BSC-DREAM8b model forecasts.
This approach is at the centre of the EC LIFE+ 2010 project “DIAPASON” (www. diapason-life.eu) aimed at demonstrating the benefit of automated, simple polariza-tion Lidar-Ceilometers, partly developed within the project, at attesting and assessing 25
the effects of Saharan dust advections (and more in general of long-range aerosol advections) on European PM levels.
ACPD
13, 4963–4988, 2013Changes in physical properties during Saharan advections
over Rome
G. P. Gobbi et al.
Title Page
Abstract Introduction
Conclusions References
Tables Figures
◭ ◮
◭ ◮
Back Close
Full Screen / Esc
Printer-friendly Version Interactive Discussion
Discussion
P
a
per
|
Dis
cussion
P
a
per
|
Discussion
P
a
per
|
Discussio
n
P
a
per
|
References
Amiridis, V., Kafatos, M., Perez, C., Kazadzis, S., Gerasopoulos, E., Mamouri, R. E., Papayan-nis, A., Kokkalis, P., Giannakaki, E., Basart, S., Daglis, I., and Zerefos, C.: The potential of the synergistic use of passive and active remote sensing measurements for the validation of a regional dust model, Ann. Geophys., 27, 3155–3164, doi:10.5194/angeo-27-3155-2009, 5
2009.
Barnaba, F. and Gobbi, G. P.: Aerosol seasonal variability over the Mediterranean region and relative impact of maritime, continental and Saharan dust particles over the basin from MODIS data in the year 2001, Atmos. Chem. Phys., 4, 2367–2391, doi:10.5194/acp-4-2367-2004, 2004.
10
Barnaba, F., Gobbi, G. P., and De Leuuw, G.: Aerosol stratification, optical properties and ra-diative forcing in Venice (Italy) during ADRIEX, Q. J. Roy. Meteor. Soc., 133, 47–60, 2007. Basart, S., P ´erez, C., Cuevas, E., Baldasano, J. M., and Gobbi, G. P.: Aerosol characterization
in Northern Africa, Northeastern Atlantic, Mediterranean Basin and Middle East from direct-sun AERONET observations, Atmos. Chem. Phys., 9, 8265–8282, doi:10.5194/acp-9-8265-15
2009, 2009.
Basart, S., Pay, M. T., Jorba, O., P ´erez, C., Jim ´enez-Guerrero, P., Schulz, M., and Baldasano, J. M.: Aerosols in the CALIOPE air quality modelling system: evaluation and analysis of PM levels, optical depths and chemical composition over Europe, Atmos. Chem. Phys, 12, 3363–3392, doi:10.5194/acp-12-3363-2012, 2012a.
20
Basart, S., P ´erez, C., Nickovic, S., Cuevas, E., and Baldasano, J. M.: Development and eval-uation of the BSC-DREAM8b dust regional model over Northern Africa, the Mediterranean and the Middle East, Tellus B 2012, 64, 18539, doi:10.3402/tellusb.v64i0.18539, 2012b. Carnevale, C., Finzi, G., Pisoni, E., Volta, M., Kishcha, P., and Alpert, P.: Integrating Saharan
dust forecasts into a regional chemical transport model: a case study over Northern Italy, 25
Sci. Total Environ., 147–148, 417–418, 224–231, 2012.
D’Almeida, G. A.: On the variability of desert aerosol radiative characteristics, J. Geophys. Res., 92, 3017–3026, 1987.
EC: EU Air Quality Directive 2008/50/EC, 2008.
EC: Commission StaffWorking Paper: establishing guidelines for demonstration and subtrac-30
ACPD
13, 4963–4988, 2013Changes in physical properties during Saharan advections
over Rome
G. P. Gobbi et al.
Title Page
Abstract Introduction
Conclusions References
Tables Figures
◭ ◮
◭ ◮
Back Close
Full Screen / Esc
Printer-friendly Version Interactive Discussion
Discussion
P
a
per
|
Dis
cussion
P
a
per
|
Discussion
P
a
per
|
Discussio
n
P
a
per
|
Escudero, M., Querol, X., Pey, J., Alastuey, A., P ´erez, N., Ferreira, F., Alonso, S., Rodr´ıguez, S., and Cuevas, E.: A methodology for the quantification of the net African dust load in air quality monitoring networks, Atmos. Environ., 41, 5516–5524, 2007.
Gobbi, G. P., Barnaba, F., Giorgi, R., and Santacasa, A.: Altitude-resolved properties of a Sa-haran dust event over the Mediterranean, Atmos. Environ., 34, 5119–5127, 2000.
5
Gobbi, G. P., Barnaba, F., and Ammannato, L.: The vertical distribution of aerosols, Saharan dust and cirrus clouds in Rome (Italy) in the year 2001, Atmos. Chem. Phys., 4, 351–359, doi:10.5194/acp-4-351-2004, 2004a.
Gobbi, G. P., F. Barnaba and L. Ammannato, Lidar and photometric measurements of Saharan dust outbreaks at Izana (Tenerife) during the Minatroc 2002 field campaign, Reviewed and 10
Revised Proceedings of the International Laser Radar Conference (ILRC22), Pappalardo and Amodeo Eds., European Space Agency, SP-561, 369–372, 2004b.
Gobbi, G. P., Barnaba, F., and Ammannato, L.: Estimating the impact of Saharan dust on the year 2001 PM10 record of Rome, Italy, Atmos. Environ., 41, 261–275, 2007.
Haustein, K., P ´erez, C., Baldasano, J. M., M ¨uller, D., Tesche, M., Schladitz, A., Esselborn, M., 15
Weinzierl, B., Kandler, K., and Hoyningen-Huene, W. V.: Regional dust model performance during SAMUM 2006, J. Geophys. Res. Lett., 36, L03812, doi:10.1029/2008GL036463, 2009.
Highwood, E. J., J. M., Haywood, H., Coe, J. ,Cook, S., Osborne, P., Williams, J., Crosier, P., Formenti, J., McQuaid, B., Brooks, G., Thomas, R., Grainger, F., Barnaba, G. P., Gobbi and 20
G., De Leeuw, Aerosol Direct Radiative Impact Experiment (ADRIEX) Overview, Q. J. Roy. Meteor. Soc., 133, 3–15, 2007.
Kishcha, P., Alpert, P., Shtivelman, A., Krichak, S. O., Joseph, J. H., Kallos, G., Katsafados, P., Spyrou, C., Gobbi, G. P., Barnaba, F., Nickovic, S., Perez, C., and Baldasano, J. M.: Forecast errors in dust vertical distributions over Rome (Italy): Multiple particle size representation and 25
cloud contributions, J. Geophys. Res., 112, D15205, doi:10.1029/2006JD007427, 2007. Mallone, S., Stafoggia, M., Faustini, A., Gobbi, G. P., Marconi, A., and Forastiere, F.: Saharan
Dust and Associations between Particulate Matter and Daily Mortality in Rome, Italy, Environ. Health. Persp., 119, 1409–1414, 2011.
Marinou, E., V. Amiridis, A. Tsekeri, S., Basart, J. M. Baldasano, Kazadzis, S., and Papayannis, 30
ACPD
13, 4963–4988, 2013Changes in physical properties during Saharan advections
over Rome
G. P. Gobbi et al.
Title Page
Abstract Introduction
Conclusions References
Tables Figures
◭ ◮
◭ ◮
Back Close
Full Screen / Esc
Printer-friendly Version Interactive Discussion
Discussion
P
a
per
|
Dis
cussion
P
a
per
|
Discussion
P
a
per
|
Discussio
n
P
a
per
|
Mitsakou, C., Kallos, G., Papantoniou, N., Spyrou, C., Solomos, S., Astitha, M., and Housiadas, C.: Saharan dust levels in Greece and received inhalation doses, Atmos. Chem. Phys., 8, 7181–7192, doi:10.5194/acp-8-7181-2008, 2008.
Mol, W., van Hooydonk, P., and de Leeuw, F.: The state of the air quality in 2009 and the European exchange of monitoring information in 2010, ETC/ACM Technical Paper 1/2011, 5
2011.
Moulin, C., Lambert, C. E., Dayan, U., Masson, V., Ramonet, M., Bousquet, P., Legrand, M., Balkanski, Y. J., Guelle, W., Marticorena, B., Bergametti, G., and Dulac, F.: Satellite clima-tology of African dust transport in the Mediterranean atmosphere, J. Geophys. Res., 103, 13137–13144, 1998.
10
Nava, S., Becagli, S., Calzolai, G., Chiari, M., Lucarelli, F., Prati, P., Traversi, R., Udisti, R., Valli, G., and Vecchi, R.: Saharan dust impact in central Italy: An overview on three years elemental data records, Atmos. Environ., 60, 444–452, 2012.
Nickovic, S., Kallos, G., Papadopoulos, A., and Kakaliagou, O., A model for predic-tion of desert dust cycle in the atmosphere, J.Geophys. Res., 106, 18113–18129, 15
doi:10.1029/2000JD900794, 2001.
Ozer, P., Mohamed Laghdaf, M. B., Mohamed Lemine, S. O., and Gassani, J.: Estimation of air quality degradation due to Saharan dust at Nouakchott, Mauritania, from horizontal visibility data, Water Air Soil Pollut., 178, 79–87, doi:10.1007/s11270-006-9152-8, 2006.
Papanastasiou, D. K., Poupkou, A., Katragkou, E., Amiridis, V., Melas, D., Mihalopoulos, N., 20
Basart, S., P ´erez, C., and Baldasano, J. M.: An Assessment of the Efficiency of Dust Re-gional Modelling to Predict Saharan Dust Transport Episodes, Advances in Meteorology, 2010, 154368, doi:10.1155/2010/154368, 2010.
Pay, M. T., Jim ´enez-Guerrero, P., Jorba, O., Basart, S., Querol, X., Pandolfi, M., and Baldasano, J. M.: Spatio-temporal variability of concentrations and speciation of particulate matter across 25
Spain in the CALIOPE modeling system, Atmos. Environ., 46, 376–396, 2012.
P ´erez, C., Nickovic, S., Baldasano, J. M., Sicard, M., Rocadenbosch, F., and Cachorro, V. E.: A long Saharan dust event over the western Mediterranean: Lidar, Sun pho-tometer observations, and regional dust modeling, J. Geophys. Res., 111, D15214, doi:10.1029/2005JD006579, 2006a.
30
ACPD
13, 4963–4988, 2013Changes in physical properties during Saharan advections
over Rome
G. P. Gobbi et al.
Title Page
Abstract Introduction
Conclusions References
Tables Figures
◭ ◮
◭ ◮
Back Close
Full Screen / Esc
Printer-friendly Version Interactive Discussion
Discussion
P
a
per
|
Dis
cussion
P
a
per
|
Discussion
P
a
per
|
Discussio
n
P
a
per
|
Perrino, C., Canepari, S., Catrambone, M., Dalla Torre, S., Rantica, E., and Sargolini, T.: In-fluence of natural events on the concentration and composition of atmospheric particulate matter, Atmos. Environ., 43, 4766–4779, 2009.
Pey, J., Querol, X., Alastuey, A., Forastiere, F., and Stafoggia, M.: African dust outbreaks over the Mediterranean Basin during 2001–2011: PM10concentrations, phenomenology and 5
trends, and its relation with synoptic and mesoscale meteorology, Atmos. Chem. Phys., 13, 1395–1410, doi:10.5194/acp-13-1395-2013, 2013.
Putaud J.-P., Frank, R., Van Dingenen, R., Br ¨uggemann, E., Facchini, M. C., Decesari, S., Fuzzi, S., Gehrig, R., H ¨uglin, C., Laj, P., Lorbeer, G., Maenhaut, W., Mihalopoulos, N., M ¨uller, K., Querol, X., Rodriguez, S., Schneider, J., Spindler, G., Brink, H., Tørseth, K., and Wiedensohl, 10
A.: A European aerosol phenomenology – 2: Chemical characteristics of particulate matter at kerbside, urban, rural and background sites in Europe, Atmos. Environ., 38, 2579–2595, 2004.
Querol, X., Alastuey, A., Pey, J., Cusack, M., P ´erez, N., Mihalopoulos, N., Theodosi, C., Gerasopoulos, E., Kubilay, N., and Koc¸ak, M.: Variability in regional background aerosols 15
within the Mediterranean, Atmos. Chem. Phys., 9, 4575–4591, doi:10.5194/acp-9-4575-2009, 2009.
Querol, X., Alastuey, A., Pey, J., Pandolfi, M., Cusack, M., Perez, N., Viana, M., Moreno, T., Mihalopoulos, N., Kallos, G., Kleanthous, S.: African dust contributions to mean ambient PM10mass-levels across the Mediterranean Basin, Atmos. Environ., 43, 4266–4277, 2009b. 20
Rodriguez, S., Querol, X., Alastuey, A., Kallos, G., and Kakaliagou, O.: Atmospheric Saharan dust contributions to PM10and TSP levels in Southern and Eastern Spain, Atmos. Environ., 35, 2433–2447, 2001.
Sakai, T., Nagai, T., Zaizen, Y., and Mano, Y.: Backscattering linear depolarization ratio mea-surements of mineral, sea-salt, and ammonium sulfate particles simulated in a laboratory 25
chamber, Appl. Opt., 49, 4441–4449, 2010.
Tafuro, A. M., Barnaba, F., De Tomasi, F., Perrone, M. R., and Gobbi, G. P.: Saharan Dust Particle Properties over the Central Mediterranean, Atmos. Res., 81, 67–93, 2006.
Tegen, I. and Lacis, A. A.: Modeling of particle size distribution and its influence on the radiative properties of mineral dust aerosol, 101, 19237–19244, 1996.
30
ACPD
13, 4963–4988, 2013Changes in physical properties during Saharan advections
over Rome
G. P. Gobbi et al.
Title Page
Abstract Introduction
Conclusions References
Tables Figures
◭ ◮
◭ ◮
Back Close
Full Screen / Esc
Printer-friendly Version Interactive Discussion
Discussion
P
a
per
|
Dis
cussion
P
a
per
|
Discussion
P
a
per
|
Discussio
n
P
a
per
|
Table 1.Bias and RMS differences between dust load estimates performed at the at the re-gional background station of Fontechiari (FC) with respect to equivalent estimates performed at the two city stations of VA and MG, and at two other regional background stations (Allumiere, AL, and Leonessa, LE).
Bias RMS
ACPD
13, 4963–4988, 2013Changes in physical properties during Saharan advections
over Rome
G. P. Gobbi et al.
Title Page
Abstract Introduction
Conclusions References
Tables Figures
◭ ◮
◭ ◮
Back Close
Full Screen / Esc
Printer-friendly Version Interactive Discussion
Discussion
P
a
per
|
Dis
cussion
P
a
per
|
Discussion
P
a
per
|
Discussio
n
P
a
per
|
Table 2.Percent of advection days, ground contacts, average 532 nm optical depth and relevant standard deviation of Saharan dust events as observed by the VELIS Lidar and forecast by BSC-DREAM8b.
2001 2002 2003 2004 AVG
% Dust Days Lidar
BSC-DREAM8b
25.6 25.9
25.0 26.0
25.5 24.9
38.3 26.8
28.6 25.9
% Ground Dust Lidar
BSC-DREAM8b
15.6 12.6
14.7 13.4
15.6 13.1
24.0 13.1
17.5 13.0
Avg. dust AOD Lidar
BSC-DREAM8b
0.09 0.08
0.13 0.10
0.15 0.08
0.13 0.07
0.13 0.08
St.dev.dust AOD Lidar
BSC-DREAM8b
0.07 0.09
0.10 0.11
0.17 0.09
0.10 0.08
ACPD
13, 4963–4988, 2013Changes in physical properties during Saharan advections
over Rome
G. P. Gobbi et al.
Title Page
Abstract Introduction
Conclusions References
Tables Figures
◭ ◮
◭ ◮
Back Close
Full Screen / Esc
Printer-friendly Version Interactive Discussion
Discussion
P
a
per
|
Dis
cussion
P
a
per
|
Discussion
P
a
per
|
Discussio
n
P
a
per
|
Table 3. Statistics of PM10 changes observed during dust episodes at the three air quality stations of Magna Grecia (MG), Villa Ada (VA) and Fontechiari (FC).
# Variable MG VA FC
1 Observation Days (max 1417) 1320 1288 1345
2 Days with dust at ground (VELIS+BSC-DREAM8b) 268 267 287 3 % Days with ground dust (VELIS+BSC-DREAM8b) 20 21 21 4 Year-Average PM10(µg m−3
) 43.85 28.78 25.15
5 Year-Average PM10without dust (µg m−3) 41.40 26.53 23.22 6 Year-dPM10in dust (µg m−3
) 2.45 2.25 1.93
7 PM10exceedances/year 107.01 30.89 10.04
8 PM10dust-caused exceedances/year 27.93 9.92 4.34
9 % dust-caused exceedances 26 32 43
10 Average dPM10in dust (µg m−3
) 13.45 10.33 9.15
11 Standard Deviation (µg m−3
) 11.45 11.67 9.77
12 Number of dPM10<0 (VELIS+BSC-DREAM8b) 6 6 7
13 Number of dPM10<0 (VELIS) 0 0 2
14 Average dPM10(VELIS) (µg m−3
) 16.44 14.67 11.02
15 Standard Deviation (µg m−3
ACPD
13, 4963–4988, 2013Changes in physical properties during Saharan advections
over Rome
G. P. Gobbi et al.
Title Page
Abstract Introduction
Conclusions References
Tables Figures
◭ ◮
◭ ◮
Back Close
Full Screen / Esc
Printer-friendly Version Interactive Discussion
Discussion
P
a
per
|
Dis
cussion
P
a
per
|
Discussion
P
a
per
|
Discussio
n
P
a
per
|
(a)
(b)
(c)
(d)
(e)
(f)
Fig. 1. Average daily variation of PM10 and meteorological parameters with respect to their average in the 15-day time span preceding and following all the dust advections encountered in the 4-year study. Error bars represent the 95 % confidence intervals of such averages. The average values during the whole Saharan event (whatever its length) is reported at time zero. PM10 curves (a) are reported for MG (blue), VA (green), FC (red) and for the ensemble of the three stations (black). Meteorological parameters are: pressure(b), temperature(c), wind speed(d), sunshine(e)and rainfall(f), respectively.
ACPD
13, 4963–4988, 2013Changes in physical properties during Saharan advections
over Rome
G. P. Gobbi et al.
Title Page
Abstract Introduction
Conclusions References
Tables Figures
◭ ◮
◭ ◮
Back Close
Full Screen / Esc
Printer-friendly Version Interactive Discussion
Discussion
P
a
per
|
Dis
cussion
P
a
per
|
Discussion
P
a
per
|
Discussio
n
P
a
per
|
0 1 2 3 4 5 6 7 8 9 10 0
0.005 0.01 0.015 0.02 0.025
DREAM mean extinction during dust events
2001 2002 2003 2004 2001-2004
0 2 4 6 8 10 12
0 0.005 0.01 0.015 0.02 0.025 0.03 0.035
VELIS mean extinction during dust events
2001 2002 2003 2004 2001-2004
0 1 2 3 4 5 6 7 8 9 10 0
5 10 15 20 25
DREAM frequency of dust events
2001 2002 2003 2004 2001-2004
0 2 4 6 8 10 12
0 5 10 15 20 25 30 35
VELIS frequency of dust events
2001 2002 2003 2004 2001-2004
(a) (b)
(c) (d)
Fig. 2.Vertical distribution of Saharan dust layers properties as observed by VELIS (left col-umn) and forecast by BSC-DREAM8b (right colcol-umn), respectively: frequency of Saharan dust occurrences at least in one altitude bin (plotsaandb) and average dust extinction coefficient (km−1
at 532 nm) per year (plotscandd).
ACPD
13, 4963–4988, 2013Changes in physical properties during Saharan advections
over Rome
G. P. Gobbi et al.
Title Page
Abstract Introduction
Conclusions References
Tables Figures
◭ ◮
◭ ◮
Back Close
Full Screen / Esc
Printer-friendly Version Interactive Discussion
Discussion
P
a
per
|
Dis
cussion
P
a
per
|
Discussion
P
a
per
|
Discussio
n
P
a
per
|
24
advections (δ
Fig. 3. Seasonal frequency distribution of all PM10changes associated to Saharan advections (δPM) at the two Rome stations of MG and VA in the period 2001-2004. Colour bars at the top of the plots represent the average of the relevant distributions, the black bar representing the total average.