www.geosci-instrum-method-data-syst.net/3/179/2014/ doi:10.5194/gi-3-179-2014
© Author(s) 2014. CC Attribution 3.0 License.
An instrumented sample holder for time-lapse microtomography
measurements of snow under advective airflow
P. P. Ebner1,2, S. A. Grimm2, M. Schneebeli2, and A. Steinfeld1,3
1Department of Mechanical and Process Engineering, ETH Zurich, 8092 Zurich, Switzerland 2WSL Institute for Snow and Avalanche Research SLF, 7260 Davos-Dorf, Switzerland 3Solar Technology Laboratory, Paul Scherrer Institute, 5232 Villigen, Switzerland
Correspondence to:A. Steinfeld ([email protected]) and M. Schneebeli ([email protected]) Received: 24 April 2014 – Published in Geosci. Instrum. Method. Data Syst. Discuss.: 24 June 2014 Revised: 29 August 2014 – Accepted: 6 September 2014 – Published: 24 September 2014
Abstract.An instrumented sample holder was developed for time-lapse microtomography of snow samples to enable in situ nondestructive spatial and temporal measurements under controlled advective airflows, temperature gradients, and air humidities. The design was aided by computational fluid dy-namics simulations to evaluate the airflow uniformity across the snow sample. Morphological and mass transport proper-ties were evaluated during a 4-day test run. This instrument allows the experimental characterization of metamorphism of snow undergoing structural changes with time.
1 Introduction
Snow, a sintered porous material made of ice grains, con-tinuously changes with time and external conditions of tem-perature and airflow (Dominé et al., 2008). Snow has a high permeability, which facilitates diffusion of gases and, under appropriate conditions, airflow (Sturm and Johnson, 1991; Waddington et al., 1996). This can have a direct effect on snow–air exchange processes with an impact on atmosphere chemistry (Clifton et al., 2008; Grannas et al., 2007), snow metamorphism (Albert et al., 2004), water flow through snow (Waldner et al., 2004), and isotopic composition (Steen-Larsen et al., 2014). Here, we describe the design and imple-mentation of a unique sample holder that enables the inves-tigation of the effects of advective airflow and gas diffusion under controlled conditions, and at the same time the obser-vation of the recrystallization of the ice structure.
Microcomputer tomography (µ-CT) is an appropriate tool to analyze the microstructure of snow in a nondestructive
way (Pinzer et al., 2012; Pinzer and Schneebeli, 2009b; Kaempfer and Schneebeli, 2007). Combined with direct pore-level simulations of the governing fluid flow equations, this technique enables the determination of the effective transport properties of snow and helps elucidate the funda-mentals of a wide range of environmental processes (Schnee-beli and Sokratov, 2004; Zermatten et al., 2011; Kerbrat et al., 2008; Pinzer et al., 2010).
In this paper, the design, fabrication, and operation of an instrumented sample holder that allows for time-lapse measurements of the snow microstructure using microcom-puted X-ray tomography (µ-CT) are described. The tech-nical requirements of the setup include thermal insulation, electric signal transfer, and unhinderedµ-CT scanning. An earlier design (Schneebeli and Sokratov, 2004; Pinzer and Schneebeli, 2009a) is extended to create advective airflow at a controlled temperature and humidity. The significance of this experimental setup lies in the analysis of snow metamor-phism (Kaempfer and Schneebeli, 2007; Pinzer and Schnee-beli, 2009b) as well as of the isotope exchange with the sur-rounding ice or gases (Pinzer et al., 2010; Neumann et al., 2008). Two sample holders are designed to assess the fluid flow effect: the first one creates airflow across the snow sam-ple to investigate mass transport of water vapor across the pores, while the second design creates airflow over the snow surface to observe diffusive processes.
2 Experimental setup
mass flow controller
humidifier
TC HS
sample holder
NTC NTC
Micro-CT
Cold lab airflow
air tank
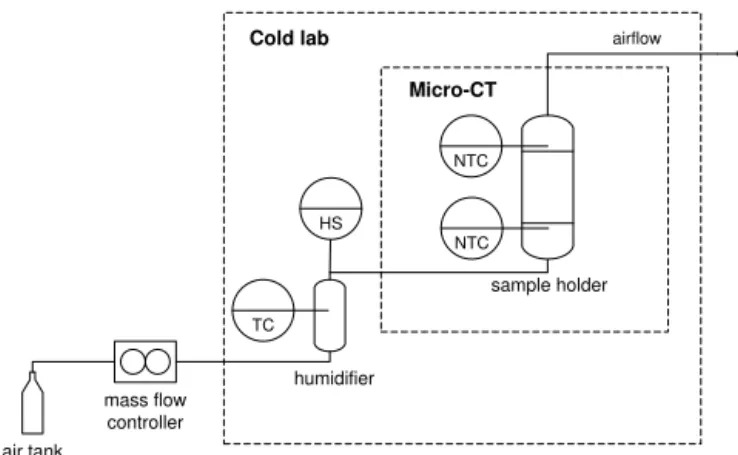
Figure 1. Schematic of the experimental setup. A thermocouple (TC) and a humidity sensor (HS) inside the humidifier measure the airflow condition. Two thermistors (NTC) close to the snow surface measure the inlet and outlet temperature of the airflow.
(2) the design of the sample holder; and (3) the mass flow controller coupled to a humidifier for controlling the airflow and providing stable boundary conditions. This arrangement enables the analysis of snow metamorphism and the influ-ence of advective airflow and diffusion with well-defined boundary conditions and without disturbing theµ-CT image quality.
2.1 Microcomputed tomography
Time-lapseµ-CT in a cold laboratory is a method to mea-sure dynamically changing microstructural snow properties (Schneebeli and Sokratov, 2004; Pinzer and Schneebeli, 2009b; Pinzer et al., 2012). Kerbrat et al. (2008) showed that
µ-CT of snow has sufficient spatial resolution to resolve the structural information. Small snow samples of up to 50 mm diameter and 140 mm height can be observed non-intrusively. A modifiedµ-CT80 (Scanco Medical) was used for the time-lapse tomography measurements, as described by Schneebeli and Sokratov (2004) and Pinzer et al. (2012). The equip-ment incorporated a microfocus X-ray source, operated at 30–70 kV acceleration voltage with a maximum nominal res-olution of 10 µm. The samples were scanned with 1000 pro-jections per 180◦in high resolution setting, with typical ad-justable integration time of 200–600 ms per projection. The field of view (FOV) of the scan area is 36.9 mm of the to-tal 53 mm diameter, and subsamples with a dimension of 7.2×7.2×7.2 mm3 were extracted for further processing. During the scan, the sample holder rotates and translates ver-tically 3–8 mm after each stack of images is acquired. The equipment is placed in a refrigerated room, which can be cooled down to −20◦C. Temperature fluctuations of up to
±0.5 K inside theµ-CT80 are due to the heating of the X-ray tube. In addition, the temperature fluctuates daily inside the cold chamber due to a switch in the position of the heat
air plug-in CT attachment
aluminum cylinders micro porous
foam device cover
micro mesh
thermistor thermistor
1
10
mm
90
mm
thermistor flow channel thermistor
z
x y
Figure 2.Schematic of the sample holder design for flow across the snow sample (left) and for flow over the snow surface (right). The dimension of the analyzed snow sample for both setups is 50 mm diameter and 30 mm height.
exchangers. Experiments can be performed for several weeks without removing the sample from theµ-CT.
2.2 Sample holder design
The main restriction in the design of the sample holder is im-posed by the available space in theµ-CT. In addition, the X-ray contrast between ice and air is relatively weak (Hubbell and Seltzer, 1996), and the X-ray absorption properties of the sample holder materials have to be taken into account. As a further restriction, the weight of the sample holder is limited to 1 kg by the power of thezstage and rotational mo-tors.
Two different sample holder designs were developed: (1) a sample holder with the airflow across the snow sam-ple to investigate mass transport of water vapor between the pores; (2) and a sample holder with the airflow over the snow surface to investigate diffusion processes in the first layers. Figure 2 shows the design of the two different sample holders. They were made out of polyoxymethylene (POM) to save weight (ρPOM=1400 kg m−3) and to ensure good
thermal decoupling (kPOM=0.33 W K−1m−1) from the
en-vironment with minimal influence on the CT image qual-ity within the field of view. The devices are considered as a plug-in arrangement for simple disassembling and for easy replacement of components. The general problem of the elec-trical signal transmission between the rotating sample holder and the outside electronics was solved by two slip rings (LTN-SD055-10-E36; diameter 55 mm; number of contacts 10) at the bottom and top of the sample holder. To position the top slip ring close to the sample holder, a base frame is incorporated around the sample holder. This external frame is out of the field of view and avoids cable breakage during the experimental run (Pinzer and Schneebeli, 2009a).
Table 1.Thermal and transport properties of air and snow.
Parameter Value Unit
Ms 0.01801 kg mol−1
pv,s1 exp(9.55−5723.26×T−1+3.53×ln(T )−0.00728×T ) Pa
µair2 9.21×10⁻¹⁵T3−3.089×10⁻¹¹T2+6.279×10⁻⁸T+2.298×10⁻⁶ kg m−1s−1
σp 0.109 kg s−2
1Murphy and Koop (2005);2Kadoya et al. (1985)
holder. It contains a flow channel with four inlets to pro-vide a symmetric flow. It is in contact with the CT attach-ment, and the friction between the two components is mini-mized to prevent a blockage of the rotational motor. Sealings between the air plug-in and the CT attachment ensure leak tightness. A thin aluminum cylinder around the snow sam-ple, with a low X-ray absorption coefficient of 0.37 cm2g−1 at 50 keV (Hubbell and Seltzer, 1996), serves as a heat con-ductor (kAl=250 W K−1m−1) to stabilize the applied
tem-perature gradient (Pinzer and Schneebeli, 2009a). The cylin-der is surrounded by 1 cm thick heat insulating porous foam (Styrofoam; kSty=0.027 W K−1m−1). At the bottom and
top of the snow sample holder, a mesh with a mesh size of 2 mm retains the snow inside the sample holder and per-mits unhindered airflow. Two NTC-thermistors (betaTherm 10K4MBD1; accuracy:±0.1 K) placed in the middle of the meshes at the bottom and top of the snow sample measure the inlet and outlet temperature of the flow. For the flow analysis over the surface, the inlet area of the snow sample is closed and the air flows in a channel over the snow surface and exits through a central tube. The sample holder for both designs is closed by a cover containing an attachment to mount a hose for the mass flow outlet and the upper slip ring. The total weight of the two setups is 550 g and 620 g.
2.3 Mass flow and water saturation control
The airflow is generated by a dry air pressure tank controlled by a mass flow controller (EL-Flow, Bronkhorst). A humid-ifier, consisting of a tube (diameter 60 mm) filled with ice particles, is used to saturate the airflow with water vapor. A thermocouple (PT1000; accuracy:±0.1 K) and a humidity sensor (HIH 4000-002; accuracy:±3.5 %) at the outlet are built in to monitor the outflowing air. A heating foil around the humidifier allows varying the air temperature to induce a temperature gradient inside the snow sample. The pipe be-tween the humidifier and the sample holder is insulated and heated by a heating wire to eliminate clogging the pipe by deposition of ice and prevent a temperature gradient and sub-sequently a changing humidity.
3 Calibration
The two thermistors close to the snow sample measure the temperature difference across the snow sample. To mini-mize the error in temperature difference measurements be-tween the two sensors, both thermistors were simultaneously calibrated in ice water (standard deviation: 0.1 K). A Na-tional Instrument DAQ device (E Series SCB-68; accuracy:
±0.08 %) is used to read the thermistors and the humidity sensor signals. The average of 10 measurements at 100 Hz sampling rates is used for one measurement step (0.1 s). A Pi-carro CRDS instrument (1100-series PiPi-carro) was used to measure the absolute humidity of water vapor in air by IR spectroscopy. Small concentration changes can be captured in a few seconds. To check the leak tightness of the com-plete setup, dry air (humidity: 85 ppm; standard deviation:
±2 ppm) was perfused through an empty sample holder and was analyzed by the Picarro before and after the sample holder. The advantage of dry air is that small changes in the concentrations due to a leak could be detected very rapidly because the air in the refrigerated laboratory had a much higher humidity (humidity: 2000 ppm; standard deviation:
±100 ppm). No leakage occurred during a run of 15 min. Since a large airflow may destroy the fragile microstruc-ture of the snow sample, the maximum permissible mass flow is estimated by calculating the pressure drop by Darcy’s law:
∇p= −µair
K uD, (1)
where∇p denotes the pressure drops along the lengthl=
3 cm of the snow sample (diameter 53 mm),µair is the
dy-namic viscosity of air at temperatureT,K the permeability of the snow sample, anduDthe velocity inside the snow
sam-ple. Assuming that the buoyancy effect of the airstream never exceeds the force exerted by gravity on the snow sample (Fair≤Fs), the maximum velocity inside the snow sample
is given by
uD,max=(1−ε) ρsV gK
Aµairl
, (2)
whereε is the porosity,ρs is the density of the snow
Table 2. Maximum flow rates, pressure gradients and minimum snow height for airflow saturation for different snow samples.
Sample uD,max V˙max ∇p zsub
m s−1 L min−1 Pa m−1 mm
ds 0.026 2.92 157.5 0.061
mI 0.037 4.18 228.1 0.056
mII 0.071 7.60 363.5 0.053
dh 0.61 54 1003.6 0.059
ws 0.17 8.77 3384.1 0.061
decomposing snow (ds); metamorphosed I (mI); metamorphosed II (mII); depth hoar (dh); wet snow (ws).
and g the gravitational acceleration. Using the snow prop-erties of Zermatten et al. (2011) and the values of Table 1, the maximum velocity for different snow types can be esti-mated. As an example, the maximum velocity tolerable for depth hoar snow (dh) isuD,max≈0.61 m s−1, and the
corre-sponding mass flow rate isV˙max≈54 L min−1. In contrast,
for decomposing snow (ds), a much lower mass flow rate is tolerable: V˙max≈2.9 L min−1. The calculated threshold
ve-locities and mass flow rates for different snow types, as well as the pressure gradients between the inlet and outlet, are shown in Table 2.
An airstream leaving the snow is typically saturated (Neu-mann et al., 2009). Therefore, a defined contact time in the humidifier is needed to ensure a fully water-vapor-saturated airflow and, consequently, to prevent sublimation of the snow sample inside the sample holder during the experiment. In the simulation, the humidifier is modeled as a packed bed of ice spheres. Steady state is assumed and diffusion is neglected compared to the advective term. The mass balance is given by
0= d
dz uD,maxc1
+N1, (3)
wherec1is the water concentration of the airflow,uD,maxthe
maximum superficial velocity of the different snow types cal-culated in Eq. (2), andN1the mass flux of water. Substituting
forN1=a0km(c1(sat)−c1)and integrating Eq. (3) yields c1
c1(sat)
=1−exp−(kma0/uD,max)z
, (4)
where a0 is the specific surface area per bed volume, and km is the mass transfer coefficient for the air–ice interface
(Neumann et al., 2009). The saturation vapor pressure is only given over a flat ice surface (Murphy and Koop, 2005). How-ever, the saturation vapor pressure of snow increases over a curved surface relative to a flat surface due to the cur-vature effect as molecules desorb more readily (Kelvin ef-fect). Therefore, the saturation vapor pressure of snow,pv,s′ , is given by
pv,s′ pv,s
=exp 2σpMs
rgrRT ρs !
, (5)
25 mm 6
2.5 10
5
2.5 10
4
2.5 10
2
2.5 10
1
2.5 10
3
2.5 10
-1
[m s ]
Velocity
FOV
-1
[m s ]
3
2.5 10
0
3
1.5 10
3
2.0 10
3
0.5 10
3
1.0 10
z x
y x
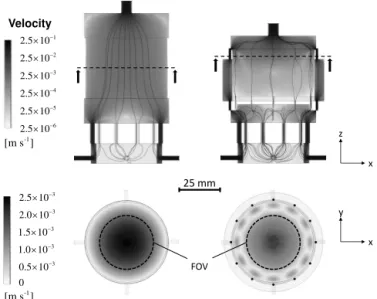
Figure 3.Vertical cross section of CFD-simulated airflow stream-line and velocity simulations for flow in the empty sample holder. A horizontal cross section of the scan area with the field of view (FOV) of theµ-CT is shown below.
wherepv,sis the saturation vapor pressure over a flat surface, σpis the average particle surface tension,Msis the molecular
weight of snow,Ris the gas constant,ρsthe density of snow,
andrgris the average radius of the snow grains. The data used
for the calculations are listed in Table 1. The average snow grain size of the different snow types is taken from Zermatten et al. (2011).
Table 2 shows the minimum calculated snow height (zsub)
for complete saturation of air with water vapor. The calcu-lated concentration profiles show the same behavior as found in the experiments by Neumann et al. (2009). The sublima-tion rate of snow is very rapid under these condisublima-tions. The saturation vapor density is reached in the pore space within the first 1 mm of the snow sample, regardless of tempera-ture or flow rate. For example, the minimum snow height for depth hoar snow (dh) iszsub≈0.059 mm and for
decompos-ing snow (ds) iszsub≈0.061 mm.
4 Airflow simulations
in 1 in
6 C 0.01 m s laminar T
u
wall 15 C T
Styrofoam Aluminum Air
Temperature [ºC]
8.0
6.0
6.4
6.8
7.2
7.6
POM
Sub-sample
9 2 1
1 1 cond
0.7 3.45 10 m SSA 26 mm
0.2 W m K K
k
Snow
6.0 C
6.5 C 7.0 C z
30 mm
0 mm
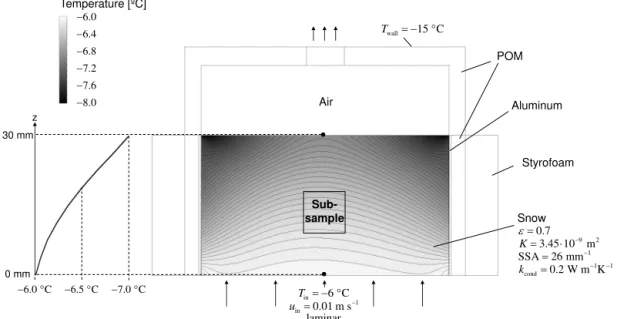
Figure 4.Cross section of the 3-D thermal simulation of the temperature gradient inside the snow sample. Only the snow sample and the device cover were considered to reduce the complexity of the simulation.
cross section can be seen (Fig. 3, left). Simulations of the sample holder design for flow over the snow surface, shown in Fig. 3 (right), reveal two additional critical points before the flow enters the channel and after it exits. The flow veloc-ity doubles due to the small tube connections. Nevertheless, a uniform and smooth flow over the surface, especially close to the center, is obtained.
A thermal simulation was performed (CFD, ANSYS, 2010) to model the temperature distribution inside the sample holder. To reduce the complexity of the simulations, only the snow sample and the device cover were considered (Fig. 4). The boundary conditions were uniform inlet velocity, tem-perature and outlet pressure, no-slip at the solid–fluid inter-face, fix wall temperature, and perfect contact between the different components. The resulting temperature distribution inside the snow sample is shown in Fig. 4. The fact that the aluminum cylinder serves as a heat conductor to stabilize the applied temperature gradient, an inhomogeneous distribution with bent isotherms can be observed. This inhomogeneity in the temperature distribution has to be taken into account for temperature gradient experiments leading to additional mass fluxes to the side.
5 Experiments with snow
First experimental runs under isothermal advective condi-tions with fully saturated airflow were performed. New snow (Schleef et al., 2014) sintered in a box at−10◦C for 6 days, and a saturated airflow of 2 L min−1 was used. During µ -CT scans the airflow was turned off to prevent any structural changes and vibration of snow branches due to the advective flow. The temporal temperature distribution for inlet and the
0 24 48 72 96
−15 −14.5 −14 −13.5 −13
t
[h]
T
in[
◦
C
]
0 24 48 72 96
0 0.25 0.5 0.75 1
∆
T
[
◦
C
]
Figure 5.One minute averages of measured temperatures at the in-letTinand the temperature difference1T=Tin−Toutbetween in-let and outin-let of the snow sample. The locations of the sensors are shown in Fig. 2. Each local peak indicates oneµ-CT scan, and the local temperature rises are induced by heating of the X-ray tube.
Table 3.Morphological and flow characteristics of a snow sample with and without advection.
Parameter Advection Without advection Units
t=0 d t=2 d t=4 d t=0 d t=2 d t=4 d
ε 0.67 0.671 0.678 0.67 0.673 0.674 –
SSA 26.36 26.12 26.32 25.36 25.15 24.85 mm−1
K 3.45×10⁻⁹ 3.56×10⁻⁹ 3.57×10⁻⁹ – – – m2
z
x y x
y
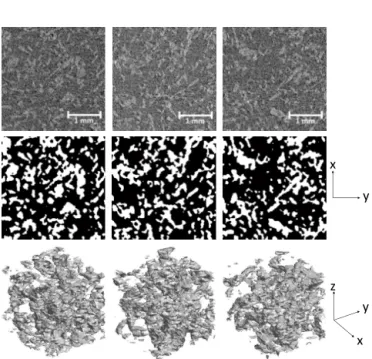
Figure 6.Raw reconstructedµ-CT signal of one scan and the cor-responding segmented images and 3-D renderings at (left)t=0, (middle)t=2 days, and (right)t=4 days. The dimensions of the displayed images are 3 mm2, and the 3-D renderings are 1.5 mm3. The images were taken perpendicular to the flow direction (zaxis). The bright phase corresponds to ice and the dark phase corresponds to air.
where the local temperature rises because of the heating by the X-ray tube. The daily temperature fluctuation inside the cold chamber due to the switch in the position of the heat ex-changers can also be seen. The average temperatures for the inlet and outlet are−13.7◦
C and−13.9◦
C, respectively, and the maximum deviation for the experimental run is±0.8◦C. Figure 6 shows the images of theµ-CT at the beginning of the experiment and after 2 and 4 days. The voxel size of each scan was 18 µm, and the scans were taken at the same position. No artifacts can be seen in the raw reconstructedµ -CT data, shown at the top of Fig. 6. The weight of the sample holder, the friction between the air plug-in, slip rings and the rotating sample holder are therefore small enough and caused no deterioration of the imaging. The raw data were filtered by using a median and Gaussian filter (σ=1.4, support=3), and segmented using the Otsu’s method (Otsu, 1979) to find the optimum threshold. The corresponding segmented
im-ages and 3-D digital renderings, also shown in Fig. 6, were used to calculate the specific surface area and porosity. Per-meability was calculated by direct pore-level simulations of the flow field (Zermatten et al., 2011). The results are listed in Table 3, with and without accounting for advection. The maximum change of the specific surface area is 2.4 % after 4 days for the case with advective flow. The same experimental setup but without advection caused a change in specific sur-face area of 2.0 %. Compared to rates which are typical for isothermal metamorphism (Kaempfer and Schneebeli, 2007), no effect of isothermal advection with saturated air could be observed.
6 Conclusions
We designed, fabricated, and tested aµ-CT sample holder for in situ time-lapse nondestructive investigation of snow meta-morphism with advection flow under controlled mass flow rates and temperatures. CFD simulations indicated a uni-form flow across and over the snow sample. First runs with advective airflow inside a snow sample were successfully performed, yielding continuous sensor signal transmission through the slip rings andµ-CT images without artifacts. The segmented data were used to calculate specific surface, porosity, and permeability. This new instrument allows elu-cidating heat and mass transport phenomena during advec-tive or diffusive fluxes. The obtained results can be used for improving models of firn compaction and evolution, for elu-cidating the flux mechanism of trace gases exchanged be-tween the ground and atmospheric air, and for providing more accurate effective transport properties to forecasting models of late-stage alpine snowpack responsible for large-scale avalanches.
Acknowledgements. The authors thank M. Jaggi for technical
sup-port, H. Loewe for help with the modeling, and H. C. Steen-Larsen for providing the Picarro analyzer. Financial support was granted by the Swiss National Science Foundation under project number 200020-146540.
References
Albert, M., Shuman, C., Courville, Z., Bauer, R., Fahnestock, M., and Scambos, T.: Extreme firn metamorphism: impact of decades of vapor transport on near-surface firn at a low-accumulation glazed site on the East Antarctic plateau, Ann. Glaciol., 39, 73– 78, 2004.
ANSYS: ANSYS-CFX, ANSYS Inc., Canonsburg, PA, 2010. Clifton, A., Manes, C., Rüedi, J.-D., Guala, M., and Lehning, M.:
On shear-driven ventilation of snow, Bound.-Lay. Meteorol., 126, 249–261, 2008.
Dominé, F., Albert, M., Huthwelker, T., Jacobi, H.-W., Kokhanovsky, A. A., Lehning, M., Picard, G., and Simp-son, W. R.: Snow physics as relevant to snow photochemistry, Atmos. Chem. Phys., 8, 171–208, doi:10.5194/acp-8-171-2008, 2008.
Grannas, A. M., Jones, A. E., Dibb, J., Ammann, M., Anasta-sio, C., Beine, H. J., Bergin, M., Bottenheim, J., Boxe, C. S., Carver, G., Chen, G., Crawford, J. H., Dominé, F., Frey, M. M., Guzmán, M. I., Heard, D. E., Helmig, D., Hoffmann, M. R., Hon-rath, R. E., Huey, L. G., Hutterli, M., Jacobi, H. W., Klán, P., Lefer, B., McConnell, J., Plane, J., Sander, R., Savarino, J., Shepson, P. B., Simpson, W. R., Sodeau, J. R., von Glasow, R., Weller, R., Wolff, E. W., and Zhu, T.: An overview of snow pho-tochemistry: evidence, mechanisms and impacts, Atmos. Chem. Phys., 7, 4329–4373, doi:10.5194/acp-7-4329-2007, 2007. Hubbell, J. H. and Seltzer, S. M.: Tables of X-Ray Mass
Atten-uation Coefficients and Mass Energy Absorption Coefficients from 1 keV to 20 MeV for ElementsZ=1 to 92 and 48 Ad-ditional Substances of Dosimetric Interest, available at: http:// www.nist.gov/pml/data/xraycoef/index.cfm (last access: 18 June 2014), 1996.
Kadoya, K., Matsunaga, N., and Nagashima, A.: Viscosity and ther-mal conductivity of dry air in the gaseous phase, J. Phys. Chem. Ref. Data, 14, 947–970, 1985.
Kaempfer, T. U. and Schneebeli, M.: Observation of isothermal metamorphism of new snow and interpretation as a sintering pro-cess, J. Geophys. Res., 112, 1–10, 2007.
Kerbrat, M., Pinzer, B., Huthwelker, T., Gäggeler, H. W., Am-mann, M., and Schneebeli, M.: Measuring the specific surface area of snow with X-ray tomography and gas adsorption: com-parison and implications for surface smoothness, Atmos. Chem. Phys., 8, 1261–1275, doi:10.5194/acp-8-1261-2008, 2008. Murphy, D. M. and Koop, T.: Review of the vapour pressures of ice
and supercooled water for atmospheric applications, Q. J. Roy. Meteor. Soc., 131, 1539–1565, 2005.
Neumann, T. A., Albert, M. R., Lomonaco, R., Engel, C., Courville, Z., and Perron, F.: Experimental determination of snow sublimation rate and stable-isotopic exchange, Ann. Glaciol., 49, 1–6, 2008.
Neumann, T. A., Albert, M. R., Engel, C., Courville, Z., and Per-ron, F.: Sublimation rate and the mass transfer coefficient for snow sublimation, Int. J. Heat Mass Tran., 52, 309–315, 2009. Otsu, N.: A threshold selection method from gray-level histograms,
IEEE T. Syst. Man. Cyb., 9, 62–66, 1979.
Pinzer, B. R. and Schneebeli, M.: Breeding snow: an instrumented sample holder for simultaneous tomographic and thermal studies, Meas. Sci. Technol., 20, 1–9, 2009a.
Pinzer, B. R. and Schneebeli, M.: Snow metamorphism under alter-ing temperature gradients: morphology and recrystallization in surface snow, Geophys. Res. Lett., 36, 10–13, 2009b.
Pinzer, B. R., Kerbrat, M., Huthwelker, T., Gaggeler, H. W., Schnee-beli, M., and Ammann, M.: Diffusion of NOx and HONO in snow: a laboratory study, J. Geophys. Res.-Atmos., 115, 1–12, 2010.
Pinzer, B. R., Schneebeli, M., and Kaempfer, T. U.: Vapor flux and recrystallization during dry snow metamorphism under a steady temperature gradient as observed by time-lapse micro-tomography, The Cryosphere, 6, 1141–1155, doi:10.5194/tc-6-1141-2012, 2012.
Schleef, S., Jaggi, M., Löwe, H., and Schneebeli, M.: Instruments and methods: an improved machine to produce nature-identical snow in the laboratory, J. Glaciol., 60, 94–102, 2014.
Schneebeli, M. and Sokratov, S. A.: Tomography of temperature gradient metamorphism of snow and associated changes in heat conductivity, Hydrol. Process., 18, 3655–3665, 2004.
Steen-Larsen, H. C., Masson-Delmotte, V., Hirabayashi, M., Win-kler, R., Satow, K., Prié, F., Bayou, N., Brun, E., Cuffey, K. M., Dahl-Jensen, D., Dumont, M., Guillevic, M., Kipfstuhl, S., Landais, A., Popp, T., Risi, C., Steffen, K., Stenni, B., and Sveinbjörnsdottír, A. E.: What controls the isotopic compo-sition of Greenland surface snow?, Clim. Past, 10, 377–392, doi:10.5194/cp-10-377-2014, 2014.
Sturm, M. and Johnson, J. B.: Natural convection in the subarctic snow cover, J. Geophys. Res., 96, 11657–11671, 1991.
Waddington, E. D., Cunningham, J., and Harder, S. L.: The effects of snow ventilation on chemical concentrations, in: Chemical Exchange Between the Atmosphere and Polar Snow, edited by: Wolff, E. W. and Bales, R. C., NATO ASI Series, 43, Springer, Berlin, 403–452, 1996.
Waldner, P., Schneebeli, M., Schultze-Zimmermann, U., and Flüh-ler, H.: Effect of snow structure on water flow and solute trans-port, Hydrol. Process., 18, 1271–1290, 2004.