International Journal for Quality Research 10(2) 421–432 ISSN 1800-6450
Gezahegn Tesfaye 1 Tesfu Berhane Berihu Zenebe Senait Asmelash
Article info: Received 20.07.2015 Accepted 09.02.2016
UDC – 638.124.8 DOI – 10.18421/IJQR10.02-12
A
LINEAR PROGRAMMING METHOD TO
ENHANCE RESOURCE UTILIZATION CASE
OF ETHIOPIAN APPAREL SECTOR
Abstract: The Ethiopian industrial development strategy is
1.
Introduction
1As the consequence of globalization and technological developments, the worldwide business environment has turned out to be highly competitive (Momaya, 2009). A manufacturing company’s survival in an increasingly competitive market closely depends upon its ability to produce highest quality products at lowest possible cost (Kumar, 2010). More specifically Ezema and Amakom (2012) asserted that organizations in the world are challenged by shortages of production inputs which can consequently lead to low capacity utilization and low production outputs. The authors stated that either cost minimization or output maximization is necessary to enhance the growth and competitiveness of organizations. Thus, companies have to create mechanisms that can support the improvement of their performances both in the national and international markets. Companies need to be aware of their internal processes, resource utilization and management to be competitive. Hence organizational resources are limited; every manufacturing company must use their resources optimally to increase their profit (Yalçinsoy et al., 2014). However, a key
challenge faced by these organizations is how to allocate scarce resources among activities. Linear programming is a method of allocating resourcesin an optimal way. It is one of the most widely used operations research tools (Reeb and Leavengood, 1998) to determine optimal resource utilization (Candes and Tao, 2005). Different products require different amount of production resources at several stages of production. They also have different selling prices and, therefore, have different unit profits. The production process may also be subjected to different conditions. The linear programming technique will be used to determine the
1Corresponding author: Gezahegn Tesfaye email: [email protected]
product mix that will maximize the total profit. It is the most flexible and extensively applied quantitative techniques. It is an efficient method for determining an optimal solution from a large number of alternatives to meet a specified objective functions subject to various constraints and restrictions (Shaheen and Ahmad, 2015). Using a linear programming method, we find the optimal, or most efficient, way of using limited resources to achieve the objective of the situation. Furthermore, as Oliver (2012) stated, linear programming refers to the problem of optimizing a linear objective function of several variables subject to a set of linear equality or inequality constraints. Linear programming is a mathematical technique and an aspect of operations research whose primary function is to allocate limited resources of the firm (Andawei, 2014). It refers to a planning process that allocates resources—labor, materials, machines, and capital—in the best possible (optimal) way so that costs are minimized or profits are maximized (Reeb and Leavengood, 1998). One of the application areas of LPP is the optimization of the product mix of organizations (Ezema and Amakom, 2012). After citing the work of Kortler (1993), the authors define product mix as “the set of all product lines and items that a particular seller or producer offers for sale to buyers”.
Model Components of a LPP
Like many other kinds of optimization problems, LPP is mathematical model which has different components. The most important components of a LPP model are:
Defining key - decision variables Setting objective functions
Writing mathematical expressions for constraints
Non-negativity Restriction Solving the mathematical model
Defining key - decision variables
determined in order to solve the problem. The decision variables represent unknown decisions to be made. This is in contrast to problem data, which are values that are either given or can be simply calculated from what is given. In this research, the decision variables are the number of products of each type to be produced. In general, the problem is said to be solved only when the best values of the variables have been identified. Typically, the variables represent the amount of resources to employ.
Setting objective functions
Every linear program has an objective. The objective of a LPP is either to maximize or to minimize the objective function. This objective has to be linear in the decision variables, which means it must be the sum of constants multiplied by decision variables. The objective function shows how each variable contributes to the value to be optimized in solving the problem. The coefficients of the objective function indicate the contribution to the value of the objective function of one unit of the corresponding variable.
Writing mathematical expressions for constraints
As a condition, linear programming problem must operate within the limits of restrictions placed upon the problem, which the decision maker must always take into consideration (Andawei, 2014). Constraints are the limitations such as available resource capacity, daily working hours, raw material availability, etc.
Non-negativity Restriction
In the many of the linear programming problems, and particularly in the product problems, the values of decision variables must be non-negative numbers.
Solving the mathematical model
A graphical method is a simplest method to solve a linear programming problem when
the number of decision variables is 2. However, most real-world linear programming problems have more than two decision variables and thus are too complex for graphical solution. Among the various methods of solving a linear programming problem the simplex method is one of the most powerful (Andawei, 2014). Computer programs and spreadsheets are available to handle the simplex calculations (Online Tutorial).
2.
The Problem Statement
In its economic reform program, the Ethiopian government has formulated a clear industrial development strategy (ETIDI, 2014). The strategy mainly focuses on export-led and labor intensive industrialization (Tesfaye et al, 2014). The
country is emerging as one of the most important investment destinations in Africa. The apparel sector is considered as one of the priority areas by the Government‘s Industrial Development Strategy (ETIDI, 2014). As a result many European and Asian organizations began production and sourcing apparels from Ethiopia. The investment on apparel products and hence the export market of the country has relatively shown minimal increments over the past years. Though there are many challenges facing the apparel sector of the country at the current time, many studies revealed that the country has a good potential to be a center for apparel manufacturing and sourcing, but only when the existing business conditions are improved. Demisse et al. (2015) noted
that garment manufacturing companies can make considerable contribution to national economies mainly for the developing world. The apparel sector is the area that can generate more income from the export market. However, studies shown that the performance of the Ethiopian apparel sector is much below the world standard (Razvan, 2008; Yisihak et al., 2011; Tesfaye et al,
2014; Demisse et al., 2015). According to
Ethiopian apparel sector remains trivial. Apart from the great ambition of the government to modernize the apparel sector with the objective of attracting foreign investors, the efforts made so far to improve the performance of the sector was insignificant (Ethiopia Trade and Investment, 2010; Samuel, 2012). The low global competitiveness of the Ethiopian apparel sector is mainly due to the inefficient use of their organizational resources (Project profile on garment industry; Abebe, 1997;
Assefa, 2008; Arefayne and Pal, 2014). In general terms, the country is challenged by inefficient use of manufacturing resources. Due to this fact, the Ethiopian apparel manufacturing companies must apply LPP in order to enhance resource utilization and increase their profit. In apparel manufacturing firms, production time, cost of labor and material, and material utilization significantly affect their profit (Arefayne and Pal, 2014). In this industrial sector cutting, sewing, and finishing operations are the major ones which deserve more attention for resource optimization. In general, in the context of Ethiopian apparel industry, it can be inferred that organizational resources are not utilized properly to the best level and the current work of the companies is only targeted towards fulfilling the production orders. As to the knowledge of the authors of this research, the issue of proper resource allocation remains the unsolved problem within the Ethiopian apparel industry. Thus, this paper focuses on how effective resource utilization can be established for Ethiopian apparel sector to increase their profit, taking a case study of one of the garment factories currently engaged in the export market. The study attempts to identify the existing resource utilization level and the profit per month of the case company and compare the results with the optimal solution obtained using a linear programming method. The case company has flow of work starting from receiving customer orders to packaging the finished products through the entire process of designing, sampling, cutting, sewing,
finishing and packaging. Currently, the products the case company produces are basic shirt, polo shirt, short pant, V-neck t-shirt and singlet. It is a challenging task for the decision makers of the company to identify the type of products (product mix) that ensure efficient resource utilization and maximum profit for the organization. The problem addressed here is to determine the proper product mix to be adopted by the company for efficient resource utilization that can enhance the global competitiveness of the company through the application of a linear programming technique. The following general assumptions have been made in this research:
There is sufficient demand for every product produced as a result of a bigger domestic and international market for apparel products.
The omission of fixed cost of production does not affect the finding of the research.
3.
Methodology
each of the five products have also been collected from the case company. A general methodology of a linear programming procedure (setting of objective function, constraints and non-negativity restriction) has been applied to set the data gathered from the company into its mathematical model. In order to solve the mathematical expression (i.e., the mathematical model developed for the case company), the MS-Excel solver for a linear programming technique was used. The optimal solution generated by the MS-Excel solver was compared against the existing company's performance of resource utilization and profit making. Finally, conclusions have been made regarding the findings of the study.
4.
Results and Discussion
4.1. Optimal solution of the Existing System
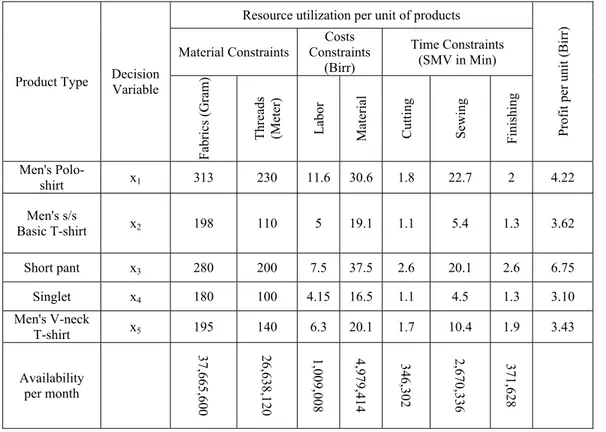
Materials, financial and time resources are the most critical organizational resources in apparel industry. Among the direct materials utilized in the production process of the company, fabrics and sewing threads are the decisive elements. The aim here is to determine the optimal material utilization. In the cost category, labor cost and materials cost constitutes the major proportion of the cost of finished apparels. The time required to process a unit of each product type have been estimated based on the company's recent five year historical data (see table 1). The company currently manufactures Men's Polo-shirt, Men's s/s Basic T-shirt, Short pant, Singlet, and Men's V-neck T-shirt. Each of these products are denoted by decision variables x1, x2,..., x5 respectively. For the two materials considered in this study (fabrics and threads), their consumptions per unit have been given in the 3rd and 4th columns of the table. Fabrics are given in gram per product and sewing
threads are shown in meter per product. Materials and labor costs per product are given in the 5th and 6th columns of the table respectively. The time constrain in minutes per product, which is another most critical factor, is given for the cutting, sewing and finishing operations as indicated in the 7th, 8th and 9th columns of the table. Finally, in the 10th column of the table, we get unit profit in birr (Ethiopia currency) for the five products. Now, having the types of products the company is producing, the list of decision variables and constraints, and the unit profits, we can formulate the mathematical model using a linear programming technique and solve it to arrive at optimal solution. As stated in section 1, a linear programming procedure with the following steps has been applied to solve the resource allocation problem of the case company.
Step 1: defining key - decision variables Step 2: setting objective functions to
maximize the total profit
Step 3: writing mathematical expressions for the material, cost and time constraints, and
Step 4: restricting the key-decision variables not to be negative values
Step 5: Solving the mathematical model developed through step 1 to step 4
Step 1: definition of decision variables
The optimal quantities of each type of product required to be produced by the company are denoted as follows:
x1 = the number of polo shirt to be produced x2 = the number of basic T-shirt to be
produced
x3 = the number of short pant to be produced x4 = the number of singlet to be produced x5 = the number of V-neck T-shirt to be
produced
Step 2: setting the objective function
Table 1. List of constraints and profit per product
Step 3: List of the constraints
Resource utilizations per unit of each product from table1 are taken as the coefficient of the decision variables and the availability of each resource per month are written as the right hand side of the constraints. Less than or equal to inequalities signs are used to reflect the fact that resource utilization can only be less than or equal to resource availability. The left hand side (LHS) of the constrains represent resource consumption and the right hand side (RHS) of the constraints show resource availability. Thus, based on the data in table 1, the list of constraints can be formulated as follows:
Fabric consumption (constrains 1 or C1) 313x1 + 198x2 + 280x3 + 180x4 + 195x5 ≤ 37,665,600
Thread consumption (C2)
230x1 + 110x2 + 200x3 + 100x4 + 140x5 ≤ 26,638,120
Labor cost (C3)
11.6x1 +5 X2 + 7.5x3 + 4.15x4 + 6.3x5 ≤ 1,009,008
Material Cost (C4)
30.6x1 + 19.1x2 + 37.5x3 + 16.5x4 + 20.1x5 ≤ 4,979,414
Cutting time availability (C5)
1.8x1 + 1.1x2 + 2.6x3 + 1.1x4 + 1.7x5 ≤ 346,302
Sewing time availability (C6)
22.7x1 + 5.4x2 + 20.1x3 + 4.5x4 + 10.4x5 ≤ 2,670,336
Finishing time availability (C7)
2x1 + 1.3x2 + 2.6x3 + 1.3x4 + 1.9x5 ≤ 371,628
Step 4: The non-negativity restriction
Since the number of products that can be produced cannot be negative values, all the decision variables must be restricted to be non-negative values. This, x1, x2, x3, x4, x5 ≥ 0
Product Type Decision Variable
Resource utilization per unit of products
Profit per
unit (
Birr)
Material Constraints Constraints Costs (Birr)
Time Constraints (SMV in Min)
Fabrics (Gram)
Threads (Meter) Labor Mate
ria
l
Cutting Sewing Finishing
Men's
Polo-shirt x1 313 230 11.6 30.6 1.8 22.7 2 4.22
Men's s/s
Basic T-shirt x2 198 110 5 19.1 1.1 5.4 1.3 3.62
Short pant x3 280 200 7.5 37.5 2.6 20.1 2.6 6.75
Singlet x4 180 100 4.15 16.5 1.1 4.5 1.3 3.10
Men's V-neck
T-shirt x5 195 140 6.3 20.1 1.7 10.4 1.9 3.43
Availability per month
Step 5: Solving the mathematical model using MS-Excel solver
Now, the optimal solution (optimal product mix and optimal profit) of the above mathematical model can be obtained.Indeed, there are several methods available to find the optimal solution, an MS-Excel solver was followed in this study. Major steps followed to apply the MS-Excel solver are:
1) Setting the target cell (G2 in this case): The target cell defines the objective function. It is the overall sum of profits per unit times their corresponding values of the decision variables.
2) Marking the cells which will be subjected to changes to find the optimal values of the decision variables: These cells are set to run from B2 to F2 in this research, where B2, C2, D2, E2 and F2 represent the optimal values of the decision variables x1, x2, x3, x4, x5, respectively. These variables are set to be only non-negative integer values.
3) The profits per unit are defined across the cells from B3 to F3. These values are multiplied by their corresponding values of the decision variables B2, C2, D2, E2, F2. The overall sum of their result gives the value of the target cell. See also step 1.
4) The coefficients of the constraints are defined as follows: from B5 to F5 B for the first constraint (C1), from B6 to F6 for C2, from B7 to F7 from C3, from B8 to F8 for C4, from B9 to F9 for C5, from B10 to F10 for C6, and from B11 to F11 for C7. These are multiplied by their correspondingly defined cell of the decision variables (cell from B2 to F2), their respective sum constitute the LHS of the constraints (column from G5 to G11).
5) Setting the sign of inequality in the MS-excel solver is needed as shown in the F column. Then, the RHS of each constraint is defined in column I.
Table 2. Output of the MS-Excel Solver
A B C D E F G F I
1 Decision
variables X1 X2 X3 X4 X5
2 Values of decision variables
0 8774 128315 0 0 897844
3 Profit/unit 4.22 3.62 6.75 3.10 3.43 4 Constraints Coefficients of decision variables in
constraints Left Side Hand
(Resource consumption)
Sign Right hand Side (Resource availability
5 C1 313 198 280 180 195 37665452 <= 37665600
6 C2 230 110 200 100 140 26628140 <= 26638120.2
7 C3 11.6 5 7.5 4.15 6.3 1006233 <= 1009008
8 C4 30.6 19.1 37.5 16.5 20.1 4979396 <= 4979413.888
9 C5 1.8 1.1 2.6 1.1 1.7 343270 <= 346302
10 C6 22.7 5.4 20.1 4.5 10.4 2626511 <= 2670336
11 C7 2 1.3 2.6 1.3 1.9 345025 <= 371628
Setting the target cell (G2)
Target cell value = $G$2 = $B$2*$B$3+ $C$2*$C$3+ $D$2*$D$3+ $E$2*$E$3+
$F$2*$F$3
By changing the cells $B$2:$F$2 Subject to
For fabric consumption, C1:
$G$5 = $B$2*$B$5+ $C$2*$C$5+ $D$2*$D$5+ $E$2*$E$5+ $F$2*$F$5 ≤ 37665600
For thread consumption, C2:
$G$6 = $B$2*$B$6+ $C$2*$C$6+ $D$2*$D$6+ $E$2*$E$6+ $F$2*$F$6 ≤ 26638120
For labor cost, C3:
$G$7 = $B$2*$B$7+ $C$2*$C$7+ $D$2*$D$7+ $E$2*$E$7+ $F$2*$F$7 ≤ 1,009,008
For material cost, C4:
$G$8 = $B$2*$B$8+ $C$2*$C$8+ $D$2*$D$8+ $E$2*$E$8+ $F$2*$F$8 ≤ 4,979,414
Cutting time availability, C5:
$G$9 = $B$2*$B$9+ $C$2*$C$9+ $D$2*$D$9+ $E$2*$E$9+ $F$2*$F$9 ≤ 4346,302
For Sewing time availability, C6:
$G$10 = $B$2*$B$10+ $C$2*$C$10+ $D$2*$D$10+ $E$2*$E$10+ $F$2*$F$10 ≤ 2,670,336
For Finishing time availability, C7:
$G$11 = $B$2*$B$11+ $C$2*$C$11+ $D$2*$D$11+ $E$2*$E$11+ $F$2*$F$11 ≤ 371,628
Finally, running the MS-Excel solver gives the optimal (new) solution of the model as follows: Optimal value of x1 = B2 = the optimal
number of polo shirt to be produced = 0 Optimal value of x2 = C2 = the optimal
number of basic T-shirt to be produced = 8,774 pieces per month
optimal value of x3 = D2 =the optimal number of short pant to be produced = 128,315 pieces per month
Optimal value of x4 = E2 = the optimal number of singlet to be produced = 0 Optimal value of x5 = F2 =the optimal
number of V-neck T-shirt to be produced = 0 and
Z maximum = maximum profit = G2= 897,891 Birr/month is the optimal profit per month
5.
Comparison of the Existing
Situation with the Optimal
Solution
In this section, comparison has been made between the existing scenario and the optimal solution obtained above. In this case, resource utilization and profit per month are used to compare the two cases (see table 3 and table 4).
5.1. Resource Utilization (Existing Situation)
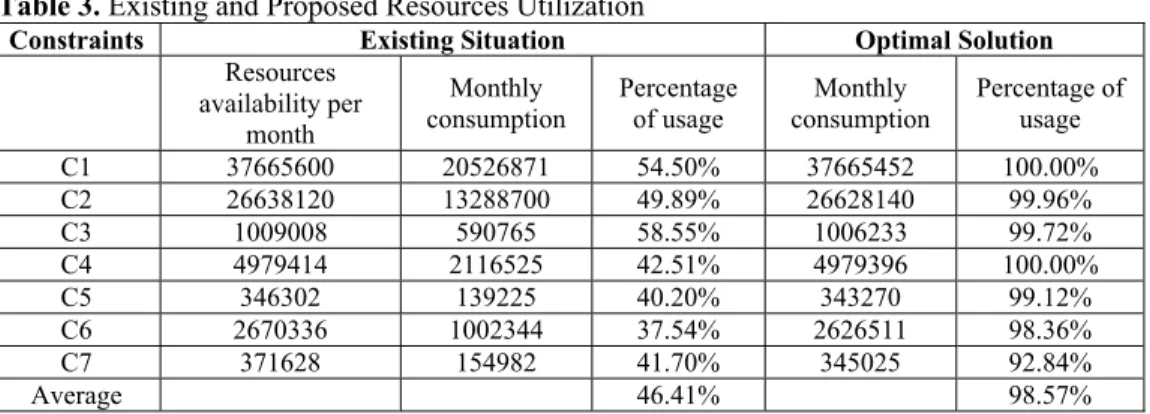
As shown in table 3 below, under the existing situation columns, the resource availability is the right hand side of the constraints outlined above. The monthly consumption figures for each organizational resource are obtained from the company inventory record file. For the existing situation, utilizations of the organizational resources have been calculated as the ratio of monthly consumption to the resource availability. It shows that with the existing situation, all of the organizational resources are extensively underutilized.
Table 3. Existing and Proposed Resources Utilization
Constraints Existing Situation Optimal Solution
Resources availability per
month
Monthly
consumption Percentage of usage consumption Monthly Percentage of usage
C1 37665600 20526871 54.50% 37665452 100.00%
C2 26638120 13288700 49.89% 26628140 99.96%
C3 1009008 590765 58.55% 1006233 99.72%
C4 4979414 2116525 42.51% 4979396 100.00%
C5 346302 139225 40.20% 343270 99.12%
C6 2670336 1002344 37.54% 2626511 98.36%
C7 371628 154982 41.70% 345025 92.84%
Optimal Solution
Under the optimal solution in table 3, we have two columns: the monthly consumption of resources and the percentage of resource utilization. The monthly consumptions of each resource are the values obtained and given under the left hand side column in table 2. They are the left hand sides of the
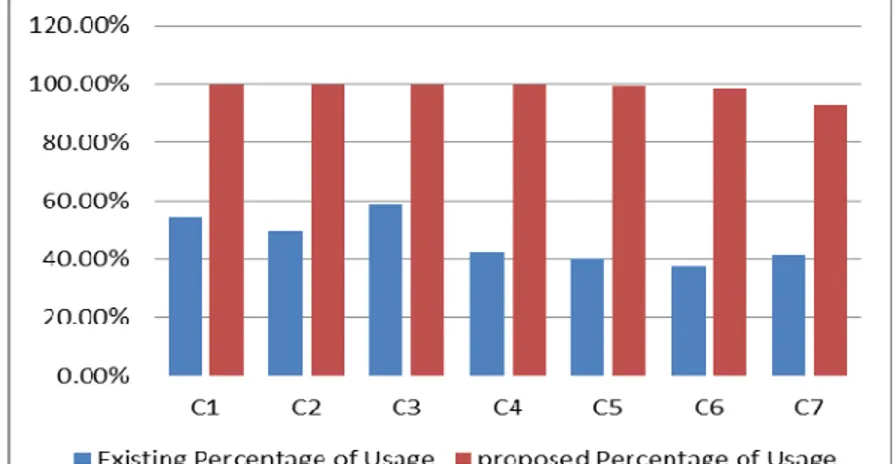
constraints. The level of resource utilization in the optimal solution is the ratio of optimal resource consumption to the resource availability in the existing system. The current study shows that the current resource utilization (46.41% on average) can be significantly improved to 98.57% (also see figure 1).
Figure 1. Comparison on existing and proposed resource utilization Table 4. Comparing Profit per month of the existing and new values
Product Existing Situation Optimal Solution
Monthly production
volume
Profit per
unit Profit/Month (Birr)
Proposed production volume/Month
Proposed Profit/Month
(Birr) Men's Polo-shirt
(X1) 15886 4.22 67,039 0 0
Men's s/s Basic
T-shirt (X2) 23916 3.62 86,576 8774 31718
Short pant (X3) 12864 6.75 86,832 128315 866126
Singlet (X4) 25667 3.10 79,568 0 0
Men's V-neck
T-shirt (X5) 13319 3.43 45,684 0 0
Total 91652 365,699 137089 897, 844
Profit per Month
The average monthly production output of the existing system was obtained from the factory (see table 4). These values have been multiplied by their respective unit profits to obtain the profit per month of each product.
be shown than with the new optimal solution, the profit of the company can be improved by 145.5% {= (897844-365699/365699)}. From this it can be said that if the company can implement the new solution, it can entertain very significant profit improvement.
6.
Conclusions
Due to its clear industrial development strategy, Ethiopia is becoming eminent destination in its apparel sector, which is expected to generate more income from the export market. However, the export earning of the sector, which is mainly caused by inefficient resource utilization, is very insignificant. This study identifies the existing resource utilization level and the profit per month of one of the Ethiopian apparel manufacturing companies using a linear programming technique. The total profit of the company was used as an objective function. In apparel manufacturing firms, efficient use of materials such as fabrics and sewing threads and processing time at different stages of production as well as minimization of labor and materials cost are necessary to enhance their profitability.
Seven constraints, namely fabric consumption, thread consumption, labor cost, material cost, cutting time, sewing time, and finishing time have been identified as the major factors contributing towards the low profitability of the company. According to this study, there is inefficient utilization of all organizational resources. The comparison between the existing and proposed systems and the measured difference between them is as follows with the order of (existing,
proposed, improvement): fabric consumption (54.50%, 100%, 45.50%), thread consumption (49.89%, 99.96%, 50.08%), labor cost (58.55%, 99.72%, 41.18%), material cost (42.51%, 100%, 57.49%), cutting time (40.20%, 99.12%, 58.92%), sewing time (37.54%, 98.36%, 60.82%) and finishing time (41.70%, 92.84%, 51.14%). From this point of view, it can be concluded that with the existing system the company uses its resources inefficiently. Thus, it is possible to argue that the global competitiveness of the company can be improved to a significant level by implementing the proposed solution. Currently the company produces five types of products with the following production volumes (pieces) per month (Men's Polo-shirt, 15886; Men’s s/s Basic T-Polo-shirt, 23916; Short pant, 12864; Singlet, 25667; Men's V-neck T-shirt, 13319). However, these volumes of production will only give a total profit of 365,699 per month for the company. Based on this study, the company can significantly increase its profitability and global competitiveness by producing only two types of products (Men's s/s Basic T-shirt, 8774; Short pant, 128315) and nothing of the other three. In this case the profit of the company can be improved by 145.5 % (i.e., from 365,699 birr per month to 897, 844 birr per month). In general, from this study, it can be said that the new solution provides very significantly improvement in organizational resource utilization and profitability. Finally, we concluded that this remarkable profit increment of the company can certainly enhance the company’s global competitiveness.
References
:Abebe, R. (2007). Opportunities and Challenges of Development for Africa in the Global Arena.African Economic Conference, Addis Ababa, Ethiopia.
Arefayne, D., & Pal, A. (2014). Productivity Improvement through Lean Manufacturing Tools: A Case Study on Ethiopian Garment Industry. International Journal of Engineering Research & Technology(IJERT),3(9), 1037-1045.
Assefa, B. (2008). Determinants of the Performance of the Garment Industry in Ethiopia.
Ethiopian Development Research Institute, Addis Ababa, Ethiopia.
Candes, E. J., & Tao, T. (2005). Decoding by Linear Programming. Information Theory, IEEE Transactions, 51(12), 4203-4215.
Demissie, A., Kitaw, D., & Matebu, A. (2015). Quality Assessment on the Garment Enterprises in Ethiopia. Proceedings of the 2015 Industrial and Systems Engineering Research Conference.
Ethiopian Trade and Investment. (2010). Invest in Ethiopian Textiles: Investment Opportunities, Addis Ababa, Ethiopia.
ETIDI. (2014). Textile Industry Development in Ethiopia. An Overview of Facts and Opportunities, Addis Ababa, Ethiopia.
Ezema, B.I., & Amakoml, U. (2012). Optimizing Profit with the Linear Programming Model: A Focus on Golden Plastic Industry Limited, Enugu, Nigeria. Interdisciplinary Journal of Research in Business, 2(2), 37- 49.
Kotler, P. (1993). Marketing Management: Analysis, Planning, Implementation and Control,
Prentice-Hall of India Private Limited, New Delhi.
Kumar, V. (2010). JIT Based Quality Management: Concepts and Implications in Indian Context. International Journal of Engineering Science and Technology, 2(1), 40-50.
Momaya, K. (2009). Evaluating Country Competitiveness in Emerging Industries: Learning from a Case of Nanotechnology. Journal of International Business and Economy, 9(1),
37-58
Online Tutorial. The Simplex Method of Linear Programming, Retrieved from:
http://wps.prenhall.com/wps/media/objects/9434/9660836/online_tutorials/heizer10e_tut3.pd f Accessed October 28, 2015
Project profile on garment industry. Retrieved from: www.ethiopiaemb.org.cn/invest/ Garment_project_profile_Final.docx Accessed on July 14, 2015
Razvan, I. (2008). Ethiopian Garment Sector Assessment, Addis Ababa, Ethiopia.
Reeb, J. and Leavengood, S. (1998). Using the Simplex Method to Solve Linear Programming Maximization Problems. Oregon State University, Extension Service.
Samuel, S. (2012). Investigation on the Effect of Supply Chain Integration on Ethiopian Garment Industry’s Performance. A Thesis Submitted to the Department of Management. Addis Ababa University, Addis Ababa, Ethiopia.
Shaheen, S., & Ahmad, T. (2015). Linear Programming Based Optimum Resource Utilization for Manufacturing of Electronic Toys. International Research Journal of Engineering and Technology (IRJET), 2(1), 261-264
Tesfaye, G., Kitaw, D., & Matebu, A. (2014). A Total Manufacturing Solutions Technique to Select Appropriate Improvement Strategy: Case Study of a Footwear Factory. International Journal of Quality Research, 8(3), 371 - 384.
Yisihak, N., Begna, T., & Solomon, T. (2011). Technological Capabilities of Ethiopian Textile and Garment Industries, Addis Ababa, Ethiopia.
Gezahegn Tesfaye Addis Ababa University, Addis Ababa Institute of Technology
Addis Ababa Ethiopia
Tesfu Berhane Bahir Dar University, Ethiopian Institute of Textile and Fashion Technology Bahir Dar
Ethiopia
Berihu Zenebe Bahir Dar University, Ethiopian Institute of Textile and Fashion Technology Bahir Dar
Ethiopia
Senait Asmelash Bahir Dar University, Ethiopian Institute of Textile and Fashion Technology Bahir Dar
Ethiopia