* Corresponding author. Tel.: +9809127434515 E-mail addresses: [email protected] (A. Shirdeli) © 2012 Growing Science Ltd. All rights reserved. doi: 10.5267/j.msl.2012.05.021
Contents lists available at GrowingScience
Management Science Letters
homepage: www.GrowingScience.com/msl
Probable maximum precipitation 24 hours estimation: A case study of Zanjan province of Iran
Azim Shirdeli*
Department of Civil Engineering, Zanjan University Zanjan, Iran A R T I C L E I N F O A B S T R A C T
Article history: Received March 15, 2012 Received in Revised form March, 15, 2012 Accepted 16 May 2012 Available online May 18 2012
One of the primary concerns in designing civil structures such as water storage dams and irrigation and drainage networks is to find economic scale based on possibility of natural incidents such as floods, earthquake, etc. Probable maximum precipitation (PMP) is one of well known methods, which helps design a civil structure, properly. In this paper, we study the maximum one-day precipitation using 17 to 50 years of information in 13 stations located in province of Zanjan, Iran. The proposed study of this paper uses two Hershfield methods, where the first one yields 18.17 to 18.48 for precipitation where the PMP24 was between 170.14 mm and 255.28 mm. The second method reports precipitation between 2.29 and 4.95 while PMP24 was between 62.33 mm and 92.08 mm. In addition, when the out of range data were deleted from the study of the second method, precipitation rates were calculated between 2.29 and 4.31 while PMP24 was between 76.08 mm and 117.28 mm. The preliminary results indicate that the second Hershfield method provide more stable results than the first one.
© 2012 Growing Science Ltd. All rights reserved. Keywords:
Probable maximum precipitation PMP
Civil structures Maximum Likelihood
1. Introduction
past few years. Rezacova et al. (2005) explained the necessity of using new techniques for estimating floods for reservoir outflow structure s in the Czech Republic (CR) based on undesirable incidents happened in the Odra flood in Central Europe in 1997. They aimed to use some statistical data of the point and area PMP estimates for precipitation duration of 1 to 5 days. The use of radar data in evaluating the maximized area reduction factor was explained and the relationship resulting from the radar measurements over the CR territory was outlined. They reported the results obtained by comparing the rainfalls in 1997 and 2002 flood events with the PMP estimates. The comparison demonstrated that the maximum area rainfalls over small Czech catchments had not exceed 63% of the corresponding PMP values.
Carmen Casas et al. (2010) estimated PMP in Barcelona from 5 minutes to 30 hours. They used two various techniques and compared, where the first one was associated with a physical method based on the maximization of actual storms, and the Hershfield’ statistical method (Hershfield, 1961, 1965; Chow et al., 1988). The PMP results calculated based on two techniques were very similar and for both cases. Desa M et al. (2001) explained PMP for stations in Malaysia using Hershfield method as mean plus 15 standard deviations processed from yearly maximum rainfall information. The data of 15 as frequency factor was too high for a humid region such as Malaysia. Desa M et al. (2001) in their work used yearly maximum 1-day rainfall data of about 30–60 years for 33 stations in the region of Selangor, Malaysia and estimated PMP for 1-day duration based on a suitable frequency factor. The PMP map was reported as an important method to determine reliable and consistent PMP estimate for any location in Selangor, Malaysia, for designing relatively expensive hydraulic structures. Tingsanchali and Tanmanee (2012) performed the hydrological assessment by estimating the PMP over Mae Sruai River Basin using two techniques, where the first PMP method is based on statistical approach while the second one is based on storm maximization and transposition approach to calculate the 1-day, 2-day and 3-day PMPs.
In this paper, we present an implementation of PMP method to predict precipitation in city of Zanjan, Iran. The organization of this paper first explains the proposed method in section 2 and details of findings are given in section 3. The paper ends with concluding remarks to summarize the contribution of the paper.
2. The proposed model
There different ranges for PMP and a 24-hour scale is shown as PMP24 and it is calculated as follows,
,
t n n
x =x +Kσ (1)
where xtis the precipitation height for back period τ , xn and
σ
n are the average and standarddeviation of xt, respectively. In addition, ν is the number of precipitation and Kis the frequency. Let
m be the subscript representing the maximum amount of xand K.Therefore, we have,
n m n
PMP=x +K
σ
(2)In order to calculate PMP, we use the following three techniques.
2.1 First Hershfield method
This is the official method recommended by many governmental organization to calculate PMP and it is as follows,
A. Shirdeli / Management Science Letters 2 (2012)
2239
2. Remove the maximum value from the data and calculate xn−m and
σ
n−m,3. Calculated adjusted value for xn and
σ
nbased on xn,σ
n, xn−m andσ
n−m,4. Based on the statistical time horizon calculate imply corrected coefficients into xn and
σ
n,5. Calculate PMP
2.2. The Second method: An extended Hershfield method
In the second method, we do our calculation without considering the maximum precipitation as follows,
( n m) / ,
m m n L
K = X −X − σ − (3)
where xmis the maximum precipitation, xn m− and
σ
n m− are the average and standard deviation of the data after removing the maximum precipitation.There is also another technique where we define lower and upper limits for the data. Then we remove any data located outside the limits (The third method).
3. Case study
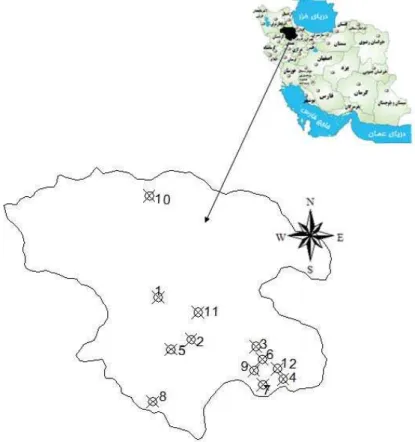
Zanjan has an area of 22,164 km², occupying 1.34% of the Iranian territory, the average population density in Zanjan is 4¼ people per km and it is located on north-west of Iran. The average precipitation is about 323 mm and the number of snow days is 115 days. There are 13 stations located in this province, which calculates precipitation for, at least, 17 years.
Table 1
Characteristics of different stations in province of Zanjan
Station Period (year) Altitude Latitude Longitude
1 50 1663 36-41 48-29
2 36 1780 36-26 48-47
3 35 2020 36-25 49-02
4 35 1433 36-03 49-22
5 35 1850 36-08 48-45
6 33 1693 36-18 49-04
7 31 1910 36-00 49-05
8 31 1830 35-48 48-41
9 31 1819 36-09 49-03
10 30 1750 37-06 48-11
11 29 2028 36-18 48-54
12 24 1575 36-11 49-11
13 17 ** -
-In order to examine whether the data are equally distributed we use the following,
4
1 ( 1)
i
n n n
τ = ∑ −
− ,
(4)
4 10 9 ( 1)
n n n
τ
σ = +
− ,
(5)
where τ is the Kendall ratio and
σ
τ is the standard deviation of Kendall ratio. Table 2 shows the ratiosof
τ σ
/ τfor all stations,Table 2
The summary of
τ σ
/ τfor 13 stationsStation 1 2 3 4 5 6 7 8 9 10 11 12 13
n 50 41 37 36 37 35 33 33 31 30 31 24 17
/ τ
τ σ
-6.23 -6.58 -3.19 -4.87 -3.79 -2.93 -3.22 -3.87 -4.74 -3.26 -2.70 -0.89 -0.33Based on the calculations given in Table 2, the data for station 12 and station 13 were not suitable and therefore we set them aside for the next step. Table 3 shows details of our computations for three proposed methods explained earlier.
Table 3
The summary of PPM method using three different methods
Station 1 2 3 4 5 6 7 8 9 10 11
First method 202.74 229.55 230.26 170.14 205.43 199.00 192.43 187.15 215.09 205.92 255.28 Second method 76.12 83.90 91.13 62.33 72.74 73.15 71.20 73.30 80.72 79.90 92.08 Third method 97.96 110.26 95.17 76.08 85.15 95.99 93.31 76.57 99.48 87.89 117.28
A. Shirdeli / Management Science Letters 2 (2012)
2241
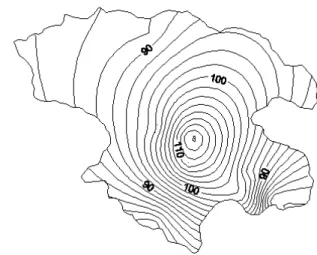
Fig. 1. Precipitation rate for the third method
As we can observe from the information of the Fig. 1, the maximum precipitation rate is located near the center of province while the maximum rate of precipitation rate is on the corner sides of the province.
4. Conclusion
In this paper, we have explained the relative importance of designing civil structures such as water storage dams and irrigation and drainage networks based on economic scale using the possibility of natural incidents such as floods, earthquake, etc. The proposed model of this paper used probable maximum precipitation to calculate the maximum precipitation. We have used three methods, based on Hershfield methods, which implement the maximum one-day precipitation using 17 to 50 years of information in 13 stations located in province of Zanjan, Iran. The results of the first model yielded 18.17 to 18.48 for precipitation where the PMP24 was between 170.14 mm and 255.28 mm. The results of the second method reported precipitation between 2.29 and 4.95 while PMP24 was between 62.33 mm and 92.08 mm. In addition, when the out of range data were deleted from the study of the second method, precipitation rates were calculated between 2.29 and 4.31 while PMP24 was between 76.08 mm and 117.28 mm. The preliminary results have indicated that the second Hershfield method provide more stable results than the first one.
Acknowledgment
The authors would like to thank the anonymous referees for constructive comments on earlier version of this paper.
References
Chow, V. T., Maidment, D. R., & Mays, L. W. (1988). Applied Hydrology, McGraw-Hill, USA Desa M, M.N., Noriah, A.B., & Rakhecha, P.R. Probable maximum precipitation for 24 h duration
over southeast Asian monsoon region—Selangor, Malaysia. Atmospheric Research, 58(1), 41-54. Eliason, J. (1997). A statistical model for extreme precipitation. Water Resources Research,33(3),
449-455.
precipitation estimates, United States east of the 105th meridian. Hydrometeorological Rep. 52, National Weather Service, Silver Spring, MD, 176.
Hershfield, D. M. (1961). Estimating the probable maximum precipitation. Journal of Hydraulic Engineering, 87, 99–106.
Hershfield, D.M. (1965) Method for estimating probable maximum precipitation.
Journal of American Water Works Association, 57, 965–972.
Koutsoyainnis, D. (1999). A probabilistic view of Hershfield’s method for estimating probable maximum precipitation”, water Resource , Res.
Maidment, D.R. (1992). Handbook of Hydrology. McGraw–Hill, USA.
Rezacova, D., Pesice, P., & Sokol, Z. (2005). An estimation of the probable maximum precipitation for river basins in the Czech Republic. Atmospheric Research, 77(1-4), 407-421.
Tingsanchali, T., Tanmanee, S. (2012). Assessment of hydrological safety of Mae Sruai Dam, Thailand. Procedia Engineering, 32, 1198-1204