Nat. Hazards Earth Syst. Sci., 12, 459–473, 2012 www.nat-hazards-earth-syst-sci.net/12/459/2012/ doi:10.5194/nhess-12-459-2012
© Author(s) 2012. CC Attribution 3.0 License.
Natural Hazards
and Earth
System Sciences
Probabilistic sensitivity analysis of two suspension bridges in
Istanbul, Turkey to near- and far-fault ground motion
¨
O. C¸ avdar
G¨um¨us¸hane University, Department of Civil Engineering, 29000, G¨um¨us¸hane, Turkey
Correspondence to:O. C¨ ¸ avdar (ozlem [email protected])
Received: 1 October 2011 – Revised: 12 December 2011 – Accepted: 13 December 2011 – Published: 28 February 2012
Abstract.The aim of this paper is to compare the near-fault and far-fault ground motion effects on the probabilistic sensi-tivity dynamic responses of two suspension bridges in Istan-bul. Two different types of suspension bridges are selected to investigate the near-fault (NF) and far-fault (FF) ground motion effects on the bridge sensitivity responses. NF and FF strong ground motion records, which have approximately identical peak ground accelerations, of the Kocaeli (1999) earthquake are selected for the analyses. Displacements and internal forces are determined using the probabilistic sensi-tivity method (PSM), which is one type of stochastic finite element method. The efficiency and accuracy of the pro-posed algorithm are validated by comparison with results of the Monte Carlo Simulation (MCS) method. The displace-ments and internal forces obtained from the analyses of sus-pension bridges subjected to each fault effect are compared with each other. It is clearly seen that there is more seismic demand on displacements and internal forces when suspen-sion bridges are subjected to NF and FF ground motion.
1 Introduction
Bridges have contributed to the development of civiliza-tion for a long time. The suspension bridges, Fatih Sul-tan Mehmet and Bosporus Bridges, located on Bosporus straits in Istanbul, a mega city of significant seismic haz-ard in Turkey. Istanbul has a population of approximately 15 million people and is located astride the Bosporus River, which divides it into European and Asian side. Suspension types of bridges are becoming more and more popular in the construction of long span bridges due to their many advan-tages, i.e. light in weight, efficient in load resistance, and of smaller cross sections. Suspension bridges which consist of main girders, towers and hanger are complicated structures. The hangers are vertical and connect to the deck and cable with singly hinged bearing. There are several factors
af-fecting the dynamic response of suspension bridges to earth-quake ground motions (Adanur, 2003).
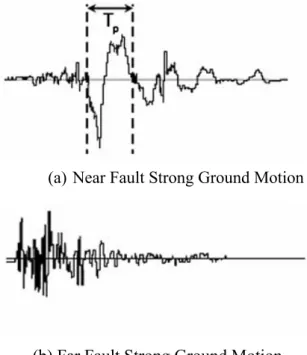
Near fault ground motions have been recorded in major earthquakes such as 1999 Taiwan Chi-Chi, 1989 Loma Pri-eta, 1994 US Northridge, 1995 Japan Hyogoken-Nanbu and 1999 Kocaeli earthquake in Turkey, and it is noticed that they have large velocity pulses. It produces high input energy on structures in the beginning of the earthquake. The ground motions with the velocity pulses recorded in the vicinity of an earthquake fault are quite different from the usual far-fault earthquake ground motions. Comparison of the near-fault strong ground motion velocities with far-fault strong ground motions is shown in Fig. 1. These pulses are strongly in-fluenced by the orientation of the fault, the direction of slip on the fault and the location of the recording station rela-tive to the fault, which is termed as “directivity effect” due to the propagation of the rupture toward the recording site (Agrawal and He, 2002; Somerville, 2003; Megawati et al., 2001; Wang et al., 2002). The velocity pulse duration in the near-fault ground motions is larger than 1.0 s. In addi-tion, the ratio of the peak ground velocity (PGV) to the peak ground acceleration (PGA) of the near-fault ground motions is larger than 0.1 s. The ground motions having these charac-teristics expose the structure to high input energy in the be-ginning of the earthquake (Liao et al., 2004) and cause large structural responses. Therefore, structural response to near-fault ground motions has received much attention in recent years. So far, dynamic response analyses of some structures subjected to near-fault ground motions have been performed (Liao et al., 2004; Hall et al., 1995; Malhotra, 1999; Chopra and Chintanapakdee, 2001). In these studies, it is seen that long period structures such as frame buildings and bridges experience a higher dynamic response when they are sub-jected to near-fault ground motion.
(a)
Near Fault Strong Ground Motion
rong Ground Motion (b) Far Fault Strong Ground Motion
Fig. 1. The time-histories of two different strong ground motion velocities.
studies (Megawati et al., 2001; Liao et al., 2004; Chopra and Chintanapakdee, 2001; Bertero et al., 1978; Hall et al., 1995; Corigliano et al., 2006; ¨Ozturk, 2006; Dicleli and Buddaram, 2007; Liao et al., 2001; Bayraktar et al., 2008). Megawati et al. (2001) derived the ground motions at the piers from the vi-bration records of the towers to discuss the possibility of the rupture in the step-over by examining these ground motions. Liao et al. (2004) studied the dynamic behavior of a five-span concrete pier bridge subjected to both near-fault and far-field ground motions. Liao et al. (2001) investigated the dynamic response of seismic isolated continuous girder bridges sub-jected to either near-fault or far-field ground motions as com-pared to the non-isolated ones. It can be clearly seen from these studies that the importance of near-fault ground mo-tion effect on the response of the structures has been high-lighted. These studies were based on the assumption of com-plete determinacy of structural parameters. This is usually re-ferred to as deterministic analysis. In reality, however, there are uncertainties in design variables. These uncertainties in-clude geometric properties, material mechanical properties, load magnitude and distribution, etc. Therefore, determin-istic analysis cannot provide complete information regard-ing dynamic responses of long-span bridges with cables. To identify changes in the material and geometrical properties of a bridge, probabilistic sensitivity method (PSM) is required. The probabilistic sensitivity method (PSM) for structures has been developed by several researchers (Kleiber and Hien, 1992; Hien and Kleiber, 1991; C¸ avdar et al., 2010; Juhn and Manolis, 1992; Melchers and Ahammed, 2004; Cheng and
Xiao, 2005; Liu et al., 1999). The concept of probabilis-tic sensitivity, aims to find the expectations and the sensi-tivity response for changes in the structural response due to structural parameter variations. The probabilistic sensitivity analysis of any structural system involves computation of the derivatives of the structural response quantities like displace-ments, strains, stresses, eigenvalues, eigenvectors etc. Very few researchers (Cheng and Xiao, 2005; Liu et al., 1999) have studied the random variable material and geometrical properties of long-span bridges having steel cables. Cheng and Xiao (2005) proposed a finite-element-based algorithm for the probabilistic free vibration and flutter analyses of sus-pension bridges. Liu et al. (1999) showed that large-flexible structures, such as suspension bridges, actually possess ran-dom material properties and that these ranran-dom properties un-avoidably affect the dynamic system parameters. However, there has been no sufficient research about the near-fault and far-fault ground motion effect on the stochastic sensitivity fi-nite element analysis of complex suspension bridges.
The main objective of this paper is to compare the proba-bilistic sensitivity earthquake response of suspension bridges subjected to both near-fault and far-fault ground motion ex-citations. For this purpose, the detailed two-dimensional structural finite element models of Bosporus and Fatih Sultan Mehmet bridges were prepared and the probabilistic dynam-ics sensitivity was made. The Kocaeli earthquake records that displayed a ground motion with apparent velocity pulse are selected to represent the near-fault earthquake character-istics. For comparison, earthquake ground motions recorded at the same site from Kocaeli earthquake, the epicenter of which is far away from the site, are employed as the far-fault ground motions, to illustrate the difference between the NF and FF earthquake characteristics. Only the vertical com-ponent of the ground motions is used as input to determine the probabilistic dynamic behavior of the suspension bridges. During probabilistic dynamics sensitivity analysis, displace-ments and internal forces of the systems are obtained from PSM and MCS methods by using different uncertainties of material properties. Elastic modulus is chosen as the random variable material properties. The analysis results obtained from these two methods are compared with each other.
This work carries a great importance due to the fact that it includes the probabilistic dynamics sensitivity analysis of the Bosporus and Fatih Sultan Mehmet Bridges as well as quake performance under the action of the Kocaeli earth-quake for both bridges in the same work.
2 The Probabilistic Sensitivity Method (PSM)
O. C¸ avdar: Probabilistic sensitivity analysis of two suspension bridges 461 Time [sec] 7 6.5 6 5.5 5 4.5 4 3.5 3 2.5 2 1.5 1 0.5 0 A cce le ra tio n [ g ] 0.2 0.15 0.1 0.05 0 -0.05 -0.1 -0.15 -0.2 -0.25
(a) The time-histories of ground motion acceleration
Time [sec] 6.5 6 5.5 5 4.5 4 3.5 3 2.5 2 1.5 1 0.5 0 A cce le ra tio n [ g ] 20 10 0 -10 -20 -30
(b) The time-histories of ground motion velocity
Velocity [c m/sn] Time [sec] 6.5 6 5.5 5 4.5 4 3.5 3 2.5 2 1.5 1 0.5 0 A cce le ra tio n [ g ] 20 10 0 -10 -20 -30
(c) The time-histories of ground motion displacement
Fig.2. Acceleration (a) velocity (b) and displacement (c) time-histories for near-fault ground motion recorded at Yarimca in Kocaeli earthquake
Displacement [c
m]
Fig. 2. Acceleration(a)velocity(b) and displacement(c)time-histories for near-fault ground motion recorded at Yarimca in Kocaeli earthquake.
time instant response sensitivities are considered here in the context of probabilistic behavior. This paper deals with ran-dom displacement sensitivity when the structure involves the modulus of elasticity (E) as a random parameter.
A deterministic equation of motion can be written as
Mαβq¨β+Cαβq˙β+Kαβqβ=Qα (1)
whereKαβ,Mαβ,Cαβ denote the stiffness matrix, mass
ma-trix and damping mama-trix,q¨β,q˙β,qβ denote the acceleration,
velocity, displacement, respectively. The probabilistic per-turbation based approach consists usually of the up to the second order equations obtained starting from the determin-istic ones.
The objective of the probabilistic sensitivity analysis is to determine changes in the structural response functional with variations in design parameters.
For a linear elastic system with N degrees of freedom, consider the system response over the time interval [0,T] de-scribed by the integral functional (Kleiber and Hien, 1992; Hien and Kleiber, 1991).
ϕ(hd,bp)=
Z τ
0
Gqα(hd,bp;τ ),hd
dτ (2)
d=1,2,...,D;ρ=1,2...,N;α=1,2,...,N
whereGis a given function of its arguments,hd is aD di-mensional design variable vector, bp is an N˜-dimensional
random variable vector andqα is anN-dimensional vector
of nodal displacement-type variables.
The nodal displacement-type variables qα(hd,bp;τ ) are
implicit functions of the random and design variables and sat-isfy the spatially discredited equation of motion of the form: Zeroth-order equation ( C0 terms, one pair of systems of
N linear simultaneous ordinary differential equations for
qβ0(hd,b0ρ;τ) andλα0(hd,b0ρ;τ )τ ǫ[0,T], respectively).
Mαβ0 (hd,b0ρ)q¨β0(hd,b0ρ;τ )+Cαβ0 (hd,bρ0)q˙β0(hd,bρ0;τ )
+Kαβ0 (hd,b0ρ)qβ0(hd,b0ρ;τ )=Q0α(hd,b0ρ;τ )
together with the homogeneous initial conditions
qα0(ha,bρ;0)=0; ˙qα0(ha,bρ;0)=0;
Mαβ0 (hd,b0ρ)λ¨0β(hd,b0ρ;τ )−C0αβ(hd,b0ρ)λ˙0β(hd,b0ρ;τ )
+Kαβ0 (hd,b0ρ)λ0β(hd,b0ρ;τ )=G0α(hd,b0ρ;τ )
λα0(hd,bρ;T )=0; λ˙0α(hd,bρ;T )=0 (3)
First-order equations, ( C1 terms, N˜-pairs systems of
N linear simultaneous ordinary differential equations for
qα,ρ(hd,bρ;τ );λαρ(hd,bρ0,τ ),τ ǫ[0,T], respectively.)
Time [sec] 5.6 5.4 5.2 5 4.8 4.6 4.4 4.2 4 3.8 3.6 3.4 3.2 3 2.8 2.6 2.4 2.2 2 1.8 1.6 1.4 1.2 1 0.8 0.6 0.4 0.2 0 A cce le ra tio n [ g ] 0.05 0 -0.05 -0.1 -0.15 -0.2
(a) The time-histories of ground motion acceleration
Time [sec] 5.6 5.4 5.2 5 4.8 4.6 4.4 4.2 4 3.8 3.6 3.4 3.2 3 2.8 2.6 2.4 2.2 2 1.8 1.6 1.4 1.2 1 0.8 0.6 0.4 0.2 0 A cce le ra tio n [ g ] 6 4 2 0 -2 -4 -6 -8 -10
(b) The time-histories of ground motion velocity 5
Velocity [c
m/sn]
(b) The time-histories of ground motion velocity
Time [sec] 5.6 5.4 5.2 5 4.8 4.6 4.4 4.2 4 3.8 3.6 3.4 3.2 3 2.8 2.6 2.4 2.2 2 1.8 1.6 1.4 1.2 1 0.8 0.6 0.4 0.2 0 A cce le ra tio n [ g ] 5 4 3 2 1 0 -1 -2 -3 -4
(c) The time-histories of ground motion displacement
Fig.3 Acceleration (a) velocity (b) and displacement (c) time-histories for far-fault ground motion recorded at Gebze in Kocaeli earthquake.
Displacement [c
m]
Fig. 3.Acceleration(a)velocity(b)and displacement(c)time-histories for far-fault ground motion recorded at Gebze in Kocaeli earthquake.
+Kαβ0 (hd,b0ρ)qβ,ρ(hd,b0ρ;τ )=Qρα(hd,b0ρ;τ )
qα,ρ(hd,b0ρ;τ )=0; ˙qα,ρ(hd,bρ;0)=0
Mαβ0 (hd,b0ρ)λ¨,ρβ (hd,b0ρ;τ )−Cαβ0 (hd,bρ0)λ˙,ρβ(hd,b0ρ;τ )
+Kαβ0 (hd,b0ρ)λ,ρβ(hd,b0ρ;τ )=Gρα(hd,bρ0;τ )
λ,ρα(hd,bρ;T )=0; ˙λ,ρα(hd,bρ;T )=0, ρ=1,2...,N˜ (4)
Second-order ( C2 terms, one pair of systems of N
linear simultaneous ordinary differential equations for;
qα(2)(hd,b0ρ;τ )andλ (2)
α (hd,b0ρ;τ ),τ ε[0,T], respectively.)
Mαβ0 (hd,b0ρ)q¨β(2)(hd,b0ρ;τ )+Cαβ0 (hd,bρ0)q˙β(2)(hd,bρ0;τ )+
Kαβ0 (hd,b0ρ)qβ(2)(hd,b0ρ;τ )=Q(α2)(hd,bρ0;τ )
qα(2)(hd,bρ;0)=0; ˙qα(2)(hd,bρ;0=0)
Mαβ0 (hd,b0ρ)λ¨β(2)(hd,bρ0;τ )−Cαβ0 (hd,b0ρ)λ˙β(2)(hd,b0ρ;τ )
+Kαβ0 (hd,b0ρ)λ(β2)(hd,bρ0;τ )=G(α2)(hd,b0ρ;τ )
λ(α2)(hd,bρ;T )=0; ˙λ(α2(hd,bρ;T )=0 (5)
In Eqs. (3)–(5) the indices run over the following se-quence:
qα(2)(hd,b0ρ,τ )=qα,ρσ(hd,bρ0;τ )Sbρσ
λα(2)(hd,bρ0;τ )=λ,ρσα (hd,b0ρ;τ )Sbρσ ρ,σ=1,2,...,N .˜ (6) In Eqs. (4)–(5) the first and second order primary and adjoint generalized load vectors are denoted by:
Qρα(hd,b0ℓ;τ )=Q,ρα(hd,b0ℓ;τ )−
"
Mαβ,ρ(hd,bℓ0)q¨β0(hd,b0ℓ;τ )
+Cαβ,ρ(hd,b0ℓ)q˙β0(hd,b0ℓ;τ )+Kαβ,ρ(hd,bℓ0)qβ0(hd,b0ℓ,τ )
#
(7)
Gρα(hd,b0ℓ;τ )=G,ρα (hd,bℓ0;τ )
−
"
Mαβ,ρ(hd,b0ℓ)λ¨0β(hd,b0ℓ;τ )
+Cαβ,ρ(hd,bℓ0)λ˙0β(hd,b0ℓ;τ )+Kαβ,ρ(hd,bℓ0)λ0β(hd,b0ℓ,τ )
#
Q(α2)(hd,b0ℓ;τ )
=
Q,ρσα (hd,b0ℓ;τ )−2
"
Mαβ,ρ(hd,b0
ℓ)q¨ ,σ β(hd,b0ℓ;τ )
+Cαβ,ρ(hd,b0ℓ)q˙
,σ
β(hd,bℓ0;τ )+K ,ρ αβ(hd,b0ℓ)q
,σ β(hd,b0ℓ;τ )
#
−
"
Mαβ,ρσ(hd,b0ℓ)q¨β0(hd,b0ℓ;τ )+C ,ρσ
αβ(hd,b0ℓ)q˙β0(hd,bℓ0;τ )
+K,ρσαβ(hd,b0
ℓ)q0β(hd,b0ℓ;τ )
#
Sbρσ
O. C¸ avdar: Probabilistic sensitivity analysis of two suspension bridges 463 =
G,ρσα (hd,bℓ0;τ )−2
"
Mαβ,ρ(hd,b0
ℓ)λ¨ ,σ β(hd,b0ℓ;τ )
+Cαβ,ρ(hd,bℓ0)λ˙,σβ(hd,b0ℓ;τ )+K
,ρ
αβ(hd,b0ℓ)λ,σβ(hd,b0ℓ;τ )
#
−
"
Mαβ,ρσ(hd,b0
ℓ)λ¨0β(hd,bℓ0;τ )+C ,ρσ
αβ(hd,b0ℓ)λ˙0β(hd,b0ℓ;τ )
+Kαβ,ρσ(hd,b0
ℓ)λ0β(hd,b0ℓ;τ )
#
Sbρσ
whereτ is forward time variable,N˜ is the number of nodal random variables. Mαβ0 ,Cαβ0 andKαβ0 are system mass ma-trix, damping matrix and system stiffness mama-trix, respec-tively. Q0α,qβ0 andN are load vector, displacement of the nodal random variable and the number of degrees of free-dom in the system, respectively. Sbρσis covariance matrix of nodal random variables. (.)0is zeroth-order quantities, taken at means of random variables,(.),ρis first partial derivatives with respect to nodal random variables, and(.),ρσ is second partial derivatives with respect to nodal random variables.
The Monte Carlo Simulation generates a set of random values ofXaccording to its probability distribution function. The set can be written asX= {x1,x2,. . . , xN}, whereN is
the number of simulation. For each values ofX,the stiffness and mass matrices are computed. At the end of N simula-tions, we have a random set of displacement and stress values
qβ 1,qβ 2,qβ 3,...,qβ N ,{σ}1,{σ}2,{σ}3,...,{σ}N
forXi.From this finite set of solutions, the expected values of displacement and stress are computed using the following formulas:
µ{qβ} = 1 N
N
X
i=1
qβ i (9)
µ{σ}=
1
N
N
X
i=1
{σ}i (10)
A direct Monte Carlo simulation (MCS) is also performed for comparison of results. The MCS method is a quite versa-tile mathematical tool capable of handling situations where all other methods fail to succeed; in structural dynamics, it has attracted intense attention only recently, following the widespread availability of inexpensive computational sys-tems (Shinozuka, 1972). A sample global stiffness matrix is formed on the basis of probabilistic fields generated by means of the covariance matrix decomposition algorithm. The response sensitivity of the structure is determined by re-lying on the standard deterministic sensitivity analysis. This procedure is repeated several times to procedure an ensem-ble of the structural response sensitivity. In MCS, the ran-dom stiffness matrix needs to be inverted for each simulated structure, consuming an enormous amount of CPU time.
3 Earthquake records selected for near-fault (NF) and far-fault (FF) ground motions
In this study, the Kocaeli earthquake, 17 August 1999, has been used as the ground motion. The earthquake magnitude 7.4 occurred at Marmara Region in 1999, causing major hu-man, social and economic losses in Turkey. The record at the
Yarimca station (Fig. 2) of the Kocaeli earthquake is selected to represent the characteristics of near-fault ground motion. The record at the Gebze station (Fig. 3) for the same earth-quake is employed to represent the characteristics of far-fault ground motion. The properties of these records (Peer, 2011) are summarized in Table 1.
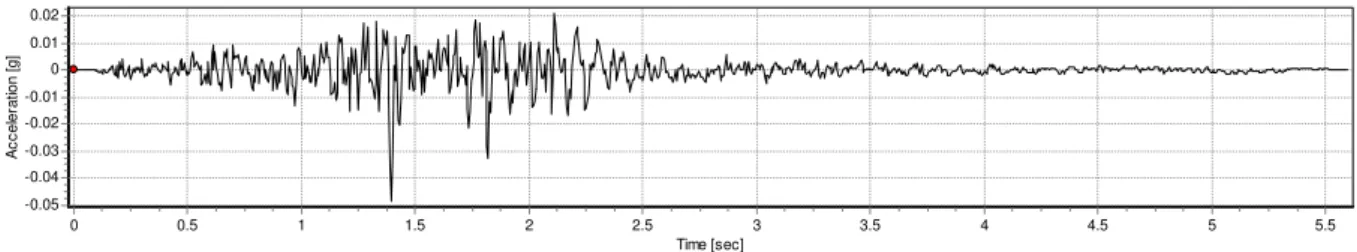
As shown in Figs. 2–3, the velocity pulse of the NF ground motion is found to be significant as compared to the far-fault ground motion. The NF ground motion possesses signifi-cantly long period velocity pulse. This long period response of the NF ground motion is more excessive than the one of the FF ground motion. Some important parameters, such as the ratio of PGV to PGA, normalized spectral velocity and the energy of the ground motion, are evaluated in the present study in order to discuss the feature of bridges sensitivity to NF and FF ground motions, where the normalized spec-tral velocity means the response specspec-tral velocity obtained by scaling the PGA of the input ground motion to 0.242 g. The peak ground acceleration of FF records is scaled up to 0.242 g in the analyses. This analysis is helpful for the en-gineering design of seismic suspension bridges. Figure 4 presents acceleration time-histories for scaled FF ground mo-tions.
In order to investigate the near- and far-fault effects on the probabilistic response of suspension bridges, the earthquake analyses of the bridges are performed. The Kocaeli (1999) earthquake was recorded with the magnitude of 7.4 and this magnitude is the same for both records considered in this study. The distance of the recording site from the source is ranged from 2.6 to 17 km. A scatter plot of the magnitude– distance pair for the records of strong ground motions is shown in Fig. 5. The record characterizing near-fault ground motion is obtained from the distance less than 10 km to epi-center and the other record characterizing far-fault ground motion is obtained from the distance more than 10 km to epi-center.
4 Numerical examples
Table 1.Properties of selected near-fault ground motion record (the component YPT-UP) and far-fault ground motion record (the component GBZ-UP) in Kocaeli Earthquake (M=7.4), 17 August 1999.
Ground motion Component Station Distance PGA PGV PGD PGV/PGA
to fault (km) (g) (cm/sn) (cm) (s)
Near-Fault YPT-UP Yarimca 2.6 0.242 30.8 29.55 0.129
Far-fault GBZ-UP Gebze 17 0.203 11.4 4.78 0.057
Table 2.Structural material and sectional properties of Bosporus Suspension Bridge (Adanur, 2003).
Members Elastic modulus Cables sectional Moments of Poisson’s Mass Density (kN m−2) area(m2) inertia (m4) ratio (ton m−3)
Deck 2.05×10⁸ 0.861 1.238 0.3 14.97
Hanger 1.62×10⁸ 0.0021 3.068×10⁻⁷ 0.3 8.004
Main cable 1.93×10⁸ 0.205 3.344×10⁻³ 0.3 8.629
Backstay cable 1.93×10⁸ 0.219 3.817×10⁻³ 0.3 8.334
Tower 2.05×10⁸ 0.68 4.9 0.3 7.85
4.1 Probabilistic sensitivity earthquake response of Bosporus Suspension Bridge
The Bosporus Suspension Bridge, commissioned in 1973, joins the European and Asian Continents through Ortakoy and Beylerbeyi districts of Istanbul. It is a gravity-anchored suspension bridge with steel pylons and inclined hangers. The bridge has a main span of 1074 m (World rank 12th) and two side spans of 231 m and 255 m on the European and the Asian sides, respectively. The bridge has slender steel tow-ers 165 m high, with a steel box-deck and inclined hangtow-ers. The horizontal distance between the cables is 28 m and the roadway is 21 m wide, accommodating three lanes each way. The roadway at the mid-span of the bridge is approximately 64 m a.s.l. The side span decks are not connected to the cable and the decks rest on piers taken to foundation level. The cost of the bridge amounted to USD 200 million (Adanur, 2003). General arrangement of the Bosporus Suspension Bridge is shown in Fig. 6. In addition, material and sectional properties such as main cable, back stay cable, hangers, deck, etc. of the Bosporus Suspension Bridge are shown in Table 2.
To investigate the probabilistic response of the Bosporus Suspension Bridge under to NF and FF ground motions, a two-dimensional mathematical model is used for calcula-tions. Dumanoglu and Severn (1990) verified that 2-D anal-ysis provides natural frequencies and mode shapes which are in close agreement with those obtained by 3-D analysis in the vertical direction for suspension bridges. The finite element model of Bosporus Suspension Bridge is shown in Fig. 7. As the deck, towers and cables are represented by beam el-ements, the hangers are represented by truss elements in the model. Because the side span decks are not connected to the
cable, they are not considered in the finite element model. The finite element model of the Bosporus Suspension Bridge with inclined hangers has 161 nodal points, 159 beam ele-ments and 118 truss eleele-ments and the model is represented by 469 degrees of freedom. This model has three degrees of freedom at each nodal point, namely, two translational de-grees of freedom in vertical and longitudinal axes and one rotational degree of freedom in lateral axis.
The Bosporus suspension bridge is modeled by 277 prob-abilistic finite elements of different length. Elastic module from material properties is chosen as the random variable for the suspension bridge. The other variables are considered as deterministic. This random variable is assumed to follow a normal distribution with the coefficient of variation 0.10. The respective expectation and correlation function and co-efficient of variation for the elastic modulusEρ are assumed
as follows (Kleiber and Hien, 1992):
E[Eρ] =2.1×10⁸ λ=10
µ(Eρ,Eσ)=exp −
xρ−xσ
λl
!
ρ,σ=1,2,...,277
α=0.10
wherexρ, l andλ are ordinates of the element midpoints
O. C¸ avdar: Probabilistic sensitivity analysis of two suspension bridges 465
Time [sec]
5.5 5
4.5 4
3.5 3
2.5 2
1.5 1
0.5 0
A
cce
le
ra
tio
n
[
g
]
0.02 0.01 0 -0.01 -0.02 -0.03 -0.04 -0.05
.
Fig. 4.Acceleration time-histories for scaled far-fault ground motion.
0.0 2.0 4.0 6.0 8.0 10.0
Magnitude 0.0
4.0 8.0 12.0 16.0 20.0
Di
st
an
ce
(
k
m
)
(7.4; 17)
(7.4; 2.6)
Fig. 5.Magnitude-distance distribution.
With the 2-D time-instant sensitivity response of the struc-tural system of Fig. 7, the strucstruc-tural response functional is defined as
ϕ(τ )= [qβ(τ )] 2
(qβ(A))2−1≤0
whereqβ(τ )is vertical displacement at the apex A andqβ(A)
is an admissible displacement value. The elastic module is assumed to be random design variables.
Probabilistic dynamics sensitivity analyses response of multi-degrees-of-freedom suspension bridges is considered for NF and FF ground motion in this paper. The maxi-mum displacements and internal forces of the suspension bridges are calculated according to Probabilistic Sensitiv-ity Method (PSM) for NF and FF ground motions. The efficiency and accuracy of the proposed algorithm are vali-dated by comparison with results of the Monte Carlo Simu-lation (MCS) method.
In the first part of this study, Bosporus Bridge probabilis-tic sensitivity responses with respect to random elasprobabilis-tic mod-ulus according to PSM and MCS methods are determined and compared with each other. The absolute maximum verti-cal displacement responses of the bridge deck and horizontal displacements along the Bosporus European tower obtained
from PSM and MCS methods for NF and FF ground mo-tion are presented in Fig. 8. Two analyses give very close results each other at the 1/3 length distance from end of deck and at the top point of tower where maximum displace-ments occurred. The maximum displacedisplace-ments for the record YPT-UP and GBZ-UP of the Kocaeli earthquake occur as 66.80 cm and 12.29 cm, respectively. The maximum hori-zontal displacements at tower for the record FF and NF occur as 5.21 cm and 1.04 cm, respectively.
It is shown from Fig. 8 that the sensitivity displacement values for NF ground motion are greater than those for FF ground motion, although the peak ground acceleration of NF and FF records is the same. This situation is valid for both PSM and MCS response. The average absolute differences between NF and FF ground motions for vertical displacement values are about 84 % for PSM.
Comparing PSM and MCS methods gives closer results to each other. The average absolute differences between these two methods for vertical displacement values are about 2.65 % and 1.30 %, for NF and FF ground motions, respec-tively.
The maximum axial forces, shear forces and bending mo-ments at the deck of the Bosporus Bridge obtained from probabilistic dynamics sensitivity analysis subjected to both NF and FF ground motion are presented Fig. 9. It is seen that maximum sensitivity internal forces are revealed by the NF and FF ground motions, and their values are higher for mid-dle of deck measurements. Overall, maximum internal forces are higher for near-fault ground motion than far-fault. It is seen from Fig. 8 that values acquired from MCS and PSM methods are close to each other. As shown in Fig. 9, the min-imum differences between the axial forces, shear forces and bending moments of these two methods are 0.06 %, 0.09 % and 0.18 %, respectively. Average differences for these inter-nal forces are about 1.70 %, 2.50 % and 3.19 %, respectively. 4.2 Probabilistic sensitivity earthquake response of
Fatih Sultan Mehmet Suspension Bridge
Fig. 6.General Arrangement of Bosporus Suspension Bridge.
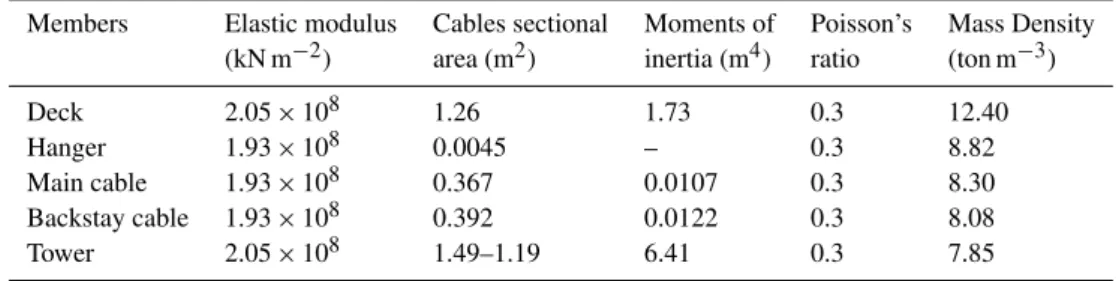
Table 3.Structural material and sectional properties of Fatih Sultan Mehmet Suspension Bridge (Apaydın, 2002).
Members Elastic modulus Cables sectional Moments of Poisson’s Mass Density (kN m−2) area (m2) inertia (m4) ratio (ton m−3)
Deck 2.05×10⁸ 1.26 1.73 0.3 12.40
Hanger 1.93×10⁸ 0.0045 – 0.3 8.82
Main cable 1.93×10⁸ 0.367 0.0107 0.3 8.30
Backstay cable 1.93×10⁸ 0.392 0.0122 0.3 8.08
Tower 2.05×10⁸ 1.49–1.19 6.41 0.3 7.85
Fig. 7.Two-dimensional finite element model of Bosporus Suspen-sion Bridge.
Continents in Istanbul, Turkey, has a box girder deck 39.4 m wide overall and 1090 m long. There are no side spans and the steel towers rise 110 m above ground level. The hang-ers are vertical and connect to the deck and cable with singly hinged bearing. The horizontal distance between the cables is 33.8 m and the roadway is 28 m wide, accommodating two four-lane highways. The roadway at the mid-span of the bridge is approximately 64 m above the sea level. General arrangement of the bridge is shown in Fig. 10. Also,
cross-sectional properties of the elements of the bridge are pre-sented in Table 3.
O. C¸ avdar: Probabilistic sensitivity analysis of two suspension bridges 467
-600 -500 -400 -300 -200 -100 0 100 200 300 400 500 600
Bridge Span (m) 70.0
60.0 50.0 40.0 30.0 20.0 10.0 0.0
Ve
rt
ic
al D
is
p
la
ce
m
en
t (c
m
) PSM (NF)
MCS (NF) PSM (FF) MCS (FF)
(a)
0.0 2.5 5.0 7.5 10.0 Horizontal Displacement (cm)
0.0 50.0 100.0 150.0 200.0
To
w
er
He
ig
ht
(
m
)
PSM (NF) MCS (NF) PSM (FF) MCS (FF)
(b)
Fig. 8. Maximum sensitivity vertical displacements at the deck of Bosporus Bridge(a)and maximum horizontal displacements along Bosporus European tower(b)for random elastic modulus.
As the deck, towers, and cables of the selected bridge are modeled by beam elements; the hangers are modeled by truss elements. A finite element model of the bridge with 144 nodal points, 142 beam elements and 60 truss el-ements are used in the analyses (Fig. 11). This model has three degrees of freedom at each nodal point, namely, two translational degrees of freedom in vertical and longitudinal axes and one rotational degree of freedom in lateral axis. So, the finite element model of the bridge is decreased to 418 de-grees of freedom and therefore a 2-D analysis is adopted in the vertical plane of the bridge.
YPT-UP and GBZ-UP component of the 17 August 1999, Kocaeli, Turkey earthquake (Figs. 2–3) are chosen as ground
motion since it took place at the vicinity of the bridges. For earthquake response analysis of many types of structures, the vertical component of ground motion may not be important. For long-span bridges like suspension bridges, however, ver-tical ground motion is important. In this study, only the vertical component of the ground motion is applied to the bridge to determine the vulnerability of this bridge to earth-quake ground motion.
-600 -500 -400 -300 -200 -100 0 100 200 300 400 500 600 Bridge Span (m)
7500 6000 4500 3000 1500 0
Ax
ia
l F
o
rce
(k
N)
PSM (NF)
MCS (NF)
PSM (FF)
MCS (FF)
(a)
r p
r
r
-600 -500 -400 -300 -200 -100 0 100 200 300 400 500 600
Bridge Span (m) 900
750 600 450 300 150 0
Sh
ea
r Fo
rce
(
k
N)
PSM (NF)
MCS (NF) PSM (FF)
MCS (FF)
(b)
-600 -500 -400 -300 -200 -100 0 100 200 300 400 500 600
Bridge Span (m) 3.5x10⁴
3.0x10⁴ 2.5x10⁴
2.0x10⁴
1.5x10⁴ 104
5.0x10³
0.0x100
Be
n
d
in
g
Mo
m
en
t (
k
N
m
)
PSM (NF)
MCS (NF) PSM (FF)
MCS (FF)
(c)
Fig.9. Maximum sensitivity axial forces (a), shear forces (b) and bending moment (c) for deck of
O. C¸ avdar: Probabilistic sensitivity analysis of two suspension bridges 469
Fig. 10.General arrangement of Fatih Sultan Mehmet Suspension Bridge.
Fig. 11.2-D finite element model of Fatih Sultan Mehmet suspen-sion bridge.
accuracy (Brownjohn and Dumanoˇglu, 1992). So, the first 20 modes of vibration are adopted for the response calcula-tions.
The elastic module from material properties is chosen as the random variable for the Fatih Sultan Mehmet suspension bridge. The other variables are considered as deterministic. This random variable is assumed to follow a normal distri-bution with the coefficient of variation 0.10. The respective expectation and correlation function and coefficient of vari-ation (C¸ avdar et al., 2010) for the elastic modulus Eρ are
assumed as follows:
E[Eρ]= 2.1x10⁸ λ=10
µ(Eρ,Eσ)=exp −
xρ−xσ
λl
!
ρ,σ=1,2,...,186
α=0.10
wherexρ,landλare ordinates of the element midpoints (n
random variable,ρ,σ=1,2,...,n), structural member length and decay factor, respectively. The Fatih Sultan Mehmet
suspension bridge is modeled by 186 probabilistic finite ele-ments with different lengths. Consistent with modeling pa-rameters for the Bosporus Bridge, MCS method is simulated for 10 000 simulations. With the 2-D time-instant sensitiv-ity response of the structural system of Fig. 11, the structural response functional is defined as
ϕ(τ )= [qβ(τ )] 2
(qbet a(A))2−1≤0
whereqβ(τ )is vertical displacement at the apex A andqβ(A)
is an admissible displacement value.
The elastic module is assumed to be random design vari-ables.
-600.0 -500.0 -400.0 -300.0 -200.0 -100.0 0.0 100.0 200.0 300.0 400.0 500.0 600.0 Bridge Span (m)
60.0 50.0 40.0 30.0 20.0 10.0 0.0
Ve
rti
cal
D
isp
la
ce
me
nt
(
m
)
PSM (NF)
MCS (NF)
PSM (FF)
MCS (FF)
(a)
0.0 2.5 5.0 7.5 10.0
Horizontal Displacement (cm) 100.0
150.0 200.0
To
w
er
He
ight
(
m
)
PSM (NF)
MCS (NF) PSM (FF) MCS (FF)
(b)
Fig. 12.Maximum sensitivity vertical displacements at the deck of Fatih Sultan Mehmet Bridge(a)and maximum horizontal displacements along Fatih Sultan Mehmet European tower(b)for random elastic modulus.
GBZ-UP of the Kocaeli earthquake occur as 48.50 cm and 11.89 cm, respectively. The average absolute differences be-tween NF and FF ground motions for vertical displacement values are about 74 % for PSM.
It can be seen from Fig. 12 that the maximum values of probabilistic dynamic sensitivity responses for the random elastic module are very similar to the result from the MCS method. For accurate dynamic responses, it is necessary that the analysis technique incorporate the effect of structural pa-rameter randomness. This has special importance for accu-rate probabilistic dynamics sensitivity of complex systems, which exhibit wide dispersion in structural parameters.
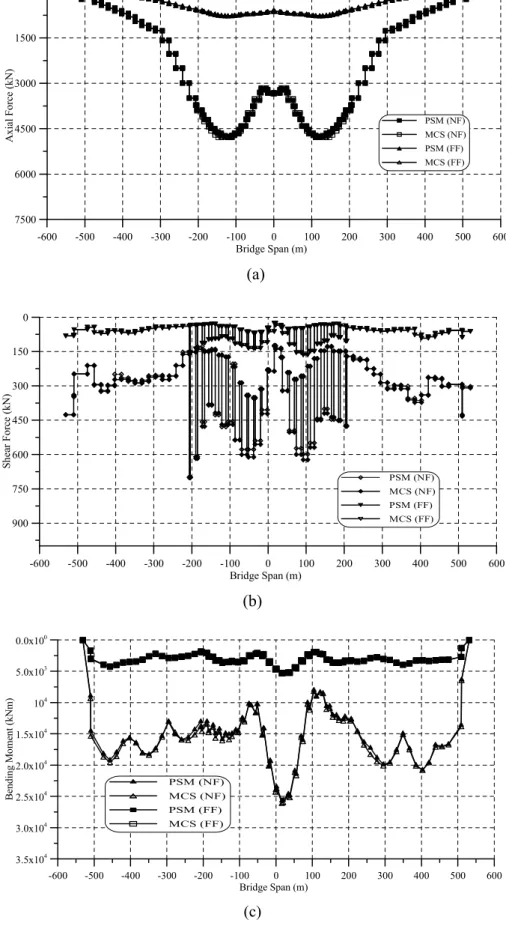
The maximum probabilistic sensitivity axial forces, shear forces and bending moments at the deck of the Fatih Sultan
Mehmet Bridge obtained from probabilistic dynamics sensi-tivity analysis subjected to each ground motion are presented Fig. 13. The probabilistic sensitivity variations of the inter-nal forces with deck distance are plotted separately for both near-fault and far-fault ground motions, as shown in Fig. 13. In this figure, PSM and MCS responses are compared to each other. As seen from the figure, the maximum probabilis-tic axial forces, shear forces and bending moment calculated for the YPT-UP component of NF ground motion are greater than those for FF ground motion at the deck of the Fatih Sul-tan Mehmet Bridge.
O. C¸ avdar: Probabilistic sensitivity analysis of two suspension bridges 471
-600 -450 -300 -150 0 150 300 450 600
Bridge Span (m) 1500
1250 1000 750 500 250 0
Ax
ia
l Fo
rce
(
k
N)
PSM (NF)
MCS (NF)
PSM (FF)
MCS (FF)
(a)
-600 -450 -300 -150 0 150 300 450 600
Bridge Span (m) 1500
1250 1000 750 500 250 0
S
h
ea
r Fo
rce
(k
N)
PSM (NF) MCS (NF) PSM (FF) MCS (FF)
(b)
-600 -500 -400 -300 -200 -100 0 100 200 300 400 500 600
Bridge Span (m) 4.0x10⁴
3.5x10⁴
3.0x10⁴
2.5x10⁴
2.0x10⁴
1.5x10⁴
104
5.0x10³
0.0x100
B
en
d
ing M
o
m
ent (k
N
m
)
PSM (NF)
MCS (NF)
PSM (FF)
MCS (FF)
(c)
motion are greater than those for far-fault ground motion, al-though the peak ground acceleration of near-fault and far-fault records are the same.
It should be mentioned that for the other results obtained for these examples, for the Bosporus Suspension Bridge sys-tem whose numerical properties are presented (Fig. 7), about 8 s are needed for probability dynamic sensitivity analysis subjected to NF and FF ground motion. However, about 11 h are needed for MCS analysis with a PC that has Intel Core 2 Duo CPU P8600 2.40 GHz and 2.00 GB RAM. For the prob-abilistic sensitivity analysis of the Fatih Sultan Mehmet Sus-pension Bridge system whose numerical properties are given (Fig. 10), about 5 s are needed for the PSM; however, about 9 h are needed for the MCS analysis of 10 000 simulations.
The probabilistic sensitivity responses obtained show that selected correlation function suitable for this example for chosen coefficient of variation (COV) value (α=0.10).
The examples clearly demonstrate the efficiency, robust-ness and desirability application potential of the proposed PSM-based algorithm. The algorithm can be used routinely for the probabilistic forced vibration analysis and design of the complex suspension bridges as an alternative to the cur-rently available methods.
5 Conclusions
In this study, probabilistic sensitivity responses of two sus-pension bridges subjected to both near-fault and far-fault ground motions are investigated. The Bosporus and Fatih Sultan Mehmet suspension bridges in Turkey are chosen for analyses. These two suspension bridges are modeled by the probabilistic finite element method. Stochastic dy-namics sensitivity analyses of suspension bridges are real-ized by using PSM and MCS methods. For this purpose, two-dimensional probabilistic finite element models of both bridges are prepared in the same study and the results of the probabilistic dynamics sensitivity analysis are presented. In addition to this, accuracy of it has been checked by compar-ing to other analytical method (MCS).
This study confirms the importance of the ground mo-tion selecmo-tion for the accurate evaluamo-tion of the probabilis-tic dynamics sensitivity performance of suspension bridges. It should be clarified that the NF and FF ground motion ef-fects appear for the duration of the earthquake. The results obtained from the probabilistic dynamics sensitivity analysis of the suspension bridges show that the displacement values and internal forces for NF ground motion are greater than those for FF ground motion, although the peak ground accel-eration of NF and FF records are the same. In light of the presented results, it is apparent that the probabilistic sensi-tivity response of the selected suspension bridges subjected to NF ground motion is greater affected than those subjected to FF ground motion.
According to this study, the earthquake record of the NF and FF ground motion, forming of the combination of nu-merous waves, has a remarkable effect on the probabilistic sensitivity earthquake response of the suspension bridges. It is seen from the conclusions of this study that different NF and FF strong ground motion records should be considered in the probabilistic dynamic sensitivity analysis of complex suspension bridges.
The presented numerical technique is well suited for computer-aided analysis for structural systems. The Proba-bilistic Sensitivity Method (PSM) is very effective, as it pro-vides sufficient accuracy for a small range of chosen coef-ficient of variation (COV). For the suspension bridges mod-eled in this study, the PSM gives close results to the MCS method for probabilistic sensitivity displacements and inter-nal forces. With the numerical applications in this study, it is shown that the PSM is able to provide, at an attractive com-putational cost, a good estimation of the sensitivity response variability.
Finally, the probabilistic dynamics sensitivity analysis can identify the degree of robustness of the final design with respect to randomness of selected system parameters. This information can be used to determine whether system parameters uncertainty should be considered explicitly in the structural design process. The probabilistic sensitivity information provides a deeper insight into the structural design and it can be used as a basis for decision-making.
Edited by: M. E. Contadakis
Reviewed by: two anonymous referees
References
Adanur, S.: Geometrically nonlinear deterministic and stochastic analyses of suspension bridges to multiple support seismic exci-tations, PhD. Thesis, Karadeniz Technical University, 2003. Agrawal, A. K. and He, W. L.: A closed-form approximation
of near-fault ground motion pulses for flexible structures, 15th ASCE Engineering Mechanics Conference, New York, 2002. Apaydın, N.: Seismic Analysis of Fatih Sultan Mehmet Suspension
Bridge, Ph.D. Thesis, Department of Civil Engineering, Boˇgazic¸i University Istanbul, Turkey, 2002.
Bayraktar, A., Altunıık, A. C., Sevim, B., Kartal, M. E., and Turker, T.: Near-fault ground motion effects on the nonlinear response of dam-reservoir-foundation systems, Struct. Eng. Mech., 28, 4, 411–442, 2008.
Bertero, V. V., Mahin, S. A., and Herrera, R. A.: A seismic de-sign implications of near-fault San Fernando earthquake records, Earthq. Eng. Struct. Dyn., 6, 31–42, 1978.
Brownjohn, J. M. W., Dumanoˇglu, A. A., and Severn, R. T.: Am-bient vibration survey of the Fatih Sultan Mehmet (Second-Bosporus) suspension bridge, Earthquake Eng. Struct. Dynam., 21, 10, 907–924, 1992.
O. C¸ avdar: Probabilistic sensitivity analysis of two suspension bridges 473
Cheng, J. and Xiao, R. C.: Probabilistic free vibration and flut-ter analyses of suspension bridges, Eng. Struct., 27, 1509–1518, 2005.
Chopra, A. K. and Chintanapakdee, C.: Comparing response of SDF systems to near-fault and far-fault earthquake motions in the context of spectral regions, Earthquake Eng. Struct. Dynam., 30, doi:10.1002/eqe.92, 2001.
Corigliano, M., Lai, C. G., and Barla, G.: Seismic response of rock tunnels in near-fault conditions, in: First European Conference on Earthquake Engineering and Seismology, Geneva, Switzer-land, 3–8 September, 2006.
Dicleli, M. and Buddaram, S.: Equivalent linear analysis of seismic-isolated bridges subjected to near-fault ground motions with for-ward rupture directivity effect, Eng. Struct., 29, 21–32 2007. Dumanoglu, A. A. and Severn, R. T.: Stochastic response of
sus-pension bridges to earthquake forces, Earthquake Eng. Struct. Dynam., 19, 133–152, 1990.
Hall, J. F., Heaton, T. H., Halling, M. W., and Wald, D. J.: Nearsource ground motion and its effects on flexible buildings, Earthq. Spectra, 11, doi:10.1193/1.1585828, 1995.
Hien, T. D. and Kleiber, M.: Stochastic design sensitivity in struc-tural dynamics”, Int. J. Numer. Methods Eng., 32, 1247–1265, 1991.
Juhn, G. and Manolis, G. D.: Stochastic sensitivity and uncertainty of secondary systems in base-isolated structures, J. Sound. Vi-bration, 159, 207–222, 1992.
Kleiber, M. and Hien, T.: The stochastic finite element method, John Wiley and Sons, New York, USA, 1992.
Liao, W. I., Loh, C.-H., and Wan, S.: Earthquake responses of mo-ment frames subjected to near-fault ground motions, Struct. Des. Tall Build., 10, 219–229, 2001.
Liao, W. I., Loh, C. H., and Lee, B. H.: Comparison of dy-namic response of isolated and non-isolated continuous girder bridges subjected to near-fault ground motions, Eng. Struct., 26, doi:10.1016/j.engstruct.2004.07.016, 2004.
Liu, C. H., Wang, T. L., and Qin, Q.: Study on sensitivity of modal parameters for suspension bridges, Struct. Eng. Mech., 8, 453– 464, 1999.
Malhotra, P. K.: Response of buildings to near-field pulse-like ground motions, Earthquake Eng. Struct. Dynam., 28, doi:10.1002/(SICI)1096-9845(199911)28:11< 1309::AID-EQE868>3.3.CO;2-L, 1999.
Megawati, K., Higashihara, H., and Koketsu, K.: Derivation of near-source ground motions of the 1995 Kobe (Hyogo-ken Nanbu) earthquake from vibration records of the Akashi Kaikyo Bridge, and its implications, Eng. Struct., 23, 1256–1268, 2001. Melchers, R. E. and Ahammed, M.: A fast approximate method for parameter sensitivity estimation in Monte Carlo structural relia-bility, Comput. Struct, 82, 55–61, 2004.
¨
Ozturk, B.: A simple procedure for the assessment of seismic drift response of building structures located in seismically active and near-fault regions, in: First European Conference on Earthquake Engineering and Seismology, Geneva, Switzerland, 3–8 Septem-ber, 2006.
PEER (Pacific Earthquake Engineering Research Centre), http:// peer.berkeley.edu/smcat/data, 2011.
Shinozuka, M.: Monte Carlo Simulation of structural dynamics, Comput. Struct., 865–874, 1972.
Somerville, P. G.: Magnitude scaling of the near-fault rupture di-rectivity pulse, Phys. Earth Planet. Inter. 137, 201–212, 2003. Wang, G.-Q., Zhou, X.-Y., Zhang, P.-Z., Igel, H.: Characteristics of