www.ann-geophys.net/33/913/2015/ doi:10.5194/angeo-33-913-2015
© Author(s) 2015. CC Attribution 3.0 License.
Observations of thermosphere and ionosphere changes due to the
dissipative 6.5-day wave in the lower thermosphere
Q. Gan1,2, J. Yue3, L. C. Chang4, W. B. Wang5, S. D. Zhang2, and J. Du1
1Department of Physics and Astronomy, University of Louisville, Louisville, Kentucky, USA 2School of Electronic Information, Wuhan University, Wuhan, Hubei, China
3Atmospheric and Planetary Sciences, Hampton University, Hampton, Virginia, USA 4Institute of Space Science, National Central University, Jhongli, Taoyuan County, Taiwan 5High Altitude Observatory, National Center for Atmospheric Research, Boulder, Colorado, USA
Correspondence to:Q. Gan ([email protected])
Received: 11 May 2015 – Revised: 29 June 2015 – Accepted: 7 July 2015 – Published: 24 July 2015
Abstract. In the current work, temperature and wind data from the Thermosphere Ionosphere Mesosphere Energetics and Dynamics (TIMED) satellite during the years 2002– 2007 were used to describe the seasonal variations of the westward propagating 6.5-day planetary wave in the meso-sphere and lower thermomeso-sphere (MLT). Thermospheric com-position data from the TIMED satellite and ionospheric total electron content (TEC) from the International Global Navi-gation Satellite System (GNSS) Service were then employed to carry out two case studies on the effect of this dissipating wave on the thermosphere/ionosphere. In both cases, there were westward anomalies of ∼30–40 m s−1 in zonal wind
in the MLT region that were caused by momentum depo-sition of the 6.5-day wave, which had peak activity during equinoxes. The westward zonal wind anomalies led to extra poleward meridional flows in both hemispheres. Meanwhile, there were evident overall reductions of thermospheric col-umn density O/N2ratio and ionospheric TEC with
magni-tudes of up to 16–24 % during these two strong 6.5-day wave events. Based on the temporal correlation between O/N2
and TEC reductions, as well as the extra poleward meridional circulations associated with the 6.5-day waves, we conclude that the dissipative 6.5-day wave in the lower thermosphere can cause changes in the thermosphere/ionosphere via the mixing effect, similar to the quasi-two-day wave (QTDW) as predicted by Yue and Wang (2014).
Keywords. Atmospheric composition and structure (thermosphere-composition and chemistry) – ionosphere (ionosphere–atmosphere interactions; wave propagation)
1 Introduction
A number of observation and simulation works in litera-ture have shown that planetary-scale waves, including atmo-spheric tides and various stationary and traveling planetary waves in the mesosphere and lower thermosphere (MLT), are able to impact the ionosphere/thermosphere (IT) system sub-stantially (Laštoviˇcka, 2006; Forbes et al., 2009; Pedatella et al., 2009; Chang et al., 2010; Liu et al., 2010; England, 2012; Yue et al., 2013a; Yamazaki and Richmond, 2013; Yue and Wang, 2014; Chang et al., 2014). The planetary-scale wave signals with the same period and zonal wavenumber as those in the lower atmosphere are often observed in the IT system, which are thought to be the result of either the direct vertical propagation of the planetary-scale waves into the upper ther-mosphere (Forbes et al., 2014) or via the wave modulation on the neutral wind and dynamo electric fields in the ionosphere E region (Laštoviˇcka and Sauli, 1999; Pancheva et al., 2002; England et al., 2006).
mechanism, which is commonly characterized as changes (e.g. O/N2 ratio, or total electron content (TEC) etc.) in
the IT system. For instance, Chang et al. (2011) found a significant depletion of zonal mean TEC on the order of 3 TECu (total electron content unit, 1 TECu=1016el m−2)
prior to the quasi-two-day wave (QTDW) reaching its max-imum in the MLT. Moreover, in a much earlier work, Chen et al. (1992) showed a reduction of the multiday mean crit-ical frequency of the F2 layer (foF2) (∼3 MHz) in the
crest region of the equatorial ionization anomaly (EIA) throughout the entire period of the quasi-two-day oscillation (QTDO) event driven by the QTDW in the lower atmosphere. More recently, Yue and Wang (2014), for the first time, ex-plicitly investigated the QTDW-induced changes in the IT system using the Thermosphere–Ionosphere–Mesosphere– Electrodynamics general circulation model (TIME-GCM) and proposed that mixing caused by QTDWs leads to the de-creases of both O/N2and TEC. This theoretical prediction
was later confirmed by Chang et al. (2014) with statistical evidence from multiglobal observation data sets.
An outstanding question is if other traveling planetary waves with large amplitudes in the MLT region are also able to drive similar changes in the IT system via the mix-ing effect. A westward propagatmix-ing 6.5-day wave with zonal wavenumber 1 is a recurrent feature in the MLT region. The 6.5-day wave exhibits substantial seasonal variations with maximum and minimum amplitudes around equinoxes and solstices, respectively. This seasonal dependence is deter-mined by the background baroclinic and barotropic insta-bility, the critical layer and waveguide formed by the zonal mean zonal wind (Miyoshi and Hirooka, 1999; Lieberman et al., 2003; Kishore et al., 2004; Liu et al., 2004).
The purpose of the current work is to diagnose the possible effects of the dissipative 6.5-day wave on the IT system via the mixing mechanism predicted by Yue and Wang (2014). The detailed data set specifications and analysis methodol-ogy are described in Sect. 2. The main results are presented in Sect. 3. Section 4 presents the summary and conclusions of this work.
2 Data and methodology
To investigate the potential changes in the iono-sphere/thermosphere caused by the 6.5-day wave via the mixing mechanism, we follow the methodology employed by Chang et al. (2014). The temperature and horizontal wind measurements from the Sounding of the Atmosphere using Broadband Emission Radiometry (SABER) and TIMED Doppler interferometer (TIDI) instruments onboard the Thermosphere Ionosphere Mesosphere Energetics and Dynamics (TIMED) satellite are analyzed to identify the strongest 6.5-day wave events in the MLT region. Mean-while, the responses in the IT system are examined through total electron content (TEC) from the International GNSS
Service (IGS) measurements and O/N2 ratio from the
Global Ultraviolet Imager (GUVI) measurements onboard the TIMED satellite. In the present work, the data sets are analyzed for the period from the year 2002 to 2007.
2.1 SABER temperature data
SABER is a 10-channel broadband radiometer covering a spectral range from 1.27 to 17 µm. It provides a tempera-ture profile retrieved from one 4.3 µm and two 15 µm CO2
radiometer channels in the tangent height range, spanning ap-proximately 20–110 km (Mertens et al., 2004). Remsberg et al. (2008) assessed the quality of version 1.07 temperature data and suggested that the systematic error is no more than 2 K below 70 km, while in the upper MLT region the error in-creases with altitude from 1.8 K at 80 km to 6.7 K at 100 km. The effective vertical resolution of SABER temperature is approximately 2 km. SABER is in a slowly processing po-lar quasi-sun-synchronous orbit and can only make measure-ments at two fixed local times per day for each selected lati-tude. The sampled local time shifts a small amount each day (12 min), allowing 24 h local time coverage after about 60 days of accumulated observations at low to middle latitudes when both ascending and descending samples are combined. Due to the line of sight of SABER and the yaw maneuver of the TIMED satellite, the latitude coverage of SABER data is from 53◦
latitude in one hemisphere to 83◦
in the other. In the past decade, SABER temperature has been widely employed for the study of typical thermal structure (Gan et al., 2012) and wave dynamics (Huang et al., 2013; Gan et al., 2014). In the current work, the latest version of temperature data, 2.0, is utilized to identify the 6.5-day wave in temperature.
2.2 TIDI wind data
TIDI aboard the TIMED satellite is a Fabry–Perot interfer-ometer measuring horizontal vector wind in the MLT re-gion with a vertical resolution of approximately 2 km and accuracies that approach 3 m s−1 (Killeen et al., 2006). By
limb-viewing, TIDI observes emissions from OI 557.7 nm and rotation lines in the O2 (0–0) at 762 nm to determine
2.3 GUVI O/N2data
GUVI is an FUV (far ultraviolet) spectroradiometer onboard the TIMED satellite. It measures the terrestrial dayglow from 120 to 180 nm divided into 176 spectral pixels (Christensen et al., 2003). The GUVI measurement mode consists of imag-ing the FUV dayglow from both the Earth’s limb and disk between December 2001 and December 2007. Since then, GUVI has only operated in the spectral stare mode at about 47◦
from nadir due to the failure of the scan mirror (Meier et al., 2015).
The atomic oxygen 135.6 nm and molecular nitrogen Lyman-Birge-Hopfield (LBH) emission bands in the far ul-traviolet are utilized to retrieve the altitudinal profiles of molecular nitrogen and oxygen, atomic oxygen and tem-perature from limb scans. The column O / N2 density
ra-tio is defined as the rara-tio of the vertical integrated atomic oxygen density to the molecular nitrogen density above the altitude with the molecular nitrogen column density of 1017cm−2. The version 13 O/N
2 ratio data set is
obtained from the website (http://guvi.jhuapl.edu/site/data/ guvi-dataproducts.shtml) and is analyzed to explore poten-tial changes induced by 6.5-day wave dissipation.
2.4 TEC data
Global maps of ionosphere TEC with 2 h resolution are pro-vided by the International GNSS Service (IGS) and down-loadable from the Space Physics Data Facility of the God-dard Space Flight Center (ftp://cdaweb.gsfc.nasa.gov/pub/ data). Real-time TEC mapping can provide accurate iono-sphere calibration to navigation systems and are also used to monitor the ionosphere. In the current work, each global TEC map has a horizontal resolution of 2.5◦
latitude and 5◦
longitude.
2.5 Methodology
SABER temperature and TIDI horizontal wind data sets are utilized to identify the strongest 6.5-day wave events in the MLT region between 2002 and 2007. The least-squares fit-ting method proposed by Wu et al. (1995) is employed to obtain the 2-D frequency–wavenumber spectrum of the per-turbations in temperature and wind in each latitude and alti-tude bin. The spectral analysis is undertaken in each calen-dar month with scanning steps of 0.01 cycles per day (cpd) in frequency. The corresponding wavenumber is from −8 (eastward) to 8 (westward). The least-squares fitting is also performed to derive the amplitude and phase of the 6.5-day wave. The fitting uses a 20-day window with 1-day sliding step to obtain its short-term variability.
TIDI winds (zonal and meridional components) at 100 km are analyzed for the anomalies associated with the 6.5-day wave dissipation. The daily mean wind anomalies are ob-tained by removing the 60-day mean zonal mean value from
the daily zonal mean value. The daily zonal mean value is calculated through averaging the wind profiles from both as-cending and desas-cending orbits for the selected day. As men-tioned in Chang et al. (2014), this averaging allows contri-butions from odd zonal wavenumber tidal components to be suppressed. Meanwhile, all the profiles, in a 60-day temporal window centered on the selected day, are averaged to unam-biguously derive the 60-day mean zonal mean value, which is capable of resolving seasonal-scale variations in the winds. The wind anomalies computed from the difference between the daily and 60-day mean winds thus serve as a proxy for short-term variations on day-to-day time scales in the zonal mean zonal winds in low latitudes.
In order to examine thermosphere and ionosphere re-sponses, the changes in TEC and O/N2data sets are
inves-tigated during two strong 6.5-day wave events. The percent-age changes are calculated by subtracting and normalizing to the mean value in the selected period for each latitude, as will be discussed in detail later. Additionally, we only use the global TEC data at 16:00 LT, when the EIA reaches the greatest magnitude.
3 Results
To identify strong 6.5-day wave signals in neutral tempera-ture and zonal winds, spectral analysis is carried out on both the temperature and wind fields, as mentioned above, prior to further analyses. The typical spectrum at selected latitudes and altitudes are displayed, where the 6.5-day wave signal reaches the maximum amplitude.
Figure 1 shows the normalized annual mean power spectra for the perturbations in temperature at (a) 80 and (b) 95 km at 45◦
N and in zonal winds at (c) 95 km over the Equator. The normalized annual mean power spectra here were calculated by averaging all the monthly mean spectra between the year 2002 and 2007. Generally, the prominent zonal wavenumber 1 westward propagating 6.5-day wave is detectable in both temperature and zonal wind fields. The consistent 6.5-day wave signals in the temperature perturbation spectra at 80 and 95 km indicate the vertical propagation of the wave in the MLT region. As seen in Fig. 1b and c, the strong 6.5-day wave at middle latitudes in temperature and at low lat-itude in zonal wind is in agreement with the previous satel-lite observational results (Wu et al., 1994; Lieberman et al., 2003). Additionally, the QTDW and equatorial trapped ultra-fast Kelvin wave are also visible in the spectra.
SABER temp. Latitude = 45N Height = 080 km
-5 -4 -3 -2 -1 0 1 2 3 4 5 Wavenumber 0.05
0.10 0.15 0.20 0.25 0.30 0.35 0.40 0.45 0.50 0.55 0.60
Frequency / Cycle per day
SABER temp. Latitude = 45N Height = 095 km
-5 -4 -3 -2 -1 0 1 2 3 4 5 Wavenumber 0.05
0.10 0.15 0.20 0.25 0.30 0.35 0.40 0.45 0.50 0.55 0.60
Frequency / Cycle per day
TIDI zonal wind Latitude = equator Height = 95.0 km
-5 -4 -3 -2 -1 0 1 2 3 4 5 Wavenumber 0.05
0.10 0.15 0.20 0.25 0.30 0.35 0.40 0.45 0.50 0.55 0.60
Frequency / Cycle per day
(a) (b) (c)
0.00 0.05 0.10 0.15 0.20 0.25 0.30 0.35 0.40 0.45 0.50 0.55 0.60 0.65 0.70 0.75 0.80 0.85 0.90 0.95 1.00
Figure 1.Normalized annual mean frequency–wavenumber power spectrum of SABER temperature at(a)80 and(b)95 km at 45◦N between
the year 2002 and 2007.(c)is the same as(b), but for TIDI zonal wind at 95 km over the Equator. Positive (negative) values denote westward
(eastward) propagation. The white dashed line denotes the frequency of 0.15 cpd (∼6.5 days). The contour interval is 0.05 cpd.
Amplitude in SABER temp. Height = 095 km
Jan Feb Mar Apr May Jun Jul Aug Sep Oct Nov Dec Jan
Month -50
-40 -30 -20 -10 0 10 20 30 40 50
Latitude /deg
K
0.0 0.6 1.2 1.8 2.4 3.0 3.6 4.2 4.8 5.4 6.0
Amplitude in TIDI zonal wind. Height = 95.0 km
Jan Feb Mar Apr May Jun Jul Aug Sep Oct Nov Dec Jan
Month -50
-40 -30 -20 -10 0 10 20 30 40 50
Latitude /deg
m/s
0 2 4 6 8 10 12 14 16 18 20 (a)
(b)
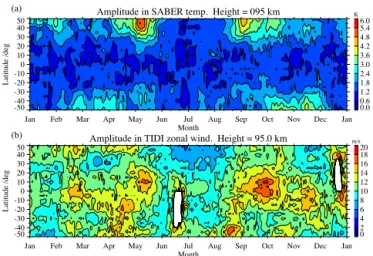
Figure 2. 6-year (2002–2007) averaged daily amplitude of the
westward propagating 6.5-day wave with zonal wavenumber 1 for
(a)SABER temperature and(b) TIDI zonal wind between 50◦S
and 50◦N at 95 km. Contour intervals are 0.6 K and 2 m s−1,
re-spectively.
a composite year. In Fig. 2a, the temperature 6.5-day wave reaches the maximum amplitude at middle latitudes around the equinoxes. The vernal and autumnal peak values appear in May and September in the Northern Hemisphere, respec-tively, with a greater value of∼6 K in the springtime. In the Southern Hemisphere, the 6.5-day wave displays the same seasonal behavior, but it maximizes in February/March and October/November. Moreover, the 6.5-day wave exhibits an asymmetric latitudinal structure with respect to the Equator at this height.
Figure 2b displays the 6-year averaged daily amplitude of the 6.5-day wave in zonal wind at 95 km (meridional wind component not shown here because of the similar seasonal feature and much weaker amplitude). The wave signals also
reach a maximum in equinoxes with a peak value up to
∼20 m s−1 in the tropical region, which agrees with
previ-ous observation and simulation results (Talaat et al., 2001, 2002; Liu et al., 2004). Besides the primary amplitude ima occurring in May and September, two secondary max-ima in February and November are also evident in the tropi-cal region, which are synchronous with the maxima in tem-perature in the Southern Hemisphere. This may be associ-ated with the mesosphere semi-annual oscillation (MSAO) of zonal mean zonal winds (Liu et al., 2004). Additionally, the 6.5-day wave in the extratropical regions in the Southern Hemisphere presents the greatest amplitude in April and Au-gust, about 1 month earlier than in the tropical region. We noted that the 6.5-day wave exhibited distinctly different lat-itudinal structures in temperature and zonal wind, especially during equinoxes when its amplitudes reach maximum. This is in agreement with previous global observation (Wu et al., 1994) and modeling (Liu et al., 2004) works, suggesting a consistent horizontal structure of the 6.5-day wave with the (1,1) Rossby normal mode predicted by linear theory.
According to the coupling mechanism proposed by Yue and Wang (2014), the background zonal wind anomaly pro-duced by the planetary wave dissipation in the lower thermo-sphere can result in an extra meridional circulation, which subsequently induces changes in thermospheric O/N2
ra-tio and ionospheric TEC. Therefore, in the following case studies, we will present the 6.5-day wave variations together with the corresponding anomalies in the background zonal and meridional winds of the lower thermosphere and changes in thermospheric O/N2and ionospheric TEC. The cases
year=2003 Center day= 130 6.5-day amplitude in temp. (K) at 95 km
100 105 110 115 120 125 130 135 140 145 150 155 160 Day of year
-50 -40 -30 -20 -10 0 10 20 30 40 50 Latitude /deg 0 1 2 3 4 5 6 7 8 9 10
year=2003 Center day= 130 6.5-day amplitude in zonal wind (m/s) at 95 km
100 105 110 115 120 125 130 135 140 145 150 155 160 Day of year
-50 -40 -30 -20 -10 0 10 20 30 40 50 Latitude /deg 0.0 3.2 6.4 9.6 12.8 16.0 19.2 22.4 25.6 28.8 32.0
year=2003 Center day= 130 Zonal wind anomaly (m/s) at 100 km
100 105 110 115 120 125 130 135 140 145 150 155 160 Day of year
-50 -40 -30 -20 -10 0 10 20 30 40 50 Latitude /deg -50 -50 -50 -40 -40 -30 -30 -30 -30 -30 -20 -20 -20 -20 -20 -20 -20 -20 -20 -20 -10 -10 -10 -10 -10 -10 -10 -10 -10-10 -10 -10 -10 -10 -10 -50 -40 -30 -20 -10 0 10 20 30 40 50
year=2003 Center day= 130 Meridional wind anomaly (m/s) at 100 km
100 105 110 115 120 125 130 135 140 145 150 155 160 Day of year
-50 -40 -30 -20 -10 0 10 20 30 40 50 Latitude /deg -50 -50 -40 -40 -40 -40 -40 -40 -30 -30 -30 -30 -30 -30 -30 -30 -30 -20 -20 -20 -20 -20 -20 -20 -20 -20 -20 -10 -10 -10 -10 -10 -10 -10 -10 -10 -10 -10 -10 -10 -10 -50 -40 -30 -20 -10 0 10 20 30 40 50
year=2003 Center day= 130 O/N2 anomaly (%)
100 105 110 115 120 125 130 135 140 145 150 155 160 Day of year
-50 -40 -30 -20 -10 0 10 20 30 40 50 Latitude /deg -40 -40 -32 -32 -24 -24 -16 -16
-8 -8 -8
-8 -8 -8 -8 -40 -32 -24 -16 -8 0 8 16 24 32 40
year=2003 Center day= 130 TEC anomaly (%)
100 105 110 115 120 125 130 135 140 145 150 155 160 Day of year
-50 -40 -30 -20 -10 0 10 20 30 40 50 Latitude /deg -8 -8 -8 -8 -8 -8 -8 -8 -8 -8 -8 0 2 4 6 8 10 12 14 16 18 20 Kp 60 90 120 150 180 210 240 270 300 330 360 390 420
F10.7 cm (sfu)
-40 -32 -24 -16 -8 0 8 16 24 32 40
(a)
(b)
(c)
(d)
(e)
(f)
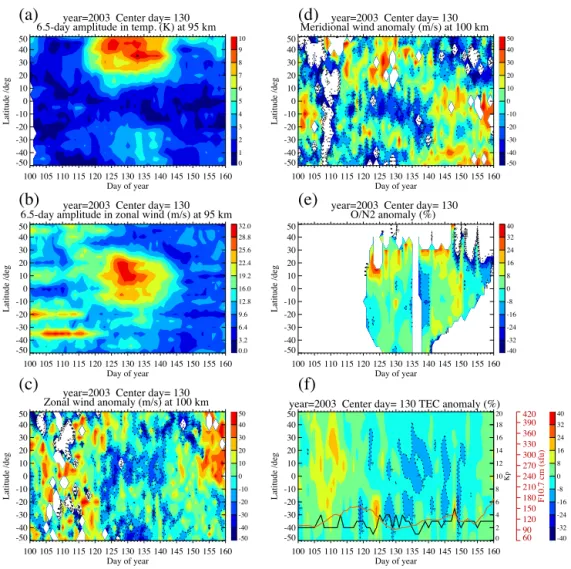
Figure 3.Daily variation of the 6.5-day wave amplitude in(a)SABER temperature and(b)TIDI zonal wind at 95 km.(c)is the daily zonal
wind anomaly at 100 km. Positive (negative) denotes eastward (westward).(d) is the same as(c), but for the meridional wind anomaly.
Positive (negative) denotes northward (southward).(e)and(f)are percentage changes of the daily O/N2and TEC anomalies, respectively.
All the plots are between day 100 and 160 in 2003 ranging from 50◦S to 50◦N. The contour intervals for(a)to(f)are 1 K, 3.2 m s−1,
10 m s−1, 10 m s−1, 8 % and 8 %, respectively. The red and black lines in panel(f)denoteF10.7 cm andK
pindices, respectively. The white
region denotes no available data.
two representative cases in detail, since others do not have successive O/N2 observations or sufficiently strong wave
activity, making the evidence not as robust as desired. Figure 3 illustrates the first case study during the spring equinox in 2003. Figure 3a shows the daily amplitude of the 6.5-day wave in temperature at 95 km between day 100 and 160 with a latitude ranging from 50◦
S to 50◦
N. The max-imum amplitude of ∼10 K occurred around day 130 and
40◦
N, which was 2 times larger than that in the Southern Hemisphere. Unlike that in temperature, the stronger wave signals in zonal wind appeared at low latitude as seen in Fig. 3b. A peak value of up to ∼30 m s−1occurred around
day 130 which coincided with the value in temperature. Also, the duration of the strong 6.5-day wave was on the order of
∼20 days from day 120 to 140.
We next explore the horizontal wind anomalies driven by the westward propagating 6.5-day wave. Figure 3c illustrates the TIDI zonal mean zonal wind anomalies at 100 km, which is obtained by removing the 60-day mean zonal mean value from the daily zonal mean value. Thus, the anomalies result-ing from the difference between the daily and 60-day mean values can reflect the short-term wind variability, including the changes potentially induced by the 6.5-day wave dissipa-tion. The positive (negative) values represent eastward (west-ward) zonal wind anomalies. As seen in Fig. 3c, the apparent westward anomalies (dotted line) at low latitudes, particu-larly in the region of 10◦S–20◦N, coincided with the
promi-nent 6.5-day wave activities between day 120 and 140. The westward anomalies were as large as∼30–40 m s−1around
day 130 in the equatorial region. We also note that appar-ent westward wind anomalies appeared poleward of 30◦
is expected that the significant westward anomalies dwelled within 20◦S/N, where the 6.5-day wave was strongest in the
zonal wind field. Based on its temporal–spatial feature, the westward wind anomalies are likely the consequence of the westward momentum deposition due to the 6.5-day wave dis-sipation. In a TIME-GCM modeling study of the effect of the QTDW on the upper atmosphere, Yue and Wang (2014) also reported a westward jet of∼20 m s−1between 80 and
100 km at low latitudes induced by QTDW forcing. More-over, the observational results from Chang et al. (2014) demonstrated that the QTDW-induced westward anomalies had a 12–20-day delay with respect to the day of peak QTDW amplitude at 100 km. This delay was attributed to the time required for the vertical propagation of the QTDW forcing from the peak altitude of∼85 to 100 km. Another possible reason is associated with the forcing by gravity waves fil-tered by the initial eastward background zonal wind at lower height level. In general, the 6.5-day wave is acting to drive significant westward zonal wind anomalies in the lower ther-mosphere and thereby provides the necessary conditions to modify the meridional circulation, which plays a key role in the composition mixing effect in the IT system.
To confirm the existence of this 6.5-day-wave-induced ex-tra meridional circulation, we further investigate the anoma-lies in the TIDI meridional wind, which is subjected to the same analysis as the zonal wind. In Fig. 3d, the strong south-ward (negative value) wind anomalies of ∼30–40 m s−1
within 10◦
S/N from day 120 to 130 coincided with the strongest 6.5-day wave activities. Then, the center of south-ward wind anomalies moved southsouth-ward and finally located at 20–30◦S between days 135–140. Meanwhile, the
merid-ional wind was dominated by the northward (positive value) wind anomalies in the Northern Hemisphere. These signif-icant extra poleward flows in both hemispheres are deter-mined by the balance between the westward force due to the 6.5-day wave (Fig. 3c) and the Coriolis force (Yue and Wang, 2014). Although no data are available for examining the ver-tical wind changes directly, it is known that verver-tical wind is dependent upon the divergence of the zonal mean merid-ional wind (Rishbeth, 1998), which is capable of driving up-welling and downup-welling and composition changes. There-fore, we can reasonably speculate that global variations in meridional circulation are produced by the 6.5-day wave dis-sipation, similar to the scenario under the QTDW forcing in Yue and Wang (2014).
With the extra meridional circulation established, changes caused by the mixing effect are expected to occur in the ther-mosphere and ionosphere. The GUVI O/N2ratio is used to
explore the potential changes in the thermospheric composi-tion associated with the 6.5-day wave dissipacomposi-tion. Figure 3e illustrates the percentage changes of the daily O/N2, which
are derived by subtracting and normalizing to the zonal mean value between days 100 and 160. The apparent reductions of O/N2were observed, particularly between day 135 and
140, at low latitudes from 30◦
S to 20◦
N. The maximum
de-crease was as large as 16–24 % and occurred around day 136 in the tropical region, indicating a 5–6-day delay to the day of maximum wave amplitude in winds (cf. Fig. 3b). How-ever, a good agreement between the largest O/N2depletion
and the southward meridional wind anomalies (Fig. 3e) be-tween day 135 and 140 in the Southern Hemisphere can be seen clearly, indicating a strong correlation between the ex-tra meridional circulation and the O/N2 decrease induced
by the mixing effect. The wave-related reductions of neu-tral compositions in the thermosphere have been reported by past simulation works on migrating tides and QTDW forc-ing (Forbes et al., 1993; Yamazaki and Richmond, 2013; Yue and Wang, 2014). Yue and Wang (2014) found that QTDW-induced extra meridional circulation can effectively trans-port atomic oxygen downward from above 100 km to below 100 km. Due to molecular diffusion, the decrease of atomic oxygen mixing ratio at the lower thermosphere propagates to the upper thermosphere (Qian et al., 2009). Meanwhile, the net transportation of molecular nitrogen and oxygen is nevertheless upward, resulting in the increase of the mixing ratios of these molecular species. Therefore, the resultant de-crease of O/N2 is found to be significant in both
simula-tions and observasimula-tions (Chang et al., 2014). Additionally, a couple of previous works (Kil and Paxton, 2011; Kil et al., 2013) found that the O/N2ratio might be contaminated by
ionospheric O+
, which also produces 135.6 nm emissions as atomic oxygen. In this case, the changes of ionosphere O+
may also induce the observed O/N2depletion. However, it
is emphasized that the current O/N2ratio is retrieved from
OI 135.6 nm intensities with the solar zenith angle less than 60 degrees, suppressing the ionosphere effects as much as possible (Meier et al., 2015). Thus, we suggest that the dissi-pative 6.5-day wave is the dominant source, leading to O/N2
depletion through extra meridional circulation.
Figure 3f displays the percentage changes of daily TEC at 16:00 local solar time as a function of latitude within the same period. The original TEC time series (not shown) is characterized by evident semi-annual and solar-related 27-day oscillations, particularly at low and middle latitudes. To separate the influences of these periodic variations from the wave-driven effects, seasonal-scale variations with periods of 12 and 6 months were removed through harmonic fitting. Then, a band-pass ([0.045, 0.33] cpd) filter was employed to remove the∼27-day oscillation in TEC. The residual time
series of TEC were analyzed to derive the changes with the same approach as that for O/N2. Moreover, bothF10.7 cm
(red line) andKp(black line) indices were superimposed in
Fig. 3f to represent solar and geomagnetic activity, respec-tively, which can also lead to short-term variability in TEC. The evident decrease was observed between days 125 and 140 within 50◦
S/N, during the period of the strongest 6.5-day wave activity. The maximum TEC reduction of 8–16 % occurred around 20◦
in both hemispheres, roughly symmet-ric to the Equator. During this period, the Kp index was
year=2006 Center day= 315 6.5-day amplitude in temp. (K) at 95 km
285 290 295 300 305 310 315 320 325 330 335 340 345 Day of year
-50 -40 -30 -20 -10 0 10 20 30 40 50 Latitude /deg 0 1 2 3 4 5 6 7 8 9 10
year=2006 Center day= 315 6.5-day amplitude in zonal wind (m/s) at 95 km
285 290 295 300 305 310 315 320 325 330 335 340 345 Day of year
-50 -40 -30 -20 -10 0 10 20 30 40 50 Latitude /deg 0.0 3.2 6.4 9.6 12.8 16.0 19.2 22.4 25.6 28.8 32.0
year=2006 Center day= 315 Zonal wind anomaly (m/s) at 100 km
285 290 295 300 305 310 315 320 325 330 335 340 345 Day of year
-50 -40 -30 -20 -10 0 10 20 30 40 50 Latitude /deg -40 -40 -30 -30 -30 -30 -30 -20 -20 -20 -20 -20 -20 -20 -20 -20 -20 -20 -20 -20 -10 -10 -10 -10 -10 -10 -10 -10 -10 -10 -10 -10 -10 -10 -50 -40 -30 -20 -10 0 10 20 30 40 50
year=2006 Center day= 315 Meridional wind anomaly (m/s) at 100 km
285 290 295 300 305 310 315 320 325 330 335 340 345 Day of year
-50 -40 -30 -20 -10 0 10 20 30 40 50 Latitude /deg -50 -40 -40 -30 -30 -30 -30 -30 -30 -30 -30-30 -20 -20 -20 -20 -20 -20 -20 -20 -20 -20 -20 -20 -10 -10 -10 -10 -10 -10 -10 -10 -10 -10 -10 -10 -50 -40 -30 -20 -10 0 10 20 30 40 50
year=2006 Center day= 315 O/N2 anomaly (%)
285 290 295 300 305 310 315 320 325 330 335 340 345 Day of year
-50 -40 -30 -20 -10 0 10 20 30 40 50 Latitude /deg -40-32 -24 -16 -16 -16 -8 -8 -8 -8 -8 -8 -8 -8 -40 -32 -24 -16 -8 0 8 16 24 32 40
year=2006 Center day= 315 TEC anomaly (%)
285 290 295 300 305 310 315 320 325 330 335 340 345 Day of year
-50 -40 -30 -20 -10 0 10 20 30 40 50 Latitude /deg -24
-16 -16 -16
-16 -16
-16 -16
-8
-8 -8 -8
-8
-8 -8 -8
-8 -8 -8 -8 0 2 4 6 8 10 12 14 16 18 20 Kp 60 90 120 150 180 210 240 270 300 330 360 390 420
F10.7 cm (sfu)
-40 -32 -24 -16 -8 0 8 16 24 32 40
(a)
(b)
(c)
(d)
(e)
(f)
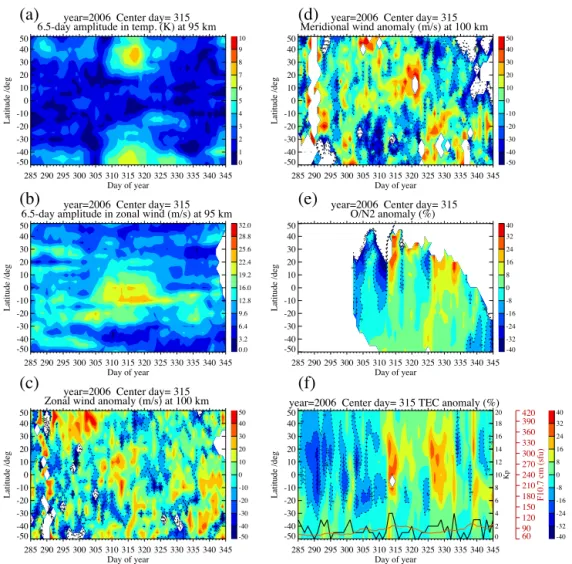
Figure 4.Same as Fig. 3, but for the duration of day 285 to 345 in 2006.
We note that theF10.7 cm index dramatically declined from 150 sfu (solar flux unit) (10−22Wm−2Hz−1)on day 118 to
90 sfu on day 130, making the solar-induced short-term ef-fect on TEC non-negligible. Nonetheless, F-region plasma density is greatly affected by the composition of the neutral atmosphere (Rishbeth and Edwards, 1989, 1990). Electron density is approximately proportional to O/N2ratio under a
photochemical equilibrium (Rishbeth, 1998). Thus, because of the good temporal consistence between the reductions of TEC and O/N2, the extra poleward meridional circulation
and the 6.5-day wave activity, the extra meridional circula-tion driven by the 6.5-day wave dissipacircula-tion is most likely the cause of the TEC depletion in Fig. 3f.
Thus far, the 6.5-day-wave-induced mixing effect on the IT system has been demonstrated during vernal equinox. We now investigate another case in autumn, when the westward propagating 6.5-day wave again reaches peak amplitude. Fig-ure 4 displays the same variables as those in Fig. 3, but between days 285 and 345 in 2006. The wave amplitudes in temperature (Fig. 4a) and zonal wind (Fig. 4b) reached
maximums around day 315 with peak values of∼8 K and
∼25 m s−1, respectively. They were smaller than the
maxi-mum amplitudes during the springtime in 2003. Moreover, besides the relatively weak wave signal in the Southern Hemisphere, the 6.5-day wave in the autumn of 2006 did not exhibit the distinctive hemispherically asymmetric feature in temperature shown in Fig. 3a. The strongest wave signal per-sisted for about 10 days from day 310 to 320, when the cor-responding zonal wind was dominated by eastward (positive) anomalies with a magnitude of up to 30–40 m s−1at low
a magnitude of up to 40–50 m s−1, indicating the important
poleward meridional circulations in both hemispheres. From Fig. 4e and f, we can find multiple time segments with short-term decreases in O/N2and TEC. However,
con-sidering the potential impact of the 6.5-day wave, only such reductions accompanying or closely following the strongest wave activity are thought to be associated with the mixing effect. Thus, the evident reductions, occurring during days 320–325, centered around 20◦
N in O/N2and 10◦S in TEC,
with a magnitude of 16–24 %, might have a correlation with the 6.5-day wave dissipation. In addition, both solar activity and geomagnetic activity were relatively weak in terms of
F10.7 cm andKpindices, indicating no significant contribu-tions from these sources. According to the preceding analy-ses, we conclude that the 6.5-day wave effect on the IT sys-tem via the mixing mechanism not only exists in the vernal equinox but also in the autumnal equinox, as long as strong 6.5-day wave activity occurs in the MLT region.
4 Summary and conclusions
In this work, we used SABER temperature, TIDI horizontal winds, GUVI O/N2and IGS TEC data sets to investigate the
potential effect of the dissipative 6.5-day wave in the MLT region on the IT system via the mixing effect. We identified strong zonal wavenumber 1 westward propagating 6.5-day wave signals in temperature and zonal winds. By averaging the daily amplitudes over 6 years (2002–2007), it is found that the 6.5-day wave at 95 km exhibits a substantial seasonal dependence with the maximum amplitude during equinoxes. Two strong 6.5-day wave cases, one during day 100–160 in 2003 and the other during day 285–345 in 2006, were in-vestigated to explore, in this work, the effects of wave dissi-pation on the thermosphere/ionosphere. The main results are summarized as follows:
1. In both cases, the maximum amplitudes of 6.5-day wave occur simultaneously in temperature and zonal wind fields. The amplitudes of the 2003 springtime case had slightly larger peak values (∼10 K and 30 m s−1).
2. Evident westward zonal wind anomalies were observed at low latitudes during the period of strong 6.5-day wave activities in the 2003 vernal equinox case. Westward wind anomalies result from the momentum deposition due to the 6.5-day wave dissipation. However, for the autumnal case in 2006, the corresponding zonal wind anomalies were initially eastward during the onset of the 6.5-day wave and turn to westward later. This may be associated with the effects of gravity waves filtered by the background wind at lower altitudes, as suggested by Chang et al. (2014).
3. Because of the balance between the westward accel-eration and Coriolis force, the westward zonal wind
anomalies result in poleward meridional wind anoma-lies in both hemispheres. This leads to extra meridional circulation and thus the mixing effect in the thermo-sphere/ionosphere.
4. Coincident reductions with a magnitude of up to 16– 24 % in O/N2 and TEC were observed. Moreover,
these reductions showed good temporal correlations with the strong 6.5-day wave activity, as well as the in-duced zonal and meridional wind anomalies. This pro-vides the evidence that the dissipative 6.5-day wave can lead to changes in the IT system via the composi-tion mixing mechanism, as predicted by Yue and Wang (2014).
Acknowledgements. Quan Gan is jointly funded by the College
of Arts and Sciences of the University of Louisville, the National Basic Research Program of China (grant no. 2012CB825605) and the National Natural Science Foundation of China (grant no. 41304120). Jia Yue is supported by NASA NNX14AF20G. Support for L. C. Chang is provided by grant MOST 103-2111-M-008-019-MY3 from the Taiwan Ministry of Science and Technology. Shaodong Zhang is funded by the National Basic Research Program of China (grant no. 2012CB825605). Jian Du is funded by the NSF CEDAR grant (no. AGS-1243019). The National Center for Atmospheric Research is sponsored by the NSF. We thank R. R. Meier for help with GUVI data analysis.
Edited by: A. J. Kavanagh
Reviewed by: J. Laštoviˇcka and one anonymous referee
References
Chang, L. C., Palo, S. E., Liu, H. L., Fang, T. W., and Lin, C. S.: Response of the thermosphere and ionosphere to an ultra fast Kelvin wave, J. Geophys. Res., 115, A00G40, doi:10.1029/2010ja015453, 2010.
Chang, L. C., Liu, J. Y., and Palo, S. E.: Propagating planetary wave coupling in SABER MLT temperatures and GPS TEC during the 2005/2006 austral summer, J. Geophys. Res., 116, A10324, doi:10.1029/2011ja016687, 2011.
Chang, L. C., Yue, J., Wang, W. B., Wu, Q., and Meier, R. R.: Quasi two day wave-related variability in the background dynamics and composition of themesosphere/thermosphere and the ionosphere, J. Geophys. Res., 119, 4786–4804, doi:10.1002/2014ja019936, 2014.
Chen, P. R.: 2-Day Oscillation Of the Equatorial
Ion-ization Anomaly, J. Geophys. Res., 97, 6343–6357,
doi:10.1029/91ja02445, 1992.
England, S. L.: A Review of the Effects of Non-migrating Atmo-spheric Tides on the Earth’s Low-Latitude Ionosphere, Space Sci. Rev., 168, 211–236, doi:10.1007/s11214-011-9842-4, 2012. England, S. L., Immel, T. J., Sagawa, E., Henderson, S. B.,
Ha-gan, M. E., Mende, S. B., Frey, H. U., Swenson, C. M., and Pax-ton, L. J.: Effect of atmospheric tides on the morphology of the quiet time, postsunset equatorial ionospheric anomaly, J. Geo-phys. Res., 111, A10S19, doi:10.1029/2006ja011795, 2006. Forbes, J. M., Roble, R. G., and Fesen, C. G.: Acceleration,
Heat-ing, and Compositional Mixing of the Thermosphere Due to Upward Propagating Tides, J. Geophys. Res., 98, 311–321, doi:10.1029/92ja00442, 1993.
Forbes, J. M., Bruinsma, S. L., Zhang, X. L., and Oberheide, J.: Surface-exosphere coupling due to thermal tides, Geophys. Res. Lett., 36, L15812, doi:10.1029/2009gl038748, 2009.
Forbes, J. M., Zhang, X. L., and Bruinsma, S. L.: New perspec-tives on thermosphere tides: 2. Penetration to the upper thermo-sphere, Earth Planets Space, 66, 122, doi:10.1186/1880-5981-66-122, 2014.
Gan, Q., Zhang, S. D., and Yi, F.: TIMED/SABER observations of lower mesospheric inversion layers at low and middle latitudes, J. Geophys. Res., 117, D07109, doi:10.1029/2012JD017455, 2012. Gan, Q., Du, J., Ward, W. E., Beagley, S. R., Fomichev, V. I., and Zhang, S. D.: Climatology of the diurnal tides from eCMAM30 (1979 to 2010) and its comparison with SABER, Earth Planets Space, 66, doi:10.1186/1880-5981-66-103, 2014.
Huang, Y. Y., Zhang, S. D., Yi, F., Huang, C. M., Huang, K. M., Gan, Q., and Gong, Y.: Global climatological variability of quasi-two-day waves revealed by TIMED/SABER observa-tions, Ann. Geophys., 31, 1061–1075, doi:10.5194/angeo-31-1061-2013, 2013.
Jones, M., Forbes, J. M., and Hagan, M. E.: Tidal-induced net transport effects on the oxygen distribution in the thermosphere, Geophys. Res. Lett., 41, 5272–5279, doi:10.1002/2014gl060698, 2014.
Kil, H. and Paxton, L. J.: The origin of the nonmigrating tidal structure in the column number density ratio of atomic oxy-gen to molecular nitrooxy-gen, Geophys. Res. Lett., 38, L19108, doi:10.1029/2011gl049432, 2011.
Kil, H., Lee, W. K., Shim, J., Paxton, L. J., and Zhang, Y.: The effect of the 135.6 nm emission originated from the ionosphere on the TIMED/GUVI O/N-2 ratio, J. Geophys. Res.-Space, 118, 859–865, doi:10.1029/2012ja018112, 2013.
Killeen, T. L., Wu, Q., Solomon, S. C., Ortland, D. A., Skinner, W. R., Niciejewski, R. J., and Gell, D. A.: TIMED Doppler inter-ferometer: Overview and recent results, J. Geophys. Res., 111, A10S01, doi:10.1029/2005ja011484, 2006.
Kishore, P., Namboothiri, S. P., Igarashi, K., Gurubaran, S., Srid-haran, S., Rajaram, R., and Ratnam, M. V.: MF radar ob-servations of 6.5-day wave in the equatorial mesosphere and lower thermosphere, J. Atmos. Sol.-Terr. Phy., 66, 507–515, doi:10.1016/j.jastp.2004.01.026, 2004.
Laštoviˇcka, J.: Forcing of the ionosphere by waves
from below, J. Atmos. Sol.-Terr. Phy., 68, 479–497,
doi:10.1016/j.jastp.2005.01.018, 2006.
Laštoviˇcka, J. and Sauli, P.: Are planetary wave type oscilla-tions in the F2 region caused by planetary wave modulation of upward propagating tides?, Adv. Space Res., 24, 1473–1476, doi:10.1016/S0273-1177(99)00708-5, 1999.
Lieberman, R. S., Riggin, D. M., Franke, S. J., Manson, A. H., Meek, C., Nakamura, T., Tsuda, T., Vincent, R. A., and Reid, I.: The 6.5-day wave in the mesosphere and lower thermosphere: Evidence for baroclinic/barotropic instability, J. Geophys. Res.-Atmos., 108, 4640, doi:10.1029/2002jd003349, 2003.
Liu, H. L., Talaat, E. R., Roble, R. G., Lieberman, R. S., Riggin, D. M., and Yee, J. H.: The 6.5-day wave and its seasonal variability in the middle and upper atmosphere, J. Geophys. Res.-Atmos., 109, D21112, doi:10.1029/2004jd004795, 2004.
Liu, H. L., Wang, W., Richmond, A. D., and Roble, R. G.: Ionospheric variability due to planetary waves and tides for solar minimum conditions, J. Geophys. Res., 115, A00G01, doi:10.1029/2009ja015188, 2010.
Meier, R. R., Picone, J. M., Drob, D., Bishop, J., Emmert, J. T., Lean,J. L., Stephan, A. W., Strickland, D. J., Christensen, A. B., Paxton, L. J., Morrison, D., Kil, H., Wolven, B., Woods, T. N., Crowley, G., and Gibson, S. T.: Remote Sensing of Earth’s Limb by TIMED/GUVI: Retrieval of thermospheric composition and temperature, Earth and Space Science, 2, 1–37, doi:10.1002/2014EA000035, 2015.
Mertens, C. J., Schmidlin, F. J., Goldberg, R. A., Remsberg, E. E., Pesnell, W. D., Russell, J. M., Mlynczak, M. G., López-Puertas, M., Wintersteiner, P. P., Picard, R. H., Winick, J. R., and Gord-ley, L. L.: SABER observations of mesospheric temperatures and comparisons with falling sphere measurements taken during the 2002 summer MaCWAVE campaign, Geophys. Res. Lett., 31, L03105, doi:10.1029/2003gl018605, 2004.
Miyoshi, Y. and Hirooka, T.: A numerical experiment of excitation of the 5-day wave by a GCM, J. Atmos. Sci., 56, 1698–1707, doi:10.1175/1520-0469(1999)056<1698:Aneoeo>2.0.Co;2, 1999.
Pancheva, D., Mitchell, N., Clark, R. R., Drobjeva, J., and Las-tovicka, J.: Variability in the maximum height of the ionospheric F2-layer over Millstone Hill (September 1998–March 2000); in-fluence from below and above, Ann. Geophys., 20, 1807-1819, doi:10.5194/angeo-20-1807-2002, 2002.
Pedatella, N. M. and Forbes, J. M.: Modulation of the equatorial F-region by the quasi-16-day planetary wave, Geophys. Res. Lett., 36, L09105, doi:10.1029/2009gl037809, 2009.
Qian, L. Y., Solomon, S. C., and Kane, T. J.: Seasonal variation of thermospheric density and composition, J. Geophys. Res., 114, A01312, doi:10.1029/2008ja013643, 2009.
Remsberg, E. E., Marshall, B. T., Garcia-Comas, M., Krueger, D. Lingenfelser, G. S., Martin-Torres, J., Mlynczak, M. G., Russell, J. M., Smith, A. K., Zhao, Y., Brown, C., Gordley, L. L., Lopez-Gonzalez, M. J., Lopez-Puertas, M., She, C.-Y., Taylor, M. J., and Thompson, R. E.: Assessment of the quality of the Version 1.07 temperature-versus-pressure profiles of the middle atmosphere from TIMED/SABER, J. Geophys. Res.-Atmos., 113, D17101, doi:10.1029/2008jd010013, 2008.
Rishbeth, H.: How the thermospheric circulation affects the iono-spheric F2-layer, J. Atmos. Sol.-Terr. Phy., 60, 1385–1402, doi:10.1016/S1364-6826(98)00062-5, 1998.
Rishbeth, H. and Edwards, R.: The Isobaric F2-Layer, J. Atmos. Terr. Phys., 51, 321–338, doi:10.1016/0021-9169(89)90083-4, 1989.
Talaat, E. R., Yee, J. H., and Zhu, X.: Observations of the 6.5-day wave in the mesosphere and lower thermosphere, J. Geophys. Res.-Atmos., 106, 20715–20723, doi:10.1029/2001jd900227, 2001.
Talaat, E. R., Yee, J. H., and Zhu, X.: The 6.5-day wave in the trop-ical stratosphere and mesosphere, J. Geophys. Res.-Atmos., 107, doi:10.1029/2001jd000822, 2002.
Wu, D. L., Hays, P. B., and Skinner, W. R.: Observations Of the 5-Day Wave In the Mesosphere And Lower Thermosphere, Geo-phys. Res. Lett., 21, 2733–2736, doi:10.1029/94gl02660, 1994. Wu, D. L., Hays, P. B., and Skinner, W. R.: A
Least-Squares Method for Spectral-Analysis Of Space-Time Se-ries, J. Atmos. Sci., 52, 3501–3511, doi:10.1175/1520-0469(1995)052<3501:Alsmfs>2.0.Co;2, 1995.
Yamazaki, Y. and Richmond, A. D.: A theory of ionospheric response to upward-propagating tides: Electrodynamic effects and tidal mixing effects, J. Geophys. Res., 118, 5891–5905, doi:10.1002/Jgra.50487, 2013.
Yue, J. and Wang, W. B.: Changes of thermospheric composition and ionospheric density caused by quasi 2 day wave dissipation, J. Geophys. Res., 119, 2069–2078, doi:10.1002/2013ja019725, 2014.
Yue, J., Wang, W. B., Richmond, A. D., Liu, H. L., and Chang, L. C.: Wavenumber broadening of the quasi 2 day planetary wave in the ionosphere, J. Geophys. Res., 118, 3515–3526, doi:10.1002/Jgra.50307, 2013a.