www.hydrol-earth-syst-sci.net/16/2859/2012/ doi:10.5194/hess-16-2859-2012
© Author(s) 2012. CC Attribution 3.0 License.
Earth System
Sciences
Assessment of spatial and temporal patterns of green and blue water
flows under natural conditions in inland river basins in
Northwest China
C. F. Zang1, J. Liu1,2, M. van der Velde2, and F. Kraxner2
1School of Nature Conservation, Beijing Forestry University, Beijing, 100083, China, Qinghua East Road 35,
Haidian District, Beijing, China
2Ecosystems Services and Management, International Institute for Applied Systems Analysis, Schlossplatz 1, 2361,
Laxenburg, Austria
Correspondence to:J. Liu ([email protected])
Received: 29 February 2012 – Published in Hydrol. Earth Syst. Sci. Discuss.: 14 March 2012 Revised: 18 July 2012 – Accepted: 24 July 2012 – Published: 21 August 2012
Abstract.In arid and semi-arid regions freshwater resources have become scarcer with increasing demands from socio-economic development and population growth. Until re-cently, water research and management has mainly focused on blue water but ignored green water. Furthermore, in data poor regions hydrological flows under natural conditions are poorly characterised but are a prerequisite to inform future water resources management. Here we report on spatial and temporal patterns of both blue and green water flows that can be expected under natural conditions as simulated by the Soil and Water Assessment Tool (SWAT) for the Heihe river basin, the second largest inland river basin in North-west China. Calibration and validation at two hydrological stations show good performance of the SWAT model in mod-elling hydrological processes. The total green and blue wa-ter flows were 22.05–25.51 billion m3in the 2000s for the Heihe river basin. Blue water flows are larger in upstream sub-basins than in downstream sub-basins mainly due to high precipitation and a large amount of snow and melting water in upstream. Green water flows are distributed more homogeneously among different sub-basins. The green wa-ter coefficient was 87 %–89 % in the 2000s for the entire river basin, varying from around 80 %–90 % in up- and mid-stream sub-basins to above 90 % in downmid-stream sub-basins. This is much higher than reported green water coefficients in many other river basins. The spatial patterns of green wa-ter coefficients were closely linked to dominant land cov-ers (e.g. snow cover upstream and desert downstream) and
climate conditions (e.g. high precipitation upstream and low precipitation downstream). There are no clear consistent his-torical trends of change in green and blue water flows and the green water coefficient at both the river basin and sub-basin levels. This study provides insights into green and blue wa-ter endowments under natural conditions for the entire Heihe river basin at the sub-basin level. The results are helpful to benchmark the natural flows of water in the basin as part of improved water resources management in the inland river basins of China.
1 Introduction
understanding of the renewable water endowments as well as to enhancing water management towards sustainable, effi-cient and equitable use of limited water resources.
Traditionally, water resources assessment and manage-ment have put emphasis on blue water, ignoring green wa-ter (Falkenmark, 1995a; Cheng and Zhao, 2006). Conceptu-ally, water can be divided into green water and blue water (Falkenmark, 1995a). Blue water is the water in rivers, lakes, wetland and shallow aquifers, while green water is precip-itation water stored in unsaturated soil, and later used for evapotranspiration. Although green water is often ignored, it plays an essential role in crop production and other ecosys-tem services. J. Liu et al. (2009) estimated that green wa-ter accounts for more than 80 % of consumptive wawa-ter use for global crop production. Rost et al. (2008) estimated that green water consumption in global cropland to be from 85 % in 1971 to 92 % in 2000 of total crop water consumption. Green water dominates water uses in tropical arid regions, where rainfed agriculture accounts for more than 95 % of to-tal cropland area (Rockstrt¨om, 1999). Water use in grassland and forest ecosystems is dominantly “green”.
Since the concept of green and blue water was introduced (Falkenmark, 1995a, b), green/blue water research has be-come more and more diversified, especially after Falkenmark and Rockstr¨om (2006) conceptualized a wider green-blue flows approach for water-resource planning and manage-ment. Many novel research methods have appeared as well. For instance, Rost et al. (2008) and Gerten et al. (2005) use the LPJmL model to assess global green water consumption over a time period of nearly 30 yr, while J. Liu et al. (2009) used the GEPIC model to calculate the global green/blue water consumption of cropland. Schuol et al. (2008) and Faramarzi et al. (2009) used the SWAT model to simulate green/blue water resources of Africa and Iran, respectively. The green/blue water concept has offered a new methodol-ogy and fresh ideas for water resources management in many regions, in particular in arid and semi-arid regions where wa-ter scarcity is serious due to wawa-ter-thirsty socioeconomic de-velopment and population growth. Novel measures and con-cepts can aid in underpinning more sustainable and equitable water resources management (Jansson et al., 1999).
Importantly, and especially for data poor regions, hydro-logical flows under conditions unaffected by human activi-ties are often poorly characterized. Many studies tend to pay attention to the influence of human activities, but generally fail to characterize the state of the ecosystem under natural conditions. Modelling tools can aid in representing natural conditions and can be used as reference for follow-up studies and inform researchers and policy makers about the original state of a river basin as an input into decision-making.
The Heihe river is the second largest inland river in China; located in Northwest China, it originates in the Qilian Moun-tains and discharges into the Juyanhai Lake. The Heihe river basin is a typical arid and semi-arid region, suffering from a serious water crisis (Cheng et al., 2006). Water use in
mid-stream regions has increased sharply in the Heihe river basin related to socio-economic development (Ma et al., 2011). As a consequence, the Heihe river basin has been confronted with serious ecosystem degradation including the complete dry-up of the downstream West and East Juyan-hai lakes (Cheng, 2002). Other related environmental crises in the area include the southward expansion of the Badain Jaran desert and an increased occurrence of sand-storms (Li, 2009). So far, the main measures of water resources manage-ment in the Heihe river basin include water transfer, irriga-tion and a hydropower project (Xiao et al., 2011). Most of the water management has paid attention to the liquid blue water, while stored green water has been ignored.
Furthermore, to formulate water management to be in line with environmental capacity a good understanding of the spatio-temporal patterns of the natural hydrological flows in the basin is needed. Unfortunately, this type of information and subsequent interpretation and analysis are currently lack-ing for the Heihe river basin. Therefore, the aim of our cur-rent research is to establish a benchmark for the natural flows of water in the basin and to quantify the spatial and temporal dynamics of green and blue water in the entire Heihe river basin under natural conditions. This information can provide a reference for subsequent studies and it can also be used to inform policy makers about the original state of water re-sources in the basin. Importantly, we focus on the complete river basin opposed to other studies that have looked at cer-tain segments of the basin which are not sufficient to achieve integrated green and blue water management.
Specific objectives were (1) to calibrate and validate the SWAT model at two hydrological stations accounting for 85 % of the total discharge in the Heihe river basin but that are not much affected by human intervention; (2) to quantify the spatial and temporal dynamics of green and blue water under natural conditions in the entire Heihe river basin and discuss implications for further research.
2 Methodology
2.1 The study area
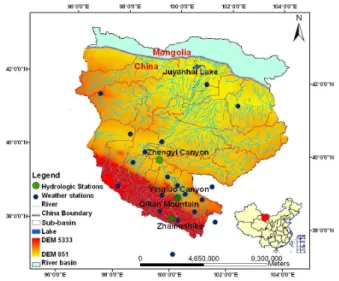
Fig. 1.The Heihe river basin with DEM, rivers, hydrological, lakes and weather stations indicated. The location of the Heihe river basin in China is shown in the inset.
with an area of 0.234 million km2. Such a boundary not only reflects a more accurate division with an explicit hydrolog-ical meaning, but also reflects a watershed boundary under natural conditions. The average altitude of the basin is over 1200 m. With a total length of 821 km, the Heihe river is di-vided into three sections: upstream, mid-stream and down-stream. The upstream runs from the Qilian Mountain to the Yingluo Canyon with a length of 303 km, the mid-stream runs from the Yingluo Canyon to Zhengyi Canyon, while the downstream goes from the Zhengyi Canyon and terminates into the Bada in Juran desert. The annual temperature is 2– 3◦ upstream, 6–8◦midstream, and 8–10◦downstream. The average annual precipitation is between 200 to 500 mm in the upstream, less than 200 mm in the mid-stream, and less than 50 mm in the downstream area. Potential evaporation ranges from 1000 mm yr−1upstream to 4000 mm yr−1 down-stream (Liu et al., 2008). The precipitation in the Heihe river basin occurs mainly in summer, spring and autumn are dry and some melting water is generated in spring, there is much snow in winter. The climate of the Heihe river basin is very dry, especially downstream where the drought index defined by the ratio of potential evapotranspiration and precipitation equals 47.5 (Li, 2009). There are 24 tributary channels with a total annual runoff larger than 10 million m3, with more than 0.375 billion m3 coming from the Qilian Mountains. The multi-year annual average precipitation is 122.6 mm, and most of this falls between May and August, accounting for over 70 % of the total annual precipitation (Li, 2009). The melting water of Heihe river basin amounts to 0.1 billion m3, or 4 % of the total discharge (Li, 2009). Since the 1980s, agri-cultural water use has increased sharply midstream. From the 1980s to the 1990s, the annual discharge through the Zhengyi Canyon decreased from 0.942 billion m3to 0.691 billion m3
(Xiao et al., 2011). River runoff provides about 65 % of the
irrigation water in midstream region while groundwater pro-vides over 90 % of the irrigation water in the downstream region (Xiao et al., 2011). The main land cover types are desert, mountains and oasis, which cover 57.15 %, 33.16 % and 8.19 % of the total basin area, respectively (Cheng et al., 2006).
The Heihe river basin has complex ecosystems ranging from mountains in the South, oases in the middle and deserts in the North (Cheng et al., 2006). These ecosystems are linked from upstream to downstream by the water cycle. In recent years, with socio-economic and population develop-ment, the water flow through the Heihe river basin has been diminishing year by year. For example, Zhangye, the biggest city of the Heihe river basin located mid-stream, has wit-nessed a population increase of 14 000 persons per year, with the population amounting to 1.27 million in 2000. Irrigated agricultural area has increased by 2.87 thousands ha yr−1,
with the total irrigated area reaching 216 thousands hectares in 2007 (Liu et al., 2008). Therefore, a detailed and integrated simulation study of the water resources of the complete river basin is critical and urgent for better water management.
2.2 Green and blue water flows
Green/blue water can refer to both volume and flow. Here the flow concept is taken. Green water flow refers to actual evap-otranspiration, while blue water flow is the sum of surface runoff, lateral flow, and return flow from shallow aquifers. The green water coefficient (GWC) is defined as the ratio of green water flow to the total green and blue water flows, and it is calculated by the equation below (J. Liu et al., 2009).
GWC= g
(b+g) (1)
wherebandgare blue and green water flows, respectively, in mm yr−1.
The relative change rate (RCR) is used to indicate the change of green/blue water flows in different periods. RCR=Vi−V0
V0
×100 % (2)
whereV refers to the variables such as green water flow or blue water flow,i indicate the latter period and 0 indicates the initial period.
2.3 The SWAT model
al., 2009; Schuol et al., 2008) and quality (Gassman et al., 2007) assessments for a wide range of scales and environ-mental conditions, including green/blue water assessments; secondly, the SWAT model has been used to simulate the hydrological processes in a small upstream segment of the Heihe river basin successfully (Huang and Zhang, 2004; Li et al., 2009). There are more than nine types of hydrological models that have been used in the Heihe river basin for wa-ter resources research (Li, 2009). Nevertheless, all of these model simulations have focused on upstream river segments in the Qilian Mountains, which form only 14.7 % of the to-tal river basin area. The hydrological processes have never been studied for the entire river. An important reason is that past research on hydrological cycles is often focused on hu-man water use, particularly blue water use, thus overlook-ing water use by ecosystems. The up- and middle segments are regions where blue water is generated and used, but the downstream segments and surrounding areas are dominated by natural ecosystems and a low population density. Hence, most of the studies have focused on simulating upstream seg-ments and not the entire basin or downstream watersheds. However, we argue that studying the hydrological processes for the entire basin is essential since water is not only re-quired by human beings but also needed by natural ecosys-tems. In addition, a study covering the entire basin makes more sense from a hydrological point of view. An additional reason for the emphasis on upper river segments may also be the lack of available data for the downstream river segments. In our research, we use SWAT2005, which was running on Arcview 3.3 with a daily time step. In SWAT the modelled area is divided into multiple sub-basins and hydrological re-sponse units (HRUs) by overlaying elevation, land cover, soil, and slope classes. The HRUs are characterized by com-binations of dominant land-use, soil, and slope classes. This choice was essential for keeping the size of the model at a practical limit. For each of the sub-basins, water balance was simulated for four storage volumes: snow, soil profile, shal-low aquifer, and deep aquifer. Potential evapotranspiration was computed using the Hargreaves method (Hargreaves et al., 1985). The calculation of evaporation requires the input of daily precipitation, and minimum and maximum temper-ature. Surface runoff was simulated using a modified SCS curve number (CN) method and snow and melting water cal-culated by the energy balance equation. Further technical model details are given by Neitsch et al. (2004). The pre-processing of the SWAT model input was performed within ESRI Arc-GIS 9.3.
The Av-SWAT interface was used for the setup and param-eterization of the model. The entire river basin was divided into 303 HRUs and 34 sub-basins on the basis of the digital elevation model (DEM). The geomorphology, stream param-eterization, and overlay of soil and land cover were automat-ically done within the interface. We only present results for the river basin within the Chinese boundary due to the lack of data for Mongolia.
Fig. 2. Comparisons between the observed and simulated (ex-pressed as 95 % prediction uncertainty band) discharge for the Zhamushike and Yingluo canyon hydrological stations in Heihe river basin.
2.4 Data
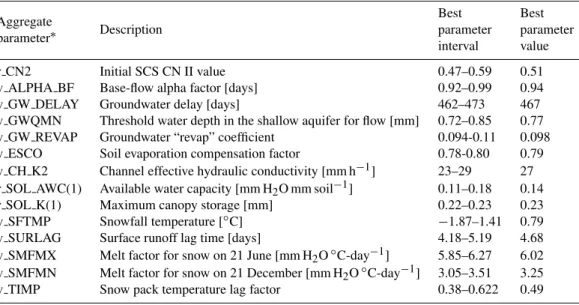
Table 1.The most sensitive parameters and their best parameter intervals and values.
Aggregate Best Best
parameter∗ Description parameter parameter interval value r CN2 Initial SCS CN II value 0.47–0.59 0.51 v ALPHA BF Base-flow alpha factor [days] 0.92–0.99 0.94 v GW DELAY Groundwater delay [days] 462–473 467 v GWQMN Threshold water depth in the shallow aquifer for flow [mm] 0.72–0.85 0.77 v GW REVAP Groundwater “revap” coefficient 0.094-0.11 0.098 v ESCO Soil evaporation compensation factor 0.78-0.80 0.79 v CH K2 Channel effective hydraulic conductivity [mm h−1] 23–29 27 r SOL AWC(1) Available water capacity [mm H2O mm soil−1] 0.11–0.18 0.14 r SOL K(1) Maximum canopy storage [mm] 0.22–0.23 0.23 v SFTMP Snowfall temperature [◦C] −1.87–1.41 0.79 v SURLAG Surface runoff lag time [days] 4.18–5.19 4.68 v SMFMX Melt factor for snow on 21 June [mm H2O◦C-day−1] 5.85–6.27 6.02 v SMFMN Melt factor for snow on 21 December [mm H2O◦C-day−1] 3.05–3.51 3.25 v TIMP Snow pack temperature lag factor 0.38–0.622 0.49
∗The aggregate parameters are constructed according to Yang’s work (Yang et al., 2007, 2008). “v ”, “r ” means an increase, a replacement and a relative change to the initial parameter value respectively. The range of the aggregate parameter best distribution for is mainly based on SWAT-CUP calibration results.
the data was followed by an accuracy assessment and anal-ysis of the quality and integrity of the data. The basic input maps included DEM at a resolution of 30 m (USGS/EROS, 2009) and land cover at a resolution of 1 km from the Heihe Data Research Group. There are 26 classes of land use in the Heihe river basin including cropland, forest, grassland, lakes, wetland, among others. We have built the land use database using Chinese land cover type charac-ters (http://westdc.geodata.cn/Portal/metadata/listMetadata. jsp?category=1053\&isCookieChecked=true). The soil data was obtained from the Harmonized World Soil Database produced by the Food and Agriculture Organization of the United Nations (FAO), the International Institute for Applied Systems Analysis (IIASA), and the Institute of Soil Science-Chinese Academy of Sciences (ISSCAS) (http://www.iiasa. ac.at). This dataset has a spatial resolution of 30 arc-second (about 1 km), and it includes 63 soil types for the Heihe river basin with two soil layers (0–30 cm and 30–100 cm depth) for each type. The climate data for 19 weather stations were used for model simulation (Fig. 1). The daily climate input data (precipitation, minimum and maximum temperature) for the period of 1977–2004 were obtained from the Heihe Data Research Group and China Meteorological Data Shar-ing Services System (http://cdc.cma.gov.cn/index.jsp). River discharges for a time period from 1977–1987 and 1990–2004 were also provided by the Heihe Data Research Group. As a first step, we aim to simulate green and blue water flows without human intervention; hence, management data such as irrigation were not collected.
2.5 Model calibration and validation
Model calibration and validation is a challenging and to a cer-tain degree subjective step in a complex hydrological model. We aim for the model simulation to reflect natural conditions. Therefore, the SWAT model of the Heihe river basin was calibrated and validated using monthly river discharges for two upstream stations where human activities are not inten-sive. These stations are the Zhamushike station and Yingluo canyon (see the locations in Fig. 1) and have also been used for calibration and validation by Li (2009). Our reasons are twofold: (1) more than 85 % of the annual discharge in the Heihe river flows through these two hydrological stations so the optimised parameters of the upstream area will be very important in representing the entire watershed; (2) the sta-tions are not much affected by human interference which is in line with our aim of analysing the green and blue water distribution under natural conditions. Furthermore, they have the most complete discharge data for 1977–1987 and 1990– 2004.
The simulation period was from 1977 to 2004. The first two years were used as warm-up period to mitigate the ef-fect of unknown initial conditions, which were subsequently excluded from the analysis. Hence, we divide the discharge data into two periods: a calibration (1979–1987) and a vali-dation period (1990–2004).
Fig. 3.The total amount of water flow (the best simulation and long term average annual values) and its relative change rate in the Heihe river basin.
listed in Table 1. Two indices, the Nash-Sutcliffe coefficient (Eq. 3) and the coefficient of determination (Eq. 4), are used to evaluate the goodness of the calibration and validation.
whereEns=1−
n P
i=1
(Qoi−Qmi)2 n
P
i=1
(Qoi−Qo)2
(3)
R2= n
P
i=1
(Qoi−Qo)(Qmi−Qo)
2
n P
i=1
(Qoi−Qo)2(Qmi−Qo)2
(4)
Ensis the Nash-Sutcliffe coefficient,Qoithe observed data of
runoff iniyears,Qmithe simulation data of runoff iniyears,
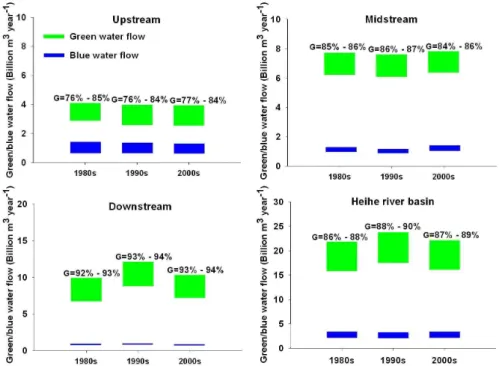
Fig. 4.The total water flow and green water coefficients from the 1980s to the 2000s in the Heihe river basin (Gis green water coefficient).
are to 1, the more accurate the model prediction, whereas an Ens>0.0 indicates that the model is a better predictor
than the mean of the observed data. More information about the Nash-Sutcliffe coefficient and SWAT-CUP can be found in Nash and Sutcliffe (1970) and Abbaspour (2007), respec-tively.
The SUFI-2 method in the SWAT-CUP interface (Ab-baspour et al., 2007) was used for parameter optimization. In this method all uncertainties (parameter, conceptual model, input, etc.) are mapped onto the parameter ranges, which are calibrated to bracket most of the measured data in the 95 % prediction uncertainty (Abbaspour et al., 2007). The overall uncertainty analysis in the output is calculated by the 95 % prediction uncertainty (95PPU) and we chose two different indices to compare measurement to simulation: the P-factor and the R-factor. The P-factor is the percentage of data brack-eted by the 95PPU band. The maximum value for the P-factor is 100 %, and ideally we would like to bracket all measured data, except the outliers, in the 95PPU band. The R-factor is the average width of the band divided by the standard de-viation of the corresponding measured variable (Abbaspour, 2007; Faramarzi et al., 2009). The R-factors were calculated as the ratio between the average thickness of the 95PPU band and the standard deviation of the measured data. It represents the width of the uncertainty interval and should be as small as possible. R-factor indicates the strength of the calibration and should be close to or smaller than a practical value of 1 (Abbaspour, 2007).
3 Results and discussion
3.1 Calibration and validation
The calibration and validation performed with SWAT at the two hydrological stations was satisfactory, as indicated by high values ofEns andR2 (Fig. 2). The Ens-values at both
Zhamushike and Yingluo canyon are above 0.87, and the R2 -values are greater than 0.90. Our calibration and validation results seem better than those from Huang and Zhang (2004) and Li (2009). Meanwhile, the simulated and observed dis-charges have very similar variation trends (Fig. 2), especially in the validation period of Yingluo Canyon.
The good agreement between the simulation results and observations indicates that the SWAT model set-up is suit-able for the Heihe river basin. The most sensitive parameters with their best parameter intervals and best parameter values eventually used in this study are shown in Table 1.
Nevertheless, several challenges remain while optimizing the parameters, for instance, model calibration using river discharge alone does not provide confidence on the partition-ing of water between soil storage, actual evapotranspiration and aquifer recharge. When additional data (e.g. measured evapotranspiration) are available, a multi variable calibration is required to calculate water resources availability based on water yield and green water components.
3.2 Total water flow (sum of green and blue water flows)
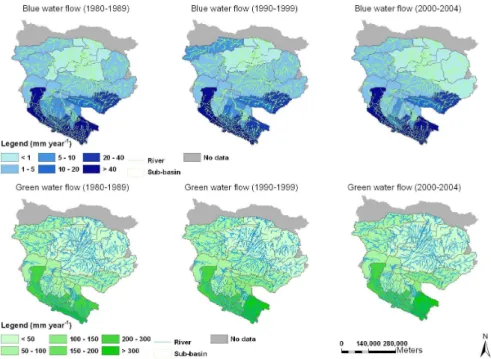
Fig. 5.The green/blue water flows (the best simulation and long term average annual values) per unit area (mm yr−1)from the 1980s to the 2000s in the Heihe river basin.
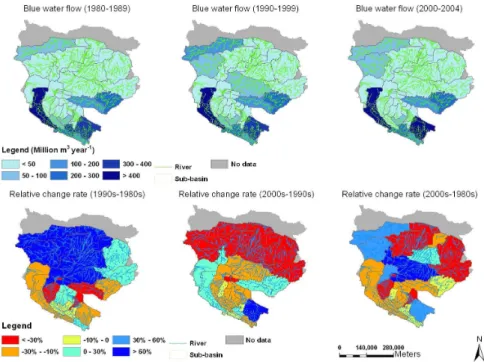
in Fig. 3. From the relative change rate, we found that there is a general decreasing trend in per unit area water flow (in mm yr−1)from upstream to downstream sub-basins (Fig. 3). This is easy to understand because annual precipitation de-creases from upstream to downstream with snow and melting water upstream (Wang and Zhou, 2010).
The total water flow was 22.05–25.51 billion m3 in the 2000s for the entire river basin. There are several blue col-ored regions that stand out with relative high total water flow in volume: those upstream generally have high precipitation and often a large volume of snow and melting water (Li, 2009), while those downstream are often resulting from large sub-basin areas. SWAT generates sub-basins based on DEM, land use and soil types. Because downstream regions have more homogeneous distribution of elevation, land use and soil types, the downstream sub-basin areas can be ten times larger than those upstream. From the 1980s to the 1990s, the total water flow has a general decreasing trend in upstream and midstream sub-basins, but the relative change rate has a general increasing trend in downstream sub-basins. However, for the relative change rate from the 1990s to 2000s, there are very different change patterns, with increasing trends in upstream and middle stream sub-basins but decreasing trends in downstream sub-basins (Fig. 3). In upstream and mid-stream sub-basins, precipitation and temperature had decreasing trends from the 1980s to 1990s, but increasing trends from 1990s to 2000s (Wang and Zhou, 2010), lead-ing to different change patterns in total amount of precipita-tion water and snow and melting water. In downstream sub-basins, sunshine durations increased from the 1980s to the
1990s but decreased from the 1990s to the 2000s (Y. Liu et al., 2009), which caused increasing and decreasing tempera-ture in the two periods, respectively. The temperatempera-ture varia-tion caused evapotranspiravaria-tion changes downstream (Cheng et al., 2007). Therefore, climate variability is a main reason for the variation of total water flow under natural conditions in the Heihe river basin. From 1980s to 2000s, the total wa-ter flow of Heihe river basin did not change much with a very slight increase by about 1.1 %–1.4 % (Fig. 4).
3.3 Spatial and temporal distribution of green/blue
water flows per sub-basin
Both the green and blue water flows per unit area in the Heihe River basin decreased from up stream to downstream (Fig. 5). Generally, where blue water flows per unit area are high, green water flows also tend to be high (Fig. 5), in line with findings of previous research (Schuol et al., 2008). The spatial patterns of the green/blue water flows per unit area are mainly influenced by the spatial patterns of precipitation, which generally decreases from upstream to downstream. Land cover also plays a role here. Sub-basins with snow and melting water often have higher blue water flows per unit area.
Fig. 6.The blue water flows (the best simulation and long term average annual values) (million m3yr−1)from the 1980s to the 2000s in the Heihe river basin.
amount of runoff and blue water flows. In downstream sub-basins, precipitation is very low while desert is the dominant land cover. Runoff is small and hence blue water flows are low.
It seems that, from the 1980s to 1990s, blue water flows relative change rate decreased upstream and middle-stream and increased downstream (Fig. 6). However, from the 1990s to 2000s, relative change rate has different trends occur with blue water flows increasing upstream but decreasing down-stream. When comparing blue water flows in the 1980s with those in the 2000s, there are no clear trends of changes among regions. We can not identify a clear trend related to climate change. Climate variations in the Heihe river basin influences precipitation and temperature, which caused the variation in blue water flow.
Green water flows are distributed more homogeneously than blue water flows among regions. In upstream sub-basins, precipitation is high, but due to the low tempera-ture, evapotranspiration may be relatively small. In down-stream sub-basins, precipitation is low, but in the desert ar-eas, there is little runoff, or in the other words, precipitation is almost directly evaporated into the atmosphere. Besides the climatic factors and land cover, the area of sub-basins is often larger downstream than upstream. This also contributes to the more even distribution of green water flows. Further-more, the green water flow quantity is similar to previous re-search. Jin and Liang (2009) studied the actual evapotranspi-ration of Zhangye in the Heihe river basin, which is located at midstream and close to Zhengyi canyon. They showed that annual evapotranspiration ranged from 238 million m3in the
1980s to 355 million m3in the 2000s. Our results show an-nual evapotranspiration of about 200 to 400 million m3 in
the above two periods (Fig. 7). Similar results were also esti-mated by Cheng et al. (2007).
There is no clear evidence that shows significant impacts of climate change on green water flows. In many middle and downstream sub-basins, green water flow relative change rate increased from the 1980s to the 1990s but decreased since the 1990s, while in several upstream sub-basins, green water flows decreased from the 1980s to the 1990s but increased since the 1990s (Fig. 7). There are no clear signals of in-creased or dein-creased green water flows with time.
3.4 Spatial and temporal distribution of green
water coefficient
Fig. 7.The green water flows (the best simulation and long term average annual values) (million m3yr−1)from the 1980s to the 2000s in the Heihe river basin.
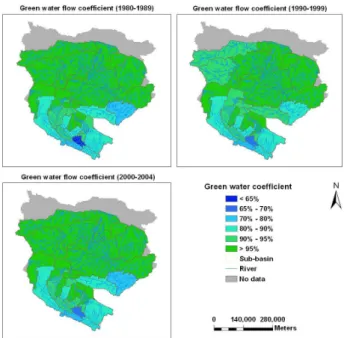
Fig. 8.The green water coefficient (the best simulation and long term average annual values) from the 1980s to the 2000s in the Heihe River basin.
flows through Yingluo Canyon in this sub-basin onwards to mid- and downstream (Li, 2009). As a flow accumulation re-gion, this sub-basin has the lowest green water coefficient among all sub-basins. Downstream, precipitation is low and desert is the dominant land cover. Runoff seldom occurs as
precipitation mostly evaporates. Hence, the green water co-efficient is extremely high. From the 1980s to the 2000s, the green water coefficient does not change much for most of the sub-basins (Fig. 8).
For the entire basin, the green water coefficient remained relatively stable over the whole time period (87 %–89 % in the 1980s, 88 %–89 % in the 1990s and 88 %–89 % in the 2000s; Fig. 4). The green water coefficient is very high com-pared to previous studies on other locations, e.g. 58 % in the Congo river basin and 61 % in the west of Iran (Schuol et al., 2008; Faramarzi et al., 2009). The high green water coeffi-cient in the Heihe river basin is mainly a result of the arid-and semi-arid climate conditions, which leads to low runoff and groundwater discharge but high evapotranspiration. We do not find a significant trend of change in the green wa-ter coefficient. The fluctuation of the green wawa-ter coefficient also occurs upstream and mid-stream (Fig. 4). Downstream, the green water coefficient increased from the 1980s to the 2000s.
4 Summary and conclusion
distributions of blue and green water flows were presented for the entire river basin.
Generally, green and blue water flows per unit of area de-crease from upstream to downstream. The total water flow in the Heihe river basin has changed little during 1980–2004. Since we do not consider human intervention in the simula-tion, the changes are completely related to climatic factors, i.e. precipitation and temperature. Our results show variation without any clear temporal trend on total water flow in the Heihe river basin. Instead, natural climate variability is likely the main reason for the temporal changes of water flows.
The present research on green and blue water flows con-siders only natural conditions without human intervention, e.g. land use change. However, the water resources distribu-tion in time and space has been altered by human activities midstream. This has led to significant deviations of the green and blue water flows and transformations from what would be expected under natural conditions. Therefore, including human activities for the simulation of green/blue water flows in Heihe river basin is necessary, and will be the next step of our research.
This study is limited by several shortcomings. First, the limited number and uneven distribution of weather and hy-drological stations (Fig. 1) influences the accuracy of results. Only 19 weather stations and two hydrological stations were used in this study and shortage of data will influence sim-ulation accuracy. Second, for now we neglect the effects of irrigation water use, land use change and operation of reser-voirs. Clearly, human activities, especially the expansion of irrigated area, have already influenced the water cycling sig-nificantly in the Heihe river basin. However, the extent of the hydrological responses to human intervention has never been assessed quantitatively. The current study provides a first step for such an assessment by quantifying the green and blue wa-ter flows under natural conditions. Third, although the two upstream discharge stations represent 85 % of the annual dis-charge flows, they represent a small proportion of the entire region. Using only these two stations may work satisfacto-rily for simulating green and blue water flows under natural situations, but more hydrological stations are still needed in the next step to study the effects of human activities on hy-drological flows. Last but not least, the lack of soil moisture and actual evapotranspiration data hampers the validation of the green water flow simulations.
This study provided insights into green and blue water flows for the entire Heihe river basin at sub-basin level. This information is very useful for developing an overview of the actual water resources status and will provide a theoretical reference for the water resources management of the inland river basins of China.
Acknowledgements. This study was supported by the National Natural Science Foundation of China (91025009), IIASA Young Scientists Summer Program (41111140128), Projects of
Interna-tional Cooperation and Exchanges NSFC (41161140353), New Century Excellent Talents in University (NCET-09-0222), Inter-national S&T Cooperation Program from the Ministry of Science and Technology of China (2012DFA91530), and Fundamental Research Funds for the Central Universities (HJ2010-1). We also thank Cheng Guodong from the Cold Area and Drought Zone Environmental Conditions and Engineering Institute of the Chinese Academy of Sciences, Zhang Yinglan from the National Natural Science Foundation, and Li Xiubin, Zhang Ganlin and Xiao Honglang for their support to the projects and advice on the research. We also thank Karim C. Abbaspour from the Swiss Federal Institute of Aquatic Science and Technology (Eawag) for his support with the SWAT-CUP calibration and validation. We also thank the editor and two anonymous reviewers for their constructive comments on the earlier version of the manuscript.
Edited by: A. Wei
References
Abbaspour, K. C.: User Manual for SWAT-CUP, SWAT Calibration and Uncertainty Analysis Programs. Swiss Federal Institute of Aquatic Science and Technology, Eawag, Duebendorf, Switzer-land, 93 pp., 2007.
Abbaspour, K. C., Yang, J., Maximov, I., Siber, R., Bogner, K., Mieleitner, J., Zobrist, J., and Srinivasan, R.: Modelling hydrol-ogy and water quality in the pre-Alpine/Alpine Thur watershed using SWAT, J. Hydrol., 333, 413–430, 2007.
Cheng, G.: Study on the Sustainable Development in Heihe River Watershed from the View of Ecological Economics, Journal of Glaciology and Geocryology, 24, 335–344, 2002.
Cheng, G. and Zhao, L.: GreenWater and Its Research Progresses, Advances in Earth Science, 21, 221–227, 2006.
Cheng, G., Xiao, H., Xv, Z., and Li, J.: Water Issue and Its Counter-measure in the Inland River Basins of Northwest China: A Case Study in H eihe River Basin, Journal of Glaciology and Geocry-ology, 28, 406–413, 2006.
Cheng, Y., Wang, G., Xi, H., and Wang, J.: Variations of Land Evap-otranspiration in the Plain of the Middle Reaches of Heihe River in the Recent 35 Years, Journal of Glaciology and Geocryology, 29, 406–412, 2007.
Falkenmark, M.: Land-water linkages: A synopsis: Land and Water Integration and River Basin Management, Land and Water Bul-letin No. 1, FAO, Rome, 15–17, 1995a.
Falkenmark, M.: Coping with water scarcity under rapid population growth, in: Conference of SADC Minister Pretoria, 1995b. Falkenmark, M.: Freshwater as shared between society and
ecosys-tems: from divided approaches to integrated challenges, Philos. T. Roy. Soc. Lond., 358, 2037–2049, 2003.
Falkenmark, M. and Rockstr¨om, J.: The New Blue and Green Water Paradigm: Breaking New Ground for Water Resources Planning and Management, J. Water Res. Pl.-ASCE, 132, 129–132, 2006. Faramarzi, M., Abbaspour, K. C., Schulin, R., and Yang, H.: Mod-elling blue and green water resources availability in Iran, Hyrol. Process., 23, 486–501, 2009.
Gerten, D., Hoff, H., and Bondeau, A.: Contemporary green water flows: Simulations with a dynamic global vegetation and water balance model, Phys. Chem. Earth, 30, 334–338, 2005. Guo, Q., Yang, Y., Chen, X., and Chen, Z.: Annual Variation of
Heihe River Runoff during 1957–2008, Progress in Geography, 30, 550–556, 2011.
Hargreaves, G. L., Hargreaves, G. H., and Riley, J. P.: Agricultural Benefits for Senegal River Basin, J. Irrig. Drain. E.-ASCE, 111, 113–124, 1985.
Huang, Q. and Zhang, W.: Improvement and Application of GIS-based distributed SWAT Hydrological Modeling on High Alti-tude, Cold, Semi-arid Catchment of Heihe River Basin, China, Journal of Nanjing Forestry University (Natural Sciences Edi-tion), 28, 22–26, 2004.
Jansson, ˚A., Folke, C., Rockstr¨om, J., and Gordon, L.: Linking Freshwater Flows and Ecosystem Services Appropriated by Peo-ple: The Case of the Baltic Sea Drainage Basin, Ecosystems, 2, 351–366, 1999.
Jin, Xiaomei and Liang, Jijun: The Temporal Change of Regional Evapotraspiration and the Impact Factors in Middle Stream of the Heihe River Basin, Journal of Arid Land Resources and En-vironment, 23, 88–92, 2009.
Li, Z.: Runoff simulation in the upper reaches of Heihe River Basin and uncertainty anakysis in hydrological modeling, Dissertation Submitted to Beijing Normal University in Partial Fulfillment of the Requirement for Degree of Doctor of Engineering, 5–21, 2009.
Li, Z., Xu, Z., Shi, Q., and Yang, J.: Parameter estimation and un-certainty analysis of SWAT model in upper reaches of the Heihe river basin, Hydrol. Process., 23, 2744–2753, 2009.
Liu, J., Zehnder, A. J. B., and Yang, H.: Global consump-tive water use for crop production: The importance of green water and virtual water, Water Resour. Res., 45, W05428, doi:10.1029/2007WR006051, 2009.
Liu, S., Zhao, G., Zhang, C., and Zhao, X.: Water Resources System Evolution and Impact of Human Activities in Heihe River Basin, Journal of Jilin University (Earth Science Edition), 38, 806–812, 2008.
Liu, Y., Zhang, B., Zhang, Y., and Kang, S.: Climatic change of sunshine duration and its influencing factors over Heihe River Basin during the last 46 years, Journal of Arid Land Resources and Environment, 23, 72–76, 2009.
Ma, W., Ma, Y., Hu, Z., Su, Z., Wang, J., and Ishikawa, H.: Estimat-ing surface fluxes over middle and upper streams of the Heihe River Basin with ASTER imagery, Hydrol. Earth Syst. Sci., 15, 1403–1413, doi:10.5194/hess-15-1403-2011, 2011.
Nash, J. E. and Sutcliffe, J. V.: River flow forecasting through con-ceptual models. Part I – a discussion of principles, J. Hydrol., 10, 282–290, 1970.
Neitsch, S. L., Arnold, J. G., Kiniry, J. R., and Williams, J. R.: Soil and Water Assessment Tool Input/Output File Documentation Version 2005, Grassland, Soil and water research laboratory An-griculture research services & Black land research Center Texas Agricultual Experiment station, 2004.
Oki, T. and Kanae, S.: Global hydrological cycles and world water resources, Science, 5790, 1068–1072, 2006.
Rockstrt¨om, J.: On farm green water estimates as a tool for in-creased food production in water scarcity regions, Phys. Chem. Earth, 24, 375–383, 1999.
Rost, S., Gerten, D., Bondeau, A., Lucht, W., Rohwer, J., and Schaphoff, S.: Agricultural green and blue water consumption and its influence on the global water system, Water Resour. Res., 44, W09405, doi:10.1029/2007WR006331, 2008.
Schuol, J., Abbaspour, K. C., Yang, H., Srinivasan, R., and Zehnder, A. J. B.: Modeling blue and green water availability in Africa, Water Resour. Res., 44, W07406, doi:10.1029/2007WR006609, 2008.
USGS/EROS, ASTER GDEM Validation Team:METI/ERSDAC NASA/LPDAAC: ASTER Global DEM Validation Summary Report, 2009.
Wang, C. and Zhou, X.: Effect of the recent climate change on water resource in Heihe river basin, Journal of Arid Land Resources and Environment, 24, 60–65, 2010.
Xiao, S., Xiao, H., Li, Y., and Yang, Y.: Water Issues and Integrated Water Resource Management in Heihe River Basin in Recent 50 Years, Jounal of Desert Research, 31, 529–535, 2011.
Yang, J., Reichert, P., Abbaspour, K. C., and Yang, H.: Hydrolog-ical modelling of the Chaohe basin in China: StatistHydrolog-ical model formulation and Bayesian inference, J. Hydrol., 340, 167–182, 2007.