T
he capacity of sugar beet farms’ machinery and
equipment
Potencjał techniczny gospodar stw specjali zujących
się w produkc ji bura ków cukrowych
Małgorzata BZOWSKA – BAKALARZ* and Katarzyna OSTROGA
Department of Agricultural Machines Theory, University of Life Sciences in Lublin *correspondence [email protected]
ABSTRACT
The survey investigates into equipment of sugar beet farms of the Lublin region, Poland, with machinery – with reference to plantation size and yields. To assess the production potential of the farms, the authors determined the age structure of the machinery owned by the farmers and established the scale of investment in new equipment. The machinery most important for sugar beet production are pre-sowing and post-harvest tillage units, sprayers, seed drills, combine harvesters and self-unloading trailers. In most cases, the surveyed farmers own most of these machines, but they are often obsolete: 37% of them is in operation for more than 15 years. As for the machines dedicated solely to sugar beet growing (harvesters and seeders), their age structure is most unfavourable – 70% of them have been used for over 15 years. A trend towards increasing plantation sizes provides incentives for introducing innovation to cultivation methods. However, the scale of investment in new
machinery is small, especially in the case of small and medium-sized farms that dominate in the region. The authors surveyed also the scale of using professional services in the field of tillage processes to determine changes in farming practices.
Keywords: sugar beet, production system, machinery, equipment of farms,
contracting out, producer groups
STRESZCZENIE
W pracy przedstawiono charakterystykę wyposażenia technicznego gospodarstw specjalizujących się w produkcji buraków cukrowych w Polsce, na Lubelszczyźnie, z uwzględnieniem wielkości plantacji i uzyskiwanych plonów. W celu określenia
Słowa kluczowe: burak cukrowy, system produkcji, maszyny, wyposażenie gospodarstw, zlecanie usług, grupy producenckie
DETAILED ABSTRACT
Województwo lubelskie pomimo ograniczenia, w wyniku reformy rynku cukru, produkcji cukru o 27 % i zmniejszenia areału uprawy buraków o 23% zajmuje nadal trzecie miejsce w Polsce pod względem wielkości produkcji zarówno cukru jak i buraków. Celem badań była ocena wyposażenia technicznego gospodarstw specjalizujących się w produkcji buraków i na tej podstawie opracowanie sposobu podniesienia poziomu techniczno-technologicznego.
Uwzględniono wielkość plantacji i uzyskiwane plony. W celu określenia potencjału technicznego tych gospodarstw uwzględniono wiek maszyn oraz zbadano skalę zakupów nowego sprzętu. Badania prowadzono na Lubelszczyźnie.
Narzędziem do zbierania danych w gospodarstwach były kwestionariusze
wypełniane przez plantatorów. Respondenci zostali wytypowani przy współpracy z pracownikami działów surowcowych cukrowni na podstawie pozytywnych wyników produkcyjnych. Dobór gospodarstw do badań był celowy. Rozkład gospodarstw w przestrzeni województwa odpowiadał w przybliżeniu rozmieszczeniu wszystkich plantacji buraków cukrowych w regionie. Oceniając poprawność wykonywanych na plantacjach zabiegów opierano się na dostępnej literaturze przedmiotu.
Tendencja do zwiększania plantacji stwarza warunki organizacyjne do wprowadzania innowacji technologicznych. Jednak, na podstawie analizy zakupów sprzętu w ciągu trzech lat badań stwierdzono, że skala odnawiania parku maszynowego nie jest duża, zwłaszcza w gospodarstwach małych i średnich.
Ponad 60 % siewników to maszyny użytkowane ponad 20 lat a aż 49% kombajnów użytkowanych jest ponad 20 lat. Struktura wieku pozostałych maszyn także nie jest korzystna, co stwarza konieczność inwestycji bądź korzystania z zespołowych form użytkowania maszyn.
Pozorna samowystarczalność gospodarstw w dziedzinie produkcji buraków wynika ze stosowania przestarzałych technicznie i technologicznie maszyn, które są podstawą tradycyjnej technologii. Wielu rolników korzysta z sąsiedzkiej pomocy w zakresie wykonywania niektórych zabiegów technologicznych, co świadczyłoby o dobrym podłożu do przeforsowania idei tworzenia grup producenckich.
Introduction
In the case of integrated agriculture, production systems are expected to take the most advantage of the recent development in technical and biological sciences, and apply it, in a consonant way, to improve tillage, fertilization, plant protection, harvest and post-harvesting crop management. Thus, subordinating the sugar-beet
production process to the criterion of the technical progress is treated as a
on individual farms. These are diverse in terms of production potential, and
numerous. For instance, in the season 2009/2010, 40,411 farms were reported to provide sugar beet in Poland, of which 9,737 were located in Lublin region. Their production potential has not been assessed in a systematic way.
Because of favourable natural conditions – rich soils and proper climate (Bzowska-Bakalarz and Ostroga, 2010, IUNG, 2004, Turski, et al., 2007) – Lublin region has a long tradition of sugar beet growing (Artyszak and Wyszyński, 2007,
Bzowska-Bakalarz, Bieganowski, 2008, Bzowska-Bakalarz and Ostroga, 2010, Ostroga, 2010). Despite Poland’s decreasing sugar production by 27% and reducing sugar beet acreage by 27%, Lublin region stays an important (third largest) supplier of Polish sugar industry. Lublin’s average root yield per hectare is slightly above Poland’s average (by 0.4 t·ha-1). However, it is lower than yields reported in Germany and France (Bzowska-Bakalarz and Ostroga, 2010, Ostroga, 2010). In order to respond to the growing requirements of sugar plants and biofuel manufacturers, the suppliers will have to be more efficient, i.e. improve their production methods and, possibly, invest in technical solutions. This substantiates the need to analyse sugar beet production practices and to assess how the machinery and equipment affect the yields and, consequently, the farmers’ income (Gorzelany, 2010, Lorencowicz, 2005, Wójcicki, 2008).
Therefore, the authors undertook a survey on sugar beet farms’ cultivation practices and condition of their machinery and equipment to assess the potential of improving their production capacity.
Materials and Methods
The object of the survey were 218 sugar beet farms located in Lublin region, mainly in its south-eastern part. Distribution of these farms was in accordance with the distribution of the region’s population of sugar beet plantations (Bzowska-Bakalarz and Ostroga, 2010, Lorencowicz, 2005). The survey was conducted during the
seasons 2006/2007, 2007/2008, and 2008/2009. Information was collected by means of structured interview (Stachak, 2006, Wójcicki, 2008). Respondents were selected purposefully among farms likely to maintain sugar beet production in the future. Selection of respondents was conducted in cooperation with sugar plants’ supply departments, according to the records on the quality of crops.
Statistical analysis of the results was conducted made by means of SAS 9.13 software (Littell, et al.; 2009)
Results and discussion
The surveyed farms were divided into four groups according to area of sugar beet plantations: small (below 5 ha – 136 farms), medium (from 5 ha to 10 ha – 64 farms), big (from 10 ha to 30 ha – 13 farms) and large (30 ha and more – 5 farms).
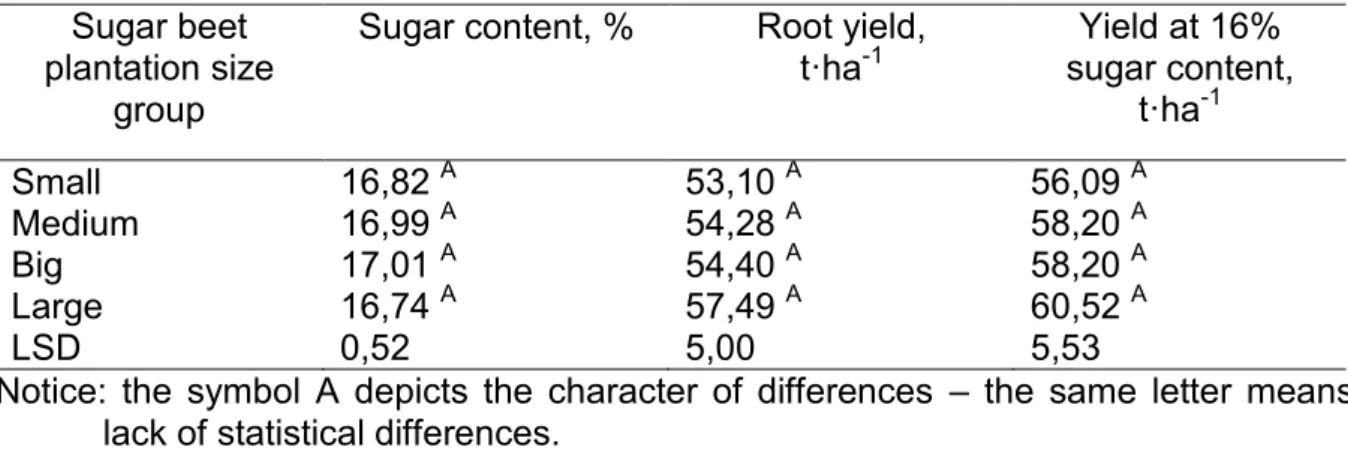
Table. 1. Sugar beet root and sugar yield per hectare according to sugar beet plantation size group.
Sugar beet plantation size
group
Sugar content, % Root yield,
t·ha-1 sugar content, Yield at 16% t·ha-1 Small Medium Big Large LSD
16,82 A 16,99 A 17,01 A 16,74 A 0,52
53,10 A 54,28 A 54,40 A 57,49 A 5,00
56,09 A 58,20 A 58,20 A 60,52 A 5,53
Notice: the symbol A depicts the character of differences – the same letter means lack of statistical differences.
The observation that sugar beet plantation size is irrelevant to yields (table 1) suggests that technological level of all surveyed farms may be similar.
Table 2 compares yields of roots and sugar of the surveyed farms with Lublin region’s and Poland’s average. In the considered seasons, the farms from the test sample proved more productive: their yield was by 3.8 t·ha-1higher than Lublin region’s average, and exceeded Poland’s average by 2.9 t·ha-1.
Table 2: Mean yield per hectare achieved by surveyed farms, in Lublin region and in Poland
Sample Season Mean root yield
(t·ha-1) Mean sugar yield (t·ha-1) Surveyed farms 2006/07
2007/08 2008/09 49.78 54.64 56.50 8.79 8.96 9.38 Lublin region 2006/07
2007/08 2008/09 45.75 51.80 51.90 7.97 n.a. 8.51
Poland 2006/07
2007/08 2008/09 48.30 55.73 48.10 8.11 9.52 8.09
The analysis of cultivation operations, as practiced by the surveyed farmers, was conducted on the basis of forms filled in 2008, and allowed the authors to define three common types of cultivation methods:
Method I with many cultivation operations, autumn fertilization, and deep fall ploughing, used by 80% of respondents,
Method II with after-harvest green manure crop ploughed either in Autumn (used by 12% of respondents and further referred to as Method IIa), or in Spring (used by 5% of respondents and further referred to as Method IIb),
Method III with beets sown in mulch, used by 3% of the respondents,
Moreover, more farmers tend to see benefits of using after-harvest tillage units - the number of these rose by 24% since 2006. Also green manure gained on popularity by 10%, application of deep ploughing by means of reversible plough – by 3%, using 6-row combine harvesters – by 14%.
The survey revealed a great variety of machinery used by the farmers for particular cultivation operations. This fact may add to the differences in root yield.
Table 3 presents an overview of the farms’ machinery (2008/2009). Interestingly, despite the majority of farms being small and medium-sized, most of the farms dispose of a full set of basic machinery.
Table. 3. Equipment with machines and tools used in sugar beet production in the analysed sample
Type of machine / tool
Number of machines / tools served by a ALA* single machine /
tool Total Per 100 farms 100 ha of Per
ALA*
Tractors 464 212.8 5.3 18.9
Trailers 466 213.8 5.3 18.9
Ploughs 259 118.8 2.9 34.1
Cultivators 152 69.7 1.7 58.0
Tooth harrows 183 83.9 2.1 48.2
Disc harrows 53 24.3 0.6 166.4
After-harvest tillage units 97 44.5 1.1 90.9
Pre-sowing tillage units 190 87.2 2.2 46.4
Subsoilers 41 18.8 0.5 215.2
All-purpose cultivators 122 56.0 1.4 72.3
Loaders 131 60.1 1.5 67.3
Manure tanks 25 11.5 0.3 352.8
Manure spreaders 147 67.4 1.7 60.0
Fertilizer spreaders 211 96.8 2.4 41.8
Sprayers 211 96.8 2.4 41.8
Seed drills 119 54.6 1.4 74.1
Beet combine harvesters 176 80.7 2.0 50.1
*total arable land area
As comes from other research (Artyszak and Wyszyński, 2007, Ostroga, 2010, Przybył et al 2004, Šařec and Šařec, 2005, Šařec et al., 2009, Szeptycki, 2005,
Turski, et al., 2007, Zimny, 2007), application of after-harvest and pre-seeding tillage units, sprayers, subsoilers, seed drills, combine harvesters and self-unloading trailers are crucial for quality and quantity of yield.
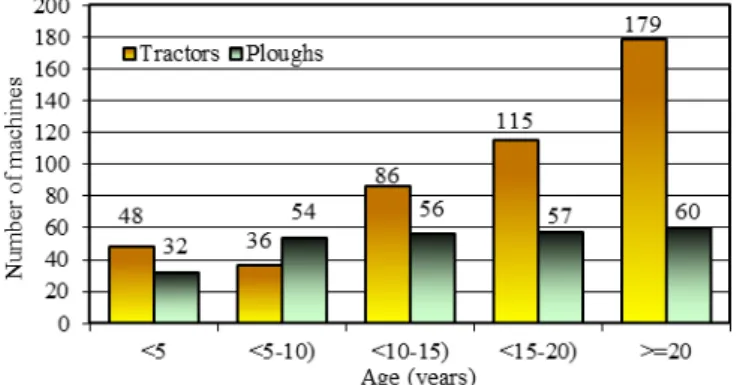
Fig. 1. Share of farms equipped with selected machines used in sugar beet production
On average, a sugar beet farmer owns 2.1 tractors, and 2.1 trailers. Each farmer has got, statistically, 1.2 ploughs (however, only 12% of ploughs used by the surveyed farmers were reversible ploughs), one fertilizer spreader, and one sprayer. Almost all surveyed farms were equipped with a tillage unit (0.9 such machines per farm) and spike-tooth harrow (0.8 per farm).
Among the tractors, most popular were those of power ranging from 30 kW to 55 kW – their share in the total number of tractors owned by the sample farms was 49%. As for age, the surveyed farmers do not seem to be willing to invest in new machines: 63% of tractors were over 15 years old.
On average, there were 5.3 tractors per each 100 ha of arable land area (or 1 tractor per 18.9 ha). The whole Lublin region’s average in the year 2008 was 11.2 tractors per 100 ha of arable land area – which indicates less intensive use than in the case of the analysed, selected farms. As for ploughs, 12% of them are quite new – up to 5 years old (Fig. 1).
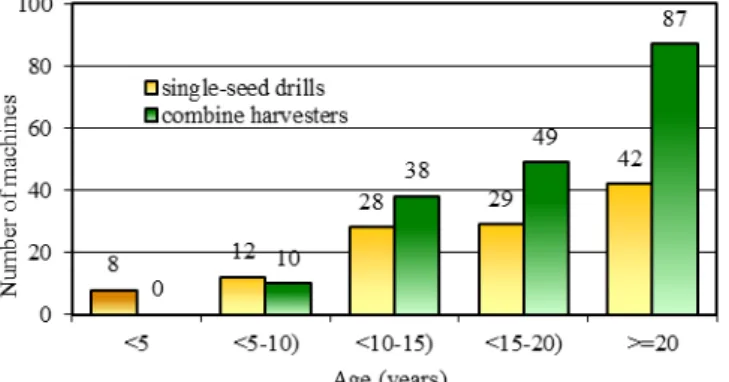
Single seed drills are owned by 55% of the surveyed farmers. Figure in Table 1 concerns the number of these machines per 100 ha of area dedicated to sugar beet and corn growing – as such type of seeders is used for these two crops. So, there were, on average, 8.8 seeders serving 100 ha (or one seeder per 11.4 ha). The age structure of single seeders used in the considered farms (Figure 3) is
disadvantageous: over 60% of the machines are over 15 years old, of which further 60% are in use for over 20 years. All surveyed farms used only six-row seeders; 91% of the machines were mechanical, the remaining 9% - pneumatic.
Fig. 3. Age structure of single seed drills and combine harvesters
Of the total of 176 combine harvesters reported by the surveyed farmers, only one was a 6-row self-propelled unit (Holmer). Other were two- and three-row towed machines, such as Neptun Z 413, Stoll V 100, Stoll V 50, Kleine 5002, Stoll V 202. As many as 49% of harvesters were in operation for over 20 years. There was, on average, one such machine serving 7.19 ha sugar beet fields (Table 1).
After-harvest tillage units were found in 44% of the farms. These are tools of the average working width of 2.7 m, and mainly comprised a harrow section and roller section. These machines were, on average, relatively new (Figure 4): over 39% of them were in use for less than 5 years, and 70% were less than 10 years old.
Fig. 4 Age structure of post-harvers and pre-sowing tillage units
Figure 5. Age structure of sprayers and fertilizer spreaders
machine serves 46.4 ha of arable land area (Table 2). The most popular type of the pre-sowing tillage unit are sets consisting of a cultivator, a tooth harrow and a roller (alternatively two rollers behind cultivator section). Only 11% of farmers dispose of the recommended set with cultivator section between the rollers).
Manure spreaders belong to the oldest resources in the sample farms – 78% of them were in service for more than 15 years, of which 61% were over 20 years old. The most popular type (56%) were those of load capacity from 3 t to 3,5 t; only 11% were over 5 t. On average, one manure spreader served 60 ha of arable land area.
Among sprayers and fertilizer spreaders, smaller units are more popular than the big ones: tanks up to 1000 dm3 were observed in the case of 72% of sprayers and 85% of fertilizer spreaders. The age structure of these types of machinery is presented in Figure 5.
To sum up, the survey revealed that most of the machinery of the sample farms (54%) was over 15 years old. This implies that the machinery is worn and obsolete. However, as the own machinery is not used efficiently in mostly small plantations, replacement in the form of buying new items is unlikely to be economically justified. Shared use agreements or contracting services would be an alternative to the purchase. Analysing the farmers’ purchases made during the three years of survey, the authors established that the most popular items were consecutively: tractors, sprayers, fertilizer spreaders, pre-sowing tillage units, ploughs post-harvest tillage units (table 4). However, 44% of these recently bought tractors were in fact second-hand.
Table. 4. Machinery bought for the sample farms during three years of the survey
Type of machine / tool Total Number of items bought New Used
Tractors 34 19 15
Trailers 11 7 4
Ploughs 17 12 5
Cultivators 1 1 0
Tooth harrows 8 6 2
Disc harrows 10 8 2
After-harvest tillage units 15 14 1
Pre-sowing tillage units 20 19 1
Subsoilers 9 9 0
Loaders 8 6 2
Manure tanks 3 1 2
Manure spreaders 3 1 2
Fertilizer spreaders 20 14 6
Sprayers 29 28 1
Seed drills 4 4 0
Beet combine harvesters 12 0 12
specialist disposing of modern machinery). The farmers reported also hiring services for processes requiring the use of stubble cultivators, subsoilers, manure spreaders or rotational plough, though these were in fact isolated cases. Those who did not dispose of necessary equipment and did not hire a specialist, relied on unpaid services from their neighbours – as many as 39% of the surveyed farmers used such neighbourly support for sowing, though usually done by means of obsolete machinery.
As described previously, the farms were usually equipped with the machinery most important for sugar beet production (pre-sowing and post-harvest tillage units, sprayers, seed drills, combine harvesters and self-unloading trailers (Šařec and Šařec 2005, Šařec, et al., 2009, Szeptycki, 2005, Zimny, 2007). However, the equipment was established to be obsolete and old (in use for more than 15 years in 37% of cases). The age structure of the machines designed strictly for sugar beet growing (seeders and harvesters) was most unfavourable – 70% of these machines were in service for 15 years and more. Unstable sugar market, spreading news on possible further reductions in sugar beet acreage and generally small size of plantations discourages the farmers from investing in new equipment.
The survey indicated that there were positive examples of applying recommended machine sets to tillage processes, though the scale of conforming to the state-of-the-art methods is still small: 38% of the farmers conducted post-harvest tillage by means of post-harvest unit, and 14% - used a reversible plough for fall ploughing.
The farms’ equipment was also analyzed according to farm size. The average total arable land area of the surveyed farms was 40.6 ha. Only 5% of the sample were farms smaller than 10 ha, and the smallest was 6.6 ha. 56.4% of the farms were of 10-30 ha of arable land area, 21.5% were between 30 and 50 ha, and only 10% were between 50 and 70 ha. Farms over 70 ha were only 7.5% of the sample. Table 5 presents the sample’s size characteristics.
Table. 5: Total arable land area of the surveyed farms
Total arable land area [ha ]
Number of farms
in the sample land area in the Average arable group[ha]
<10 10 8,2
<10-30) 123 19,5
<30-50) 47 39,4
<50-70) 22 58,8
≥70 16 195,4
even among small farmers. As might have been expected, the best tractor utilization rates are characteristic for the biggest farms.
Table.6 Number of machines/tools and their utilization rate according to the farm’s size measured by total arable land area
Type of machine
/ tool per 100 ha of arable land area Number of machines / tools Arable land area per machine/tool
Arable land
area, ha <10 <10-30)
<30-50) <50-70) ≥70 <10 <10-30) <30-50) <50-70) ≥70 Tractors total
Of which: 17.8 5.7 6.0 4.3 1.8 5.6 17.4 16.6 23.1 55.8 10,5-29 kW 5.5 1.4 1.3 0.4 0.2 18.0 70.6 80.0 263.2 641.9 30 - 54 kW 12.2 2.3 2.3 1.8 0.4 8.2 43.4 44.4 54.8 275.1 > 54 kW 0.0 2.0 2.5 2.1 1.3 - 49.5 40.0 47.0 78.6 Plougs 10.5 3.5 3.4 2.0 0.9 9.5 28.8 30.0 50.6 110.0 After-harvest
tillage units 0.0 0.9 1.6 1.3 0.4 - 112.9 63.0 77.4 226.5 Pre-sowing
tillage units 8.9 2.5 2.5 1.5 0.6 11.3 4.3 39.3 65.8 167.4 Subsoilers 0.0 0.1 0.8 0.7 0.3 - 940.8 133.1 146.2 350.1 All-purpose
cultivators 3.9 2.1 1.5 0.9 0.2 25.7 47.0 66.5 109.7 550.2 Manure
spreaders 8.3 2.7 1.8 0.5 0.1 12.0 37.1 54.4 188.0 770.3 Fertilizer
spreaders 10.0 3.0 2.5 1.7 0.6 10.0 33.2 40.0 57.2 154.1 Sprayers 10.5 2.9 2.5 1.5 0.7 9.5 34.0 38.6 65.8 142.6 Seed drills 3.3 1.3 1.7 1.3 0.5 30.0 74.3 59.9 77.4 214.0 Beet combine
harvesters 5.5 2.3 2.5 1.6 0.5 18.0 42.8 60.6 62.7 192.6 Number of sugar beet combine
harvesters per 100 ha of sugar beet plantation
Sugar beet plantation area per machine
Beet combine
harvesters 28.3 12.7 16.4 10.9 4.6 3.5 7.6 6.1 9.1 21.9
The light and medium tractors (of the powers from 10.5 to 34 kW) were most popular among the smallest farms. The most powerful tractors (over 54 kW) seemed to be valued very highly by the owners of medium-sized farms (30-50 ha) – on average, there were 2.5 such machines per 100 ha, considerably more (and of lower utilization rates) than in the case of bigger farms. The biggest farms (over 70 ha) rarely used light tractors (0.3 machines per farm, or 0.2 per 100 ha), which explains the high utilization rate figure.
rates are really low. Considering all-purpose cultivators and manure spreaders, they were very popular among smallest farms and rarely owned by the biggest.
The smallest farms were found not to own after-harvest tillage units. However, pre-sowing tillage units are their standard equipment – almost every farm up to 10 ha owns one. Utilization rates of these two machine types grew with the farm size, reaching 226.5 ha per after harvest unit and 167.4 ha per pre-sowing unit. However, farms of 10-30 ha were an exception – as the smallest farms, they were rarely equipped with after-harvest units (about 80% of them had no such machine). These rates can be compared with Lublin region’s average of 18.43 ha per pre sowing unit (Lorencowicz and Cupiał, 2012).
The number of fertilizer spreaders and sprayers per 100 ha was also the greatest in the case of small farms, and the bigger the farm, the better utilization rates: by the largest farms, the sprayer utilization rate was 142.6 ha, and the fertilizer spreader utilization rate - 154.1 ha per machine. The Lublin region’s average was,
respectively, 19.7 ha and 20.6 ha per machine (Lorencowicz and Cupiał, 2012). Similar trends can be observed in the case of seed drills, that reached the highest utilization level of 214 ha per machine in the case of the biggest farms.
The smallest farms quite often owned also beet combine harvesters, with the average area of sugar beet plantation served by one machine as low as 3.5 ha. In the case of the biggest farms, the utilization rate grew to 21.9 ha of beet plantation per machine. For comparison, the Poland’s average number of sugar beet harvesters per 100 ha of sugar beet cultivation area was 13.5 (GUS, 2011). Thus, utilization rates of sugar beet combine harvesters are generally low. Considering that single-row harvesters are most popular among these machines, and their capacity is naturally low, beet harvesting costs must be high.
In conclusion, the numbers of machines per 100 ha of arable land area generally decreased with the size of farm, and the utilization rates grew. Also the capacity of machines was bigger in the case of bigger farms. For instance, with the growing farm size, operating widths of pre-sowing units grew from 2 to 5m, the load capacity of fertilizer spreaders grew from 300 to 1500 kg, and the and the capacity of spreaders – from 350 do 2000 dm3.
CONCLUSIONS
In general, the survey revealed a gradual improvement in applying modern tools and machines, a small but noticeable trend towards replacement of obsolete equipment and a growing interest in contracting out some equipment-related operations.
A seeming self-sufficiency of sugar beet farms in terms of machinery and equipment results from their relying on old and obsolete apparatus – the basis of traditional farming methods. Usually small size of sugar beet farms speaks against investment in new, modern equipment for own use. Instead, some forms of shared use may be a good solution.
Though the average numbers of machines per 100 ha seem satisfactory, the machine utilization rates are generally low.
Many farmers rely on neighbourly help, so there is a potential on building on these tradition and creating some forms of producer groups. Though the surveyed farmers are not keen service buyers, there is a potential and sound economic justification for contracting out processes that require using modern machines. The interest in such services is growing, but it is still too small.
REFERENCES
Artyszak, A., Wyszyński, Z., (2007) Alternatywne wykorzystanie buraka cukrowego w świetle reformy rynku cukru. Wyd. Wieś Jutra, Warszawa. ISBN 83-89503-39-5
Bzowska–Bakalarz, M., Bieganowski, A.. (2008) Kodeks dobrych praktyk w produkcji buraków cukrowych. Wyd. Instytutu Agrofizyki im. Bohdana Dobrzańskiego PAN, Lublin. ISBN 978-83-89969-11-8
Bzowska-Bakalarz, M., Ostroga, K., (2010) Assesment of chances for keepping sugar beet production in Lubelskie Voivodeship. Inżynieria Rolnicza 6 (124), 5 -11.
Gorzelany, J., (2010) Koszty i energochłonność procesów produkcji buraków cukrowych. Inżynieria rolnicza. 1 (119), 191-197, ISSN 1429-7264
GUS, (2011) Raport z wyników Powszechny Spis Rolny 2010
IUNG, (2004) Program zrównoważonego rozwoju rolnictwa i obszarów wiejskich województwa lubelskiego. Tom1, Diagnoza i prognoza rozwoju, opracowanie na zlecenie Urzędu Marszałkowskiego Województwa Lubelskiego, Lublin. Maszynopis.
Lorencowicz, E., (2005) Wyposażenie techniczne i formy mechanizacji małych
gospodarstw rolnych. Wyd. AR w Lublinie, Lublin. ISSN 0860-4355
Lorencowicz, E., Cupiał, M. (2012) Ocena racjonalności doboru i wykorzystania maszyn i urządzeń rolniczych w gospodarstwach rolnych Lubelszczyzny w kontekście poprawy ich efektywności i konkurencyjności na rynku. Raport końcowy z badania dziedzinowego, Regionalny system zarządzania zmianą gospodarczą. ISBN:978-83-932866-9-0. Urząd Marszałkowski. Lublin
[Online].Available at:
http://www.lubelskie.pl/img/userfiles/files/PDF/Gospodarka/Ocena_racjonal nosci_doboru_i_wykorzystywania_maszyn_i_urzadzen_rolniczych_w_gosp odarstwach_rolnych_Lubelszczyzny_w_kontekscie_poprawy_ich_efektywn osci_i_konkurencyjnosci_na_rynku.pdf. [Accessed: 8 November 2012]. Littell, R., C., Stroup, W., W., Freund, R., J. (2009) SAS for linear models. John Wiley
& Sond, Inc. ISB,N 0-471-22174-0.
Przybył, J., Sęk, T., Kowalik, I., Dach, J. (2004) Integrowana uprawa buraka cukrowego. Journal of Research and Applications in Agricultural Engineering. Vol.49 (1). 16- 21
Stachak, S., (2006) Podstawy metodologii nauk ekonomicznych. Wyd. Książka i Wiedza, Warszawa. ISBN 83-05-13437-7
Šařec, O., Šařec, P., (2005) Různé technologie zaprocování půdy při pěstování
cukrové řepy. Listy Cukrovarnické a Řepařské 121, č. 11-12. 308 – 311.
ISSN 1210-3305.
Šařec, P., Šařec, O., Srb, K., Dobek, T., (2009) Analiza produkcji buraka cukrowego w zależności od różnych technologii przygotowania roli. Inżynieria Rolnicza. (1). 273-280.
Szeptycki, A. (2005) Ocena efektywności modernizacji technologii w produkcji roślinnej na przykładzie zbioru buraków cukrowych. Inżynieria Rolnicza (7). 323-330.
TOOSSIE, (2008) Researcg needs of the European sugar sector. Discusion paper. Raport końcowy projektu : dążenie do zrównoważonego przemysłu cukrowniczego w Europie, Available at: http://www.tossie.pw.plock.pl [Accessed 12 january 2012]
Turski, R., Uziak, S., Zawadzki, S., (2007) Środowisko przyrodnicze Lubelszczyzny, Gleby. Wyd. Lubelskie Towarzystwo Naukowe.
Wójcicki, Z., (2008) Metodyka badań postępu technologicznego w gospodarstwach rodzinnych. IBMER, Warszawa. ISBN 978-83-89806-22-3.