www.ann-geophys.net/25/59/2007/ © European Geosciences Union 2007
Annales
Geophysicae
An auroral westward flow channel (AWFC) and its relationship to
field-aligned current, ring current, and plasmapause location
determined using multiple spacecraft observations
M. L. Parkinson1, J. A. Wild2, C. L. Waters3, M. Lester4, E. A. Lucek5, and P. M. E. D´ecr´eau6 1Department of Physics, La Trobe University, Victoria 3086, Australia
2Department of Communication Systems, Lancaster University, Lancaster LA1 4WA, UK 3Department of Physics, University of Newcastle, New South Wales 2038, Australia 4Department of Physics and Astronomy, University of Leicester, Leicester LE1 7RH, UK 5Space & Atmospheric Physics, Blackett Laboratory, Imperial College, London SW7 2BZ, UK 6LPCE, CNRS et Universit´e d’Orl´eans, Orl´eans, France
Received: 12 July 2006 – Revised: 30 November 2006 – Accepted: 13 December 2006 – Published: 1 February 2007
Abstract. An auroral westward flow channel (AWFC) is a latitudinally narrow channel of unstable F-region plasma with intense westward drift in the dusk-to-midnight sector ionosphere. AWFCs tend to overlap the equatorward edge of the auroral oval, and their life cycle is often synchronised to that of substorms: they commence close to substorm expan-sion phase onset, intensify during the expanexpan-sion phase, and then decay during the recovery phase. Here we define for the first time the relationship between an AWFC, large-scale field-aligned current (FAC), the ring current, and plasma-pause location. The Tasman International Geospace Envi-ronment Radar (TIGER), a Southern Hemisphere HF Super-DARN radar, observed a jet-like AWFC during∼08:35 to 13:28 UT on 7 April 2001. The initiation of the AWFC was preceded by a band of equatorward expanding ionospheric scatter (BEES) which conveyed an intense poleward elec-tric field through the inner plasma sheet. Unlike previous AWFCs, this event was not associated with a distinct sub-storm surge; rather it occurred during an interval of per-sistent, moderate magnetic activity characterised by AL∼ −200 nT. The four Cluster spacecraft had perigees within the dusk sector plasmasphere, and their trajectories were mag-netically conjugate to the radar observations. The Waves of High frequency and Sounder for Probing Electron den-sity by Relaxation (WHISPER) instruments on board Clus-ter were used to identify the plasmapause location. The Im-ager for Magnetopause-to-Aurora Global Exploration (IM-AGE) EUV experiment also provided global-scale obser-vations of the plasmapause. The Cluster fluxgate magne-tometers (FGM) provided successive measurements specify-ing the relative location of the rspecify-ing current and filamentary Correspondence to: M. L. Parkinson
plasma sheet current. An analysis of Iridium spacecraft mag-netometer measurements provided estimates of large-scale ionospheric FAC in relation to the AWFC evolution. Peak flows in the AWFC were located close to the peak of a Region 2 downward FAC, located just poleward of the plasmapause. DMSP satellite observations confirmed the AWFC was lo-cated equatorward of the nightside plasmasheet, sometimes associated with∼10 keV ion precipitation.
Keywords. Ionosphere (Auroral ionosphere; Electric fields and currents; Ionosphere-magnetosphere interactions)
1 Introduction
boundary, a feature approximately coincident with the polar cap boundary.
The FRB is indicated, and perhaps formed by, the “subau-roral polarisation stream” (SAPS) (Foster and Burke, 2002). SAPS refers to a broad channel of moderate westward flow (∼100 to 400 m s−1) usually associated with the develop-ment of a polarisation field across the main ionospheric trough in the dusk to post-midnight sector. Because the SAPS resides on the equatorward edge of the return sun-ward flow of the dawn convection cell, the FRB can be es-pecially well defined beyond midnight. The relationship be-tween SAPS and the ring current (RC) was investigated using CRRES spacecraft measurements of electric and magnetic fields (Wygant et al., 1998; Burke et al., 1998).
Galperin et al. (1973) originally discovered polarisation jets (PJs), very narrow channels (<1 to 2◦3)of intense
west-ward plasma flow (500 m s−1to>4 km s−1)forming in prox-imity to SAPS. PJs have been referred to by various terms including sub-auroral ions drifts (SAID) (Spiro et al., 1979), substorm-associated radar auroral surges (SARAS) (Free-man et al., 1992; Shand et al., 1998), sub-auroral electric fields (SAEF) (Karlsson et al., 1998), and auroral westward flow channels (AWFC) (Parkinson et al., 2003a). The di-verse SAPS nomenclature has arisen from observations of different aspects of the same phenomena, and the important distinctions need to be reconciled.
AWFCs may represent the poleward most subset of PJ/SAIDs which emerge at substorm onset. In terms of electric fields, AWFCs are the strongest signature of sub-storms (Parkinson et al., 2006). Parkinson et al. (2003a) sug-gested AWFCs feed the development of the SAPS. Defining the relationship between AWFCs and the main population of PJ/SAIDs and SAPS occurring further equatorward will require a latitudinal chain of sub-auroral radars making con-tinuous observations throughout the entire substorm cycle. Defining this morphology is important because of its impli-cations for the development of field-aligned current (FAC) and polarisation fields within the inner magnetosphere, and energisation of the radiation belts and the RC during major storms.
Parkinson et al. (2003a) identified AWFCs with the Tas-man International Geospace Environment Radar (TIGER) (147.2◦E, 43.4◦S Geodetic; −55◦ magnetic) (Dyson and Devlin, 2000; Dyson et al., 2003, 2005) an element of the Super Dual Auroral Radar Network (SuperDARN). A de-scription of SuperDARN radar design and operation has been given by Greenwald et al. (1985, 1995). In this study, we establish the relationship between AWFC evolution and the location of large-scale ionospheric FAC, the RC, and plasma-pause location. The large-scale FAC was provided by an analysis of Iridium satellite measurements (Waters et al., 2001). The relative location of the RC and plasmapause were provided by a magnetically conjugate perigee crossing of the nightside plasmasphere by the four Cluster satellites (Escoubet et al., 1997). Observations made using the Imager
for Magnetopause-to-Aurora Global Exploration (IMAGE) spacecraft (Mende et al., 2000a, b) were also used to identify the relationship between the AWFC and plasmapause mor-phology. The polar orbiting Defence Meteorological Satel-lite Program (DMSP) satelSatel-lites also placed the AWFC in the context of auroral oval boundaries.
2 Observations and results
In this study, we concentrate on the analysis of observations made by ground-based magnetometers, a suite of spacecraft including the Cluster satellites, IMAGE, and the Iridium® constellation, and the TIGER Tasmania radar during 06:00– 14:00 UT on 7 April 2001. The second TIGER New Zealand radar did not commence operations until late 2004.
The radar measurements were mapped to altitude adjusted corrected geomagnetic (AACGM) coordinates (Baker and Wing, 1989) using the standard algorithm which assumes rectilinear radio-wave propagation to F-region backscatter locations at a virtual height of 300 km. Although the true mapping from group delay to ground range will change with propagation conditions, the standard mapping proce-dure is usually considered accurate to <0.5◦ for half-hop ionospheric scatter (Yeoman et al., 2001).
The magnetic coordinates of the low-altitude satellite mea-surements were calculated using the AACGM algorithm, but the high-altitude Cluster measurements were mapped using the Tsyganenko 96 (T96) model (Tsyganenko, 1995; Tsyga-nenko and Stern, 1996). Hence the problem of coordinate registration between these diverse data sets was minimised. 2.1 Solar wind and geomagnetic conditions
The Advanced Composition Explorer (ACE) spacecraft was located upstream in the solar wind during 7 April 2001. ACE magnetometer (Smith et al., 1998) observations of the inter-planetary magnetic field (IMF) are available online and they revealedBz had several excursions to values more negative than−6 nT during 00:00 to 07:00 UT, then theBx,ByandBz components were predominately∼+4 nT,−2 nT and−2 nT, respectively, during 07:00 to 14:00 UT. However,Bzhad sev-eral excursions to−4 nT. ACE solar wind electron proton alpha monitor (SWEPAM) (McComas et al., 1998) observa-tions showed the solar wind speed was∼440 m s−1and the dynamic pressure ∼1 nPa. However, there was significant structure in the dynamic pressure during 07:58 to 08:33 UT (this time interval is shaded in Fig. 1), including a distinct dynamic pressure pulse (DPP) from ∼0.7 to 2.1 nPa arriv-ing durarriv-ing 08:10 to 08:16 UT. The arrival time of the DPP at the magnetopause was calculated using a lag of 58.9 min estimated using the method of Khan and Cowley (1999).
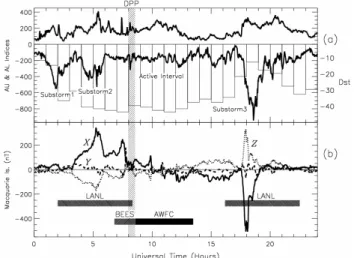
Fig. 1. (a) The AU and AL geomagnetic indices (bold curves) mea-sured during 7 April 2001. These indices are a measure of east-ward and westeast-ward current flow in the auroral ionosphere, respec-tively. TheDstindex has been superimposed in the form of a faint bar chart. (b) Perturbations of the geomagneticX(solid curve),Y (dashed curve), andZ(dotted curve) components measured by the magnetometer located on Macquarie Island (see Fig. 8). Two hor-izontal bars indicate approximate time intervals when the LANL satellites observed rapid decreases and increases in energetic parti-cle flux at geosynchronous orbit. Horizontal bars also indicate when TIGER observed a band of equatorward expanding scatter (BEES), and an auroral westward flow channel (AWFC).
substorm (2) during 03:00–06:00 UT. The recovery of the second substorm finished at 06:02 UT. An active interval with AL∼−200 nT ensued until a large, distinct −946 nT substorm (3) commenced during 17:00 UT. Variations in the
Kp index were consistent with the sequence of substorms. The first two substorms were associated with a decrease in theDst index from−10 nT at 00:00–01:00 UT to−42 nT at 07:00–08:00 UT.Dst slowly increased beyond 12:00 UT.
The Los Alamos National Laboratory (LANL) satellites are in geosynchronous, equatorial orbits of radius 6.6RE, corresponding to a magnetic latitude of ∼−66.5◦ in the radar observations. The Synchronous Orbit Particle Analyz-ers (SOPA) measured a succession of flux decreases and in-creases of outer radiation belt electrons in the energy range 50 KeV and 26 MeV associated with the three substorms. The horizontal bars in Fig. 1b indicated the approximate time intervals when major, rapid increases and decreases in ener-getic particle flux were observed. The final increase in parti-cle flux associated with the first two substorms was detected by LANL 1991-080 during 07:12 to 08:15 UT. Thereafter, the LANL satellites detected a gradual halving of the parti-cle fluxes during the radar observations of the AWFC.
A fluxgate magnetometer is located on Macquarie Is. (MQI) (−65◦ magnetic), just to the east of TIGER beam 15 (see Fig. 8). MQI magnetic perturbations provide the most direct indication of ionospheric Hall current flow in
Fig. 2. The trajectory of Cluster 1 satellite in GSM coordinates dur-ing∼09:00 to 12:00 UT on 7 April 2001.XGSMis positive toward the Sun,YGSMis positive toward magnetic dusk, andZGSMis posi-tive toward magnetic north. Cluster 1 locations are highlighted with blue dots at hourly intervals, and the relative locations of the other satellites are exaggerated by a factor of 5.
proximity to TIGER. Figure 1b is a summary plot of mag-netic perturbations in the geomagmag-neticX (North),Y (East), andZ(down) directions during 7 April. These components were de-spiked and then de-trended by subtracting a base-line defined by averaging their values over 5–9 April which included extended quiet intervals.
The AL index revealed a−529 nT substorm during 03:00– 06:00 UT. This substorm was detected as a coincident 343 nT increase in the geomagneticXcomponent by the MQI mag-netometer, indicative of an enhanced eastward electrojet in the afternoon convection cell. Figure 1b shows there was an-other increase in theXcomponent to 250 nT during 07:01 to 07:46 UT. This corresponds to an enhancement of the east-ward electrojet in the dusk convection cell. There was an-other 114-nT spike in theXcomponent at 09:52 UT.
During 05:00 to 10:00 UT, theZcomponent was initially large and negative, but gradually converged upon the same small value as theXcomponent. This suggests the eastward electrojet was located several degrees equatorward of MQI, and then gradually contracted to the latitude of MQI (−65◦). Beyond about 12:00 UT, the electrojet contracted poleward of MQI. Throughout the AWFC, the ionospheric Hall current fluctuated, but gradually became more negative, consistent with the rotation of MQI from the pre-midnight region dom-inated by the eastward electrojet toward the post-midnight region dominated by the westward electrojet.
2.2 Cluster satellite observations
The four Cluster satellites (Escoubet et al., 2001) underwent a perigee crossing of the nightside plasmasphere between
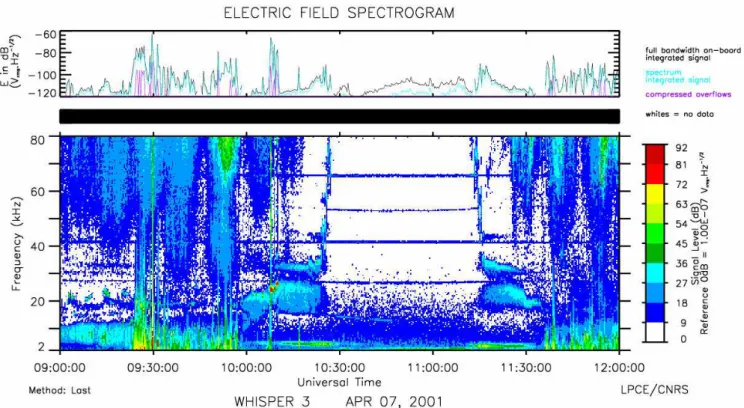
Fig. 3. Spectrogram of VLF signal strength measured by the WHISPER instrument on board the Cluster 3 satellite during∼09:00 to 12:00 UT on 7 April 2001 (bottom panel). The signal strength integrated over the full receiver bandwidth is also shown (top panel). Plasmapause crossings occurred during 10:24–10:27 UT (entry) and 11:13–11:16 UT (exit).
trajectory of the reference satellite Cluster 1 (blue dots) dur-ing∼09:00 to 12:00 UT in geocentric solar magnetospheric (GSM) coordinates. The relative location of the other Cluster satellites (colour coded) have been exaggerated by a factor of 5. Cluster 3 reached a perigee ofR∼4.0RE at∼10:42 UT when it was located atX=−3.26,Y=2.31, andZ=−0.36RE in geocentric solar ecliptic (GSE) coordinates. Near perigee, the planarity and elongation of the tetrahedron were ∼0.1 and 0.8, respectively (i.e. the four satellites were aligned like a string of beads with similar trajectories).
The magnetic field lines shown in Fig. 2 were traced using the T96 model parameterised by the lagged ACE solar wind conditions. These field lines indicate the equatorial plane of the dipole field and thus the peak ring current (RC) was encountered above theX−Y GSM plane. The ionospheric footprint of the Cluster trajectories to be shown in Fig. 8 were also calculated using T96. Cluster 3 reached a mini-mum magnetic latitude of−59.4◦and L shell of∼5 at 21:40 magnetic local time (MLT) and 10:44 UT. This corresponds to the outer plasmasphere.
The Waves of High frequency and Sounder for Prob-ing Electron density by Relaxation (WHISPER) instrument (D´ecr´eau et al., 1993, 1997) was used to identify plasma-pause locations. Trotignon et al. (2001) explains how the WHISPER measurements can be used to determine electron density, and Canu et al. (2001) discuss the natural plasma
emissions observed close to the plasmapause. WHISPER data are extremely rich and the subject of ongoing interpreta-tion, but the basic resonances observed in the ambient plasma include the plasma, electron gyro-, upper-hybrid, and Bern-stein’s mode frequencies. All of these resonances change in frequency with plasma density, except the electron gyrofre-quency and its harmonics.
Figure 3 (bottom panel) presents a frequency versus time spectrogram from the WHISPER instrument on board the Cluster 3 spacecraft showing dynamic variations in 2–80 kHz signal level during 09:00 to 12:00 UT on 7 April 2001. The almost continuous horizontal lines in the plot are resonances at the electron gyrofrequency and its harmonics. Plasma-pause (PP) crossings were identified from the start (PPs)
and finish (PPf )times of the rapid increases (decreases) in the plasma, upper-hybrid, and Bernstein’s mode frequencies during entry (exit) of the plasmasphere. These resonances become>80 kHz when Cluster was deep inside the plasma-sphere. Table 1 lists the results, two sets for each satellite, comprising plasmasphere entry and exit times. Magnetic co-ordinates in the ionosphere were estimated using T96.
Table 1. Plasmapause (PP) crossings determined using the Cluster WHISPER instrument.
Satellite PPs (Entry) PPf (Entry) PPs (Exit) PPf (Exit)
Cluster 1 10:22 UT−60.8◦, 21.8 MLT 10:26 UT−60.5◦, 21.8 MLT 11:08 UT−60.9◦, 21.5 MLT 11:13 UT−61.5◦, 21.5 MLT Cluster 2 10:26 UT−60.9◦, 21.8 MLT 10:28 UT−60.6◦, 21.7 MLT 11:14 UT−61.1◦, 21.5 MLT 11:17 UT−61.5◦, 21.5 MLT Cluster 3 10:24 UT−60.9◦, 21.8 MLT 10:27 UT−60.5◦, 21.8 MLT 11:13 UT−61.2◦, 21.5 MLT 11:16 UT−61.6◦, 21.5 MLT Cluster 4 10:27 UT−60.5◦, 21.8 MLT 10:31 UT−60.1◦, 21.8 MLT 11:16 UT−61.6◦, 21.5 MLT 11:20 UT−62.1◦, 21.5 MLT
Cluster Ion Spectrometry (CIS) instrument (R`eme et al., 1997, 2001) measured the full 3-D distribution functions of major ions from thermal energies up to ∼40 keV. During 09:30 to 12:00 UT, the CIS-COmposition and DIstribution Function analyser (CODIF) measured peak ion fluxes in the energy range∼1 keV to 10 keV in the plasma sheet-RC re-gion, with the energy spread narrowing to∼10 keV within the outer plasmasphere (L∼5). The peak ion fluxes are at higher energy than the two RC examples reported by Val-lat et al. (2005), perhaps because the satellites penetrated to
L∼4 for those events. The CIS-Hot Ion Analyser (HIA) mea-sured peak ion densities of∼110 cm−3within the outer plas-masphere (5 eV–32 keV). These data sets are not shown for brevity.
The Cluster Flux Gate Magnetometer (FGM) instruments (Balogh et al., 1997, 2001) consist of two triaxial fluxgate magnetometers on each satellite. They provide up to 67 vec-tor samples s−1 with high resolution, up to 8 pT. Vallet et al. (2005) have discussed the use of these magnetometer data and particle pressure data to calculate current densities. They demonstrated the use of the curlometer technique to estimate RC densities during Cluster perigee passes. They measured filamentary structures concentrated in the plasma sheet, but also in the RC. However, the curlometer technique assumes all four satellites lie within the same current sheet, and was not used here because of the relatively large elongation of the tetrahedron. The satellite separations were also up to
∼103km, too large for reliable curlometery.
However, Ampere’s right-hand rule for magnetic circu-lation was used to gain insights into the relative locations of FAC and the RC. First, the large-scale secular magnetic field was modelled using T96 and appropriate solar wind pa-rameters. These large-scale fields were subtracted from the FGM measurements to obtain perturbations about the model values. The amplitude of the large-scale T96 fields were
∼500 nT, whereas the FGM perturbations were only in the order of 10 nT (∼2%). Figure 4 shows the Cluster 3 FGM perturbations in the GSM coordinate system.
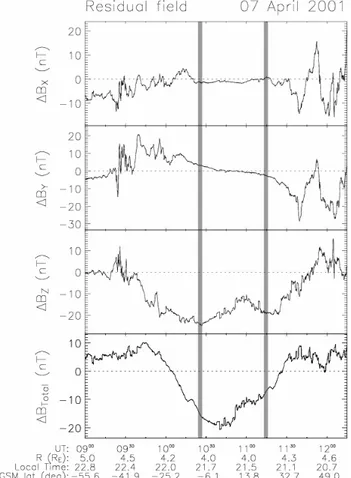
Figure 4d shows that1BTotalhad local maxima at∼09:45 and 11:40 UT, with crossings of the origin at 10:04 and 11:27 UT, outside of the WHISPER plasmasphere (Table 1). The main feature of1BTotal was a negative dip to a mini-mum value of−21 nT located at 10:40 UT, near to the time
Fig. 4. GSM magnetic field perturbations,1Bx,1By,1Bz, and 1BTotal (top to bottom) inferred using the FGM instrument on board the Cluster 3 satellite during 09:00 to 12:15 UT on 7 April 2001. The perturbations were estimated by subtracting a T96 model of the smooth, large-scale magnetic field variations. Figure 2 shows the Cluster 3 perigee was at∼10:42 UT and Fig. 3 shows there were plasmapause crossings during 10:24–10:27 UT (entry) and 11:13– 11:16 UT (exit). The plasmapause crossings have been shaded in this figure.
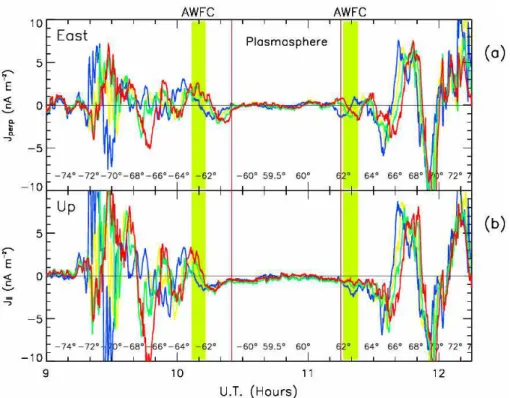
Fig. 5. Rough estimates of FAC densities obtained by applying Ampere’s law to FGM magnetic field perturbations shown in Fig. 4. The results do not allow for the oblique geometry of the orbits and are shown for all four satellites: Cluster 1 (blue), Cluster 2 (green), Cluster 3 (yellow), and Cluster 4 (red). (a) The azimuthal current estimated usingJ⊥=1Bx/ds, and (b) the FAC estimated usingJ||=1By/ds where sis spatial distance along the satellite trajectory. These results have been smoothed on a scale of∼2000 km in an attempt to recover the large-scale features.
A magnetic field model is more likely to be accurate at∼4RE than further away in the dynamic plasma sheet. Clearly, the decrease in1BTotaland1Bzindicates the T96 model overestimated the magnetic field strength within the plasmasphere. The RC flows toward the west (+Y ), and will enhance (suppress) 1Bz measured at a greater (lesser) ra-dial distance than the RC. The decreases in1BTotaland1Bz are taken to indicate a stronger RC effect than allowed for in T96. Figure 4, and similar results for the other Cluster satellites, suggest a RC enhancement was concentrated near 4.1–4.3REwith its near-Earth edge overlapping the plasma-pause located at 4.1RE.
In the case of a polar low Earth orbit (LEO) satellite traversing geomagnetic field lines orthoganol to the Earth’s surface, the presence of an infinite FAC sheet can be inferred by applying Ampere’s right-hand rule to the1By compo-nent. FAC away from the ionosphere should occur where
1By/ds>0, and FAC toward the ionosphere should occur where1By/ds<0. Heresis spatial distance along the satel-lite trajectory, increasing in the GSMZdirection. Similarly, the presence of azimuthal (zonal) field perpendicular current sheet can be inferred from the1Bxcomponent. Current flow toward the east should occur where1Bx/ds>0, and toward the west where1Bx/ds<0.
Figure 5 estimates currents in this way for all four satel-lites. The Cluster orbits were thought of as slices confined within the GSM X−Z plane to simplify the analysis, and the changing speed of the satellites along their trajectories was allowed for. However, the results are merely indicative of real FAC for the following reasons. (i) The high altitude Cluster trajectories intersect the main geomagnetic field in a different way to the geometry of LEO measurements. E.g. the magnitude of the currents near to Cluster perigees were probably greater than indicated because the satellites became parallel to the magnetic field. (ii) FACs located at 4–5RE are located above the auroral acceleration region, and thus should differ from FACs in the topside ionosphere inferred using Iridium magnetometer measurements. (iii) The FAC sheets were not infinite in extent.
of∼2000 km, to reveal any large-scale features. The strong filamentation of the currents is consistent with the multi-fractal properties of the plasma sheet (Lui, 2002). The fil-amentation of the current decreased upon entry into the RC-plasmasphere region, as found by Vallat et al. (2005).
Figure 5 suggests the AWFC (shaded) was located at the transition between a downward FAC at∼−62◦ and an up-ward FAC at∼−64◦during the inbound crossing (however, note the filamentation of the currents at this time). Figure 5 also suggests the AWFC was located at the equatorward edge of a downward current which increased in magnitude fur-ther poleward during the outbound crossing. The AWFC and Cluster measurements were made in opposite hemispheres during the outbound crossing. Figure 9 will reveal the AWFC was far more intense at the time of the inbound crossing than the outbound crossing. However, the FACs were more coher-ent and stable during the outbound crossing; hence the notion of a large-scale FAC was more meaningful. Figure 8 will show the AWFC was coincident with downward Region 2 current.
Lui et al. (2002) used a sign singularity analysis to show how the plasma sheet evolved from random-like Brown-ian motion fluctuations before substorm onset, to full-scale MHD turbulence during current disruption. Large-scale co-herent structures formed during the substorm recovery phase. In our event, the filamentation of the auroral current sheets was stronger during the inbound passes of Cluster than the outbound passes, and suggests the gradual formation of large-scale coherent structure during the declining phase of the AWFC, again suggesting an intimate relationship to sub-storm dynamics.
2.3 IMAGE EUV satellite observations
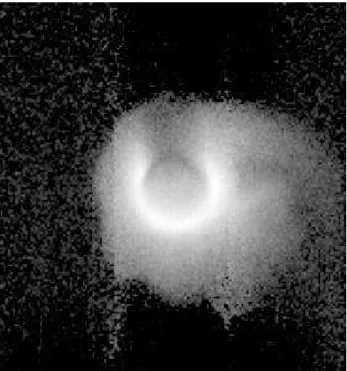
The IMAGE Extreme Ultraviolet Imager (EUV) (Sandel et al., 2000) images the distribution of He+ in Earth’s plas-masphere by detecting its resonantly-scattered emission at 30.4 nm. The plasmaspheric He+ emission brightness is directly proportional to the He+ column abundance, and thus can be used to estimate plasmapause location. Near apogee the wide field of view of the EUV imager provides global snapshots of the plasmasphere once every ten min-utes. Figure 6 is a representative EUV image recorded at 10:32 UT (centre time) on 7 April when IMAGE was lo-cated in the Northern Hemisphere at GSEX=3.53,Y=2.30, andZ=6.12RE in GSE coordinates, having passed through apogee at 8.1RE.
Sandel et al. (2001) describe the main features visible in EUV images. In Fig. 6, the Sun is located toward the bottom and the brightest ring is day glow. The Earth’s shadow points toward the top and a faint image of the auroral oval can be seen displaced toward this shadow. Dusk is toward the right and a plasmaspheric drainage plume sweeps back toward the Sun. The plasmapause associated with the drainage plume was most irregular near midnight and then became
increas-Fig. 6. IMAGE EUV image recorded at 10:32 UT (centre time) on 7 April 2001 when IMAGE was located just past apogee in the Northern Hemisphere.
ingly diffuse at earlier MLT. Other notches and shoulders are visible along the dayside plasmapause.
It will be shown that the AWFC was located in the dusk-to-midnight sector, just beyond the plasmapause associated with the drainage plume (Fig. 6, top right quadrant). The plasma-pause boundary often formed a “straight edge” extending from near midnight along the outer edge of the drainage plume. The AWFC may have been associated with this fea-ture.
The latest version of the “euv imtool” software available from the IMAGE EUV web page was used to manually scale the location of the relevant plasmapause boundary. The soft-ware calculated the minimum L shell and magnetic longitude for every mouse click. These points were then mapped to magnetic latitude in the ionosphere using the IGRF model which does not allow for the effects of external currents. However, the Cluster WHISPER plasmapause locations were mapped to the ionosphere using T96. Hence the Cluster plasmapause locations were used to correct the IMAGE EUV plasmapause locations. This involved applying a systematic
∼1◦ poleward shift to the latter. The IMAGE EUV results have been overlaid using bold black triangles in subsequent figures.
2.4 Iridium® satellite observations
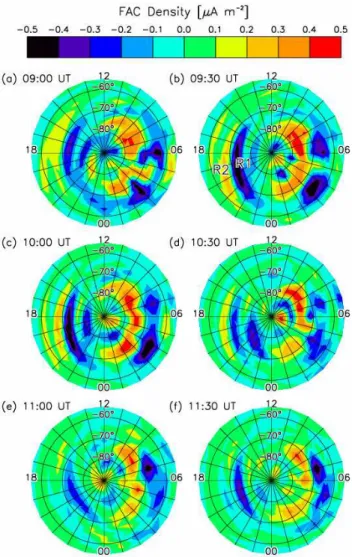
Fig. 7. Southern Hemisphere maps of FAC density calculated using Iridium satellite measurements of cross-track magnetic field pertur-bations. The calculations were made using an accumulation time of ∼1 h, and the resolution is∼4◦in latitude and∼2 h in MLT. The results are presented in the form of a 24-h clock dial plot of MLT and AACGM latitude from−50◦to the pole. The sign convention used is positive (red) for current into the ionosphere, and negative (blue) for current out of the ionosphere. The dusk sector Region 1 and 2 FACs are labelled “R1” and “R2”, respectively.
spaced planes. Iridium engineering magnetometers measure the cross-track magnetic field perturbations with sufficient sensitivity to infer large-scale ionospheric FAC. Waters et al. (2001) combined the cross-track perturbations measured by all satellites using a spherical harmonic fit, and then Am-pere’s law was used to obtain the global-scale distribution of FAC. The low sampling rate of the Iridium magnetometers mean that the magnetometer perturbations are aliased at res-olutions less than∼4◦in latitude and the samples must be accumulated for∼1 h to construct a single global-scale map. FACs are well known to evolve on time scales<1 h.
This technique was used to calculate maps of FAC for the present event. Figure 7 is a sequence of six FAC maps en-compassing the interval 08:30 to 12:00 UT during which time TIGER observed an AWFC. The time stamp “09:00 UT” actually means the FAC current map calculated using the available Iridium perturbations accumulated during 08:30 to 09:30 UT. The results are presented as a polar plot of AACGM latitude versus MLT. The sign convention used is positive (red) for current into the ionosphere, and negative (blue) for current out of the ionosphere. The colour bar means that a FAC density in the range>0.3 to 0.4µA m−2 is coloured orange and FAC greater than 0.4µA m−2 is coloured red.
At 09:30 UT, a dusk sector Region 1 current (Iijima and Potemra, 1978) was strongest (<−0.5µA m−2) between
∼15:00–23:00 MLT at∼−72◦ magnetic. This FAC swept to lower latitude at later MLT, and its intensity peaked at 09:30 UT. It was still relatively strong at 10:00 UT, but was clearly reduced in spatial extent and strength by 10:30 UT. This FAC was weakest at 11:00 UT, but intensified again at 11:30 UT. An additional upward FAC was located at
∼18 MLT and−81◦at 09:00 UT. It peaked in intensity at 10:30 UT but at lower latitude and later MLT.
The dusk sector upward Region 1 current was flanked by a weaker downward Region 2 current (<0.3µA m−2)located at∼−65◦. Like the Region 1 current, the Region 2 current also swept to lower latitude at later MLT, and it peaked at 09:30 UT. Thereafter it gradually decreased in intensity until it became very weak, <0.1µA m−2, and was replaced by regions of very weak upward current. The Region 2 current is thought to be related to closure of the partial RC, so the variations shown in Fig. 7 may be partly related to variations in the RC intensity.
The dawn sector FACs are important, but were not co-incident with the radar observations. Basically, they con-sisted of downward Region 1 currents poleward of∼−70◦
and upward Region 2 currents equatorward of∼−70◦. Like the dusk sector FACs, they were strongest at 09:30 UT, de-cayed toward a minimum at 10:30 UT, and then resurged at 11:30 UT. The dawn sector FACs tended to be more patchy, split into two or three main regions spread in lon-gitude. Localised “hot spots” of FAC occurred, for exam-ple, <−0.5µA m−2 located at ∼03:30 MLT and −64◦ at 09:30 UT.
Contours of the FAC shown in Fig. 7 will be overlaid in subsequent figures showing the HF radar observations. Keeping in mind the limited spatial and temporal resolution of the FAC maps, they suggest a relationship between the in-tensity of the dusk sector Region 2 current and the inin-tensity of the AWFC.
2.5 TIGER radar observations
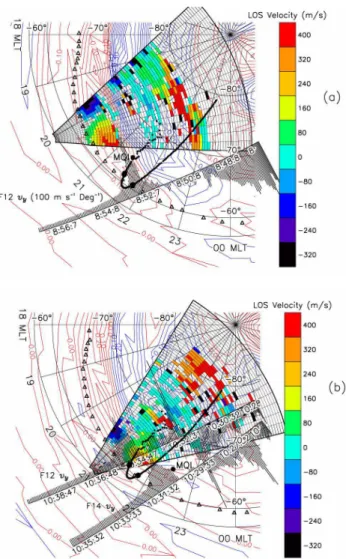
(Villain et al., 1985). Figure 8 illustrates the relationship be-tween TIGER LOS observations of an AWFC and various satellite results. The radar field of view (FoV) was mapped to a polar plot of AACGM latitude versus MLT in the dusk-to-midnight sector. The coloured pixels within the FoV rep-resent LOS Doppler velocity (vLOS)for typical 2-min full scans commencing at (a) 09:30 UT and (b) 10:30 UT on 7 April 2001. The sign convention used forvLOS is positive (red) toward the radar, and negative (black) away from the radar.
The variations in TIGER vLOS are consistent with anti-sunward flows poleward of−75◦, and an AWFC centred on
∼−63◦. That is, the low latitude scatter consisted of a patch with approachingvLOS>360 m s−1(red) on the eastern most beams, and a patch with recedingvLOS<−280 m s−1(black) on the western most beams. The convection speeds also de-creased both equatorward and poleward of the centre of the AWFC, and the AWFC tended to recede to higher latitude toward the west. Finally, the backscatter powers (irregularity intensity) were weakest on beam 5 orthogonal to the flow. All of these characteristics are the same as reported in previous studies (Parkinson et al., 2003a, 2005a).
The Special Sensor-Ions, Electrons, and Scintillation (SSIES) instruments on board the DMSP satellites provided measurements of ion drift velocity in the top side ionosphere at altitude 830 km. The velocity component transverse to the satellite trajectory,Vy, is the most reliable component. Be-cause of the finite number of spacecraft and their Sun syn-chronous orbits, a limited number of trajectories were coin-cident with the radar observations per night. A DMSP F12 pass at∼08:52 UT is superimposed in Fig. 8a, and a F14 pass at ∼10:30 UT and a F12 pass at ∼10:34 UT are su-perimposed in part (b). The 2-D circulation is not given by
Vy measurements alone, but they are consistent with an ex-tended region of anti-sunward flow across the polar cap, and return sunward flow in the dusk sector. AWFCs are struc-tures embedded within the equatorward portion of this return sunward flow. For example, the narrow spike in the F12 mea-surements (Fig. 8a) suggests the AWFC may have originated at a lower latitude at later local times.
The magnetic footprint of the Cluster 3 spacecraft is super-imposed using bold black dots. The footprints fluctuate on a time scale of 64 s because ACE solar wind measurements were used to drive the T96 model. The Cluster 3 trajec-tory advanced in time from later to earlier MLT (from right to left), reaching its lowest latitude of−59.4◦at 10:44 UT
(21:40 MLT). Recall Fig. 2 showed the Cluster spacecraft tra-versed the northern magnetosphere after perigee. Although the Cluster trajectories mapped to within the TIGER FoV, they were located to the east of beam 15 at perigee. The AWFC was decaying and relatively weak at this time.
The bold “nodules” on the Cluster footprints at latitude
∼−61◦ represent WHISPER plasmapause locations (Ta-ble 1). The nodules were caused by merging of the four, cir-cular bold dots corresponding to successive Cluster
plasma-Fig. 8. (a) TIGER radar observations of LOS Doppler velocity mea-sured during the full scan commencing at 09:30 UT on 7 April 2001. Warm, red colours represent motion toward the radar and cold, blue colours represent motion away from the radar. The relative loca-tion of Macquarie Island (MQI) and the magnetic footprint of the Cluster 3 orbit are shown (bold dots). The bold triangles represent plasmapause locations estimated using IMAGE EUV observations (cf. Fig. 6). The background contours represent the FAC density calculated using Iridium satellite measurements at 09:30 UT (cf. Fig. 7b). DMSP F12 measurements of ion drift velocity transverse to the satellite trajectory at 4-s resolution have been superimposed using a scale of 100 m s−1◦3−1. (b) The same except the TIGER observations for the full scan commencing at 10:30 UT and the FAC density calculated using Iridium satellite measurements at 10:30 UT (cf. Fig. 7d). DMSP F12 and F14 ion drift measurements have been superimposed.
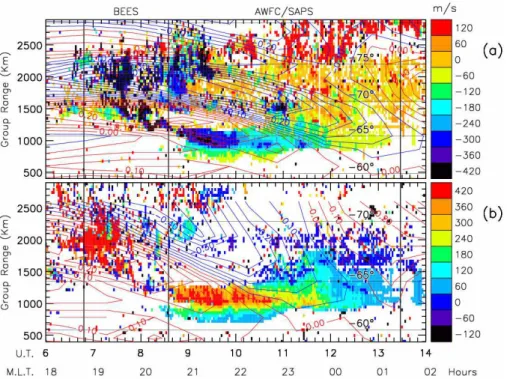
Fig. 9. (a) Range-time plot of the LOS Doppler velocity (m s−1)measured on TIGER beam 0 during 06:00–14:00 UT on 7 April 2001. Thin vertical lines delineate nominal intervals corresponding to the BEES (∼07:03–08:35 UT) and AWFC (∼08:35–13:28 UT). The background contours represent the FAC density calculated using Iridium satellite measurements at 09:30 UT (cf. Fig. 7b). The contours were shifted in time to provide a rough indication of the FAC that would be observed on beam 0. (b) The LOS Doppler velocity (m s−1)measured on the TIGER beam 15. Note that the background contours were shifted by a different amount to provide a rough indication of the FAC that would be observed on beam 15. Thin, black, horizontal lines represent magnetic latitudes, and nominal values of MLT above MQI are also given.
diffuse drainage plume illustrated in Fig. 6. It was not possi-ble to estimate the plasmapause locations at earlier MLT than shown because the drainage plume extended beyond the FoV of the EUV imaging system.
It is clear the peak AWFC flows were located∼2◦ pole-ward of the plasmapause, with the equatorpole-ward edge of the AWFC overlapping the plasmapause.
The background contours represent the FAC at (a) 09:30 UT and (b) 10:30 UT obtained using the Iridium satel-lite constellation (cf. Figs. 7b, d). The contours are sepa-rated by 0.05µA m−2 and they are coloured red (blue) for downward (upward) FAC. The Iridium-based maps of FAC used 1-h accumulation intervals, whereas the individual radar scans took 2 min. However, the basic Region 1 and Re-gion 2 current morphology persisted when the Iridium per-turbations were analysed using a shorter accumulation time of only 30 min, and the AWFC was a persistent feature across numerous full scans. It is reasonable to compare the basic large-scale phenomenology, but no doubt new physics will be revealed by improving the spatial and temporal resolution of all the data sets.
In both full scans, the AWFC occurred close to the peak Region 2 downward current of magnitude ∼0.3µA m−2, well equatorward of the peak Region 1 upward current. The latitudinal peaks of both the AWFC and the Region 2
cur-rent were centred poleward of the plasmapause. However, the equatorward decay of the AWFC and the Region 2 cur-rent overlapped the plasmapause. The plasmapause, AWFC, and Region 1 and 2 currents all receded to higher latitude at earlier MLT.
Dynamic energy spectra of precipitating ions and elec-trons determined using the DMSP SS J/4 detectors (Hardy et al., 1984) are available online. The DMSP F13 satellite traversed the austral auroral oval from 20:08 to 19:00 MLT during 10:03 to 10:07 UT. The corresponding spectrogram showed a sharp decrease in the energetic electron precipi-tation equatorward of−65◦. Newell et al. (1996) describe the algorithm used to automatically identifying various au-roral boundaries. The b2e boundary, one interpretation of the start of the plasma sheet, was located at −66.1◦ and
Fig. 10. Two-dimensional flow vectors estimated along TIGER beam 4 using the beam-swinging technique at 2-min time resolution and 0.4◦ latitude resolution during 07:00–13:00 UT on 7 April 2001. (a) The flow speed is represented using a colour scale with steps of 80 m s−1. All speeds>720 m s−1have been coloured red. (b) The flow direction is represented by a colour scale using steps of 18◦where azimuth 0◦ is toward magnetic west and azimuth 90◦is toward magnetic north (equatorward). Within the flow channel, the flows were predominately westward, though tending slightly poleward. Thin vertical lines delineate nominal intervals corresponding to the BEES (∼07:03–08:35 UT) and AWFC (∼08:35–13:28 UT). The bold triangles represent plasmapause locations estimated at the longitude of beam 4 using IMAGE EUV observations.
2.6 TIGER summary plots
Figures 9a and b are summary plots of TIGERvLOS obser-vations made during 06:00–14:00 UT on 7 April 2001. Pan-els (a) and (b) show the results for beams 0 and 15, the west-ern and eastwest-ern most beams, respectively (cf. Fig. 8). The two colour scales have been adjusted to permit direct comparison of thevLOSamplitudes. Nominal values of MLT above MQI are given beneath the UT time scale, and AACGM latitudes have been superimposed. Qualitatively, the observations re-veal a “jet-like” AWFC (Parkinson et al., 2006).
AWFCs and PJ/SAIDs have peak occurrence in the pre-midnight sector (Karlsson et al., 1998), and HF radars have preferred range windows for detecting ionospheric scatter determined by the magnetic field geometry and prevail-ing propagation conditions (Parkinson et al., 2003b). The radar operating frequency was fixed within the band 11 400– 11 650 kHz for the duration of the experiment. The AWFC was not observed within a preferred range window until
∼08:35 UT, but intense AWFCs may have been synchronised with Substorms 1 & 2, yet were not observed by TIGER be-cause they occurred too early in UT and at too low a latitude anyway.
The main feature of Fig. 9a is the channel of scat-ter with strong receding velocity, nominally commencing at 08:45 UT, peaking at ∼09:20 UT, remaining strong (<−390 m s−1) until ∼09:37 UT, and then gradually de-caying until the loss of scatter at 13:16 UT. Similarly, the main feature in Fig. 9b is the channel of scatter with strong approaching velocity, nominally commencing at 08:35 UT, peaking during ∼09:00 to 09:40 UT, remaining strong (>390 m s−1)until∼10:45 UT, and then gradually decaying until the loss of scatter at 13:28 UT. Figure 9a shows the flow channel was basically centred on∼−64◦whereas panel (b) shows the flow channel was centred on∼−63◦. The spatial orientation of the AWFC was toward slightly higher latitude at earlier MLT.
∼500 m s−1, they imply much stronger westward flow when allowing for the oblique angle between the radar beams and AWFC.
For this particular event, the equatorward limit of scatter was probably limited by the prevailing HF propagation con-ditions at 11 400–11 650 kHz. Hence decametre-scale irreg-ularities and another detached flow channel may have been detected by a hypothetical radar located further equatorward. However, the observedvLOS values decayed both poleward and equatorward of the AWFC reported here, so it was a sep-arate flow channel.
ThevLOS observations revealed another important aspect of the AWFC evolution. Figure 9 shows that commencing near to 07:01 UT, and possibly earlier, a band of ionospheric scatter with large |vLOS| oscillated in latitude, but gener-ally expanded equatorward, merging into the nominal start of the AWFC at 08:35 UT. This feature is annotated in Fig. 9 with “BEES,” a band of equatorward expanding scatter. The BEES was especially well defined on beam 0, but was ob-served on all beams, implying the feature had a zonal extent
>2 h. Qualitatively, the AWFC was a continuation of the BEES. Once formed, the centre of the AWFC continued to expand equatorward for∼1◦during the first∼40 min of the event.
The existence of a BEES and AWFC was also clear in summary plots of backscatter power, or signal-to-noise ra-tio (SNR), and Doppler spectral width (neither shown). The scatter associated with the BEES and AWFC were charac-terised by strong SNR, 30–40 dB, and low spectral width,
<60 m s−1. This contrasts with the scatter found further poleward where the SNR was predominantly <18 dB and the spectral width predominantly >75 m s−1. This sug-gests the decametre-scale ionospheric irregularities associ-ated with the BEES and AWFC were unusually intense (i.e. largeδn/n)and depending on the interpretation of the spec-tral widths, the irregularity coherence time was long, or the velocity turbulence was weak.
With reference to Fig. 1, there was a ∼126 nT surge in the geomagnetic X component during 07:01 to 07:57 UT (Fig. 1b), and there was an increase in energetic particle flux detected by LANL 1991-080 during 07:12 to 08:15 UT. The interval of DPP activity, 07:58 to 08:33 UT, may have pro-duced fluctuations in the geomagneticX,Y, andZ compo-nents (Fig. 1b), as well as oscillation in the latitude of the BEES (Fig. 9). However, DPP effects are normally transient (Thorolfsson et al., 2001), and are not considered further in this study. The interpretation of the BEES amidst this com-plex sequence of events is an ongoing investigation.
The DMSP F13 satellite traversed the austral auroral oval from 21:36 to 19:36 MLT during 08:18 to 08:23 UT. The b2e boundary was located at−64.6◦and 19:54 MLT, and the b1e boundary was located at−62.7◦and 19:42 MLT. Referring to Figs. 9 and 10, the DMSP results suggest the BEES was ex-panding equatorward through the inner plasma sheet toward the plasmatrough. The WHISPER VLF observations (Fig. 3)
suggest the separation between the auroral zone, as defined by auroral kilometric radiation and hiss, and the plasmapause was relatively small during this event.
Finally, the Iridium-based contours of FAC density for 09:30 UT (Fig. 7b) have been superimposed on the two sum-mary plots. The contours were shifted by different amounts in time for the beam 0 and 15 summary plots because the eastern most beam 15 must have observed the same spatially stationary features at an earlier time. Obviously, translating a spatial pattern of FAC recorded at a fixed UT into the tem-poral variation observed on a fixed beam rotating in MLT is erroneous. However, to first order the dominate features in the FAC were stationary and sliding a 1-h accumulation window through the Iridium data base would produce arti-ficial changes related to individual satellite passes entering and leaving the time window.
The Iridium results show that the BEES and AWFC were associated with the apparent equatorward movement of the Region 2 current, and the AWFC decayed when the Region 2 current was replaced by a weak upward current. Figure 7e confirms the Region 2 current was replaced by a weak up-ward current by∼11:00 UT.
2.7 Beam-swinging analysis
The map potential analysis (Ruohoniemi and Baker, 1998) applies spatial and temporal median filtering to the vLOS values measured by all the radars to help achieve an ac-curate representation of large-scale ionospheric convection. However, the original beam-swinging technique described by Ruohoniemi et al. (1989) preserves more of the resolution of the radar measurements and is a useful tool for studying the smaller scale flows implied by the Doppler shifts mea-sured by a single radar. Parkinson et al. (2003a) discuss how the beam-swinging analysis might underestimate the flow speeds, yet overestimate the flow channel width when it is not L-shell aligned.
Figure 10 represents the two-dimensional flow vectors es-timated using the beam-swinging technique. Panels (a) and (b) plot the flow speeds and directions, respectively, against the magnetic latitude of TIGER beam 4, the magnetic merid-ian pointing beam. The time resolution is two minutes, or one vector per full scan, and the latitude resolution is 0.4◦, corresponding to the 45-km range resolution. A flow vector was calculated on every L shell when scatter was recorded on more than five beams and solutions consistent with a cosine fit were obtained. The flow speeds were colour coded us-ing steps of 80 m s−1, with the largest speeds (>720 m s−1)
highlighted in red. Similarly, the flow directions have been colour coded using steps of 18◦where azimuth 0◦is toward
magnetic west.
west before∼09:35 UT. Thereafter they were predominantly moderate,<320 m s−1. However, several bursts of stronger anti-sunward flow commenced at latitudes poleward of−75◦
, the first starting at∼09:56 UT. These flow bursts may have been the HF radar signatures of Bursty Bulk Flows (BBFs) (Angelopoulos et al., 1992; Grocott et al., 2004).
The large westward flows associated with the BEES ex-panded equatorward from∼−69◦at 07:03 UT. Although the
BEES oscillated in latitude, it reached−65◦at∼08:35 UT,
and seemed to initiate the AWFC. The AWFC flows were especially strong, >720 m s−1, within the latitude range
−62◦to−64◦during∼08:46 to 09:44 UT. They decayed to
<520 m s−1after 10:42 UT, and to<160 m s−1by 13:08 UT. IMAGE EUV plasmapause locations were identified once every 10 min at the magnetic longitude of TIGER beam 4 and were superimposed as bold, black triangles in Fig. 10. Plasmapause locations could not be identified at times earlier than shown because the drainage plume extended beyond the FoV of the EUV imager; nor at later times than shown be-cause global-scale images were no longer available. The re-sults show the equatorward edges of the BEES and AWFC were aligned with the plasmapause boundary as the radar FoV rotated in MLT. Recall from Fig. 6 that the drainage plume extended to greater radial distance (higher latitude) at earlier MLT.
Figure 10 also demonstrates that the TIGER radar ob-served a patch of ionospheric scatter which mapped to L shells within the outer plasmasphere. This “plasmas-pheric scatter” was at the equatorward edge of the AWFC. Approaching magnetic midnight the plasmapause migrated equatorward of the region where TIGER observed F-region irregularities.
3 Summary of results
This study reports a comprehensive set of ground-based and satellite measurements to help provide insights into the re-lationship between the BEES, AWFC, plasmapause, and the Region 1 and 2 FACs, and other phenomena. We summarise the main results as follows:
1. The TIGER SuperDARN radar observed an AWFC dur-ing∼08:35 to 13:28 UT in the dusk-to-midnight sec-tor (∼19:00–23:00 MLT). A beam-swinging analysis provided estimates of the 2-D flows (Fig. 10). The AWFC flows were especially strong,>720 m s−1, dur-ing∼08:46 to 09:44 UT, and gradually decayed there-after. The AWFC flows maximised in the magnetic lat-itude range−62◦to−64◦, and were tilted slightly to-ward the pole at earlier MLT. Considerable structure existed within the AWFC, and it is likely larger veloci-ties existed beneath the pixel size of the measurements (Parkinson et al., 2003a).
2. The TIGER radar observed a BEES during∼07:03 to 08:35 UT in the dusk sector (∼16:00–19:00 MLT on beam 4). The BEES was associated with a strong pole-ward directed electric field concentrated within a narrow spatial region of 1–2◦(Fig. 9), and its equatorward ex-pansion was contiguous with the start of the AWFC. The apparent overall equatorward movement of the BEES in UT was significantly faster than that of the Region 2 FAC and the adjacent plasmapause (Fig. 10). Hence the equatorward movement was partly caused by the radar rotating in MLT about a stationary plasma trough which was located at lower latitude at later MLT (Fig. 6). How-ever, the more rapid displacements in latitude must have been caused by equatorward and poleward expansions related to ongoing substorm activity and the transient effects of the DPP (Fig. 1).
3. The AL index for 7 April 2001 indicates the observed AWFC was preceded by two large and distinct sub-storms (Substorm 1 and 2; Fig. 1a). These subsub-storms had recovered prior to the AWFC. The MQI mag-netometer observed a 250-nT positive deflection dur-ing 07:01 to 07:46 UT (Fig. 1b). The BEES com-menced during this local Hall current intensification, but it continued beyond. The BEES was more coinci-dent with LANL energetic particle activity measured at geosynchronous orbit. The AL index revealed the plan-etary conditions were moderately active (∼−200 nT) throughout the lifetime of the AWFC.
4. Cluster WHISPER-based identification of the plasma-pause indicate it was stationary to within∼1◦
through-out the lifetime of the AWFC. The WHISPER and IM-AGE EUV-based plasmapause locations indicate the peak AWFC flows were located ∼2◦ poleward of the plasmapause. However, the equatorward edge of the weaker AWFC flows overlapped the plasmapause, and the TIGER radar observed ionospheric scatter on mag-netic field lines which map to within the plasmasphere. More case studies may confirm that the equatorward limit of an AWFC defined by the equatorward edge of scatter combined with a velocity threshold is a reason-able proxy for plasmapause location.
6. Flow channels can be considered SAPS-related when they are located equatorward of the equatorward limit of significant fluxes (>106cm−2ster−1s−1)of plasma sheet electrons precipitating with energy in the order of 1 keV or more. Online DMSP SS J/4 observations of precipitating electrons (not shown) confirm that the peak of the AWFC was located equatorward of the in-ner edge of the plasma sheet. However, the poleward side of the AWFC overlapped the equatorward edge of electron precipitation, especially when the average elec-tron energy decreased in the Earthward direction. 7. A DMSP F13 satellite pass during 10:03 to 10:07 UT
revealed a nose of ∼10 keV ion precipitation extend-ing equatorward to−63.6◦. Spasojevic et al. (2004)
reported IMAGE FUV observations of detached proton arcs mapping to the plasmasphere drainage plume and possibly caused by pitch angle scattering of RC ions by electromagnetic ion cyclotron waves.
8. The Iridium-based estimates of large-scale FAC show that the peak AWFC flows were collocated near to a peak Region 2 downward FAC in the dusk-to-midnight sector. The Region 1 upward FAC was located further poleward in the main electron auroral oval. Like the EUV plasmapause boundary, the peak Region 2 current receded to higher latitude at earlier MLT. The finite lon-gitudinal extent of the Region 2 current suggests a re-lationship to partial RC closure. Within the 1-h time resolution of the FAC maps, the strength of the AWFC (Figs. 9 and 10) grew and decayed with the intensity of the afore-mentioned Region 1 and 2 currents (i.e., Fig. 7).
9. Application of Ampere’s law to the Cluster FGM mag-netic perturbations suggest the AWFC was coincident with a significant RC enhancement (Fig. 4). Moreover, derivatives of the FGM perturbations indicate that the AWFC mapped to the inner edge of intense filamen-tary current within the near-Earth plasma sheet (Fig. 5). Note that these high-altitude FACs were located above the auroral acceleration region and were probably dif-ferent to the ionospheric FAC.
4 Outstanding issues
In the accepted picture for the formation and evolution of PJ/SAIDs (e.g., see Anderson et al., 1993; De Keyser, 1999; Parkinson et al., 2003a), a downward FAC enters the iono-sphere in the region overlapping the equatorward side of the trough. Ionospheric current closure is in the form of a pole-ward Pedersen current across the main ionospheric trough. Current then leaves the ionosphere in the form of an upward FAC carried by precipitating electrons somewhere in the au-roral region poleward of the trough. A poleward directed
po-larisation electric field is focussed by electrodynamic feed-back into the main trough because of its relatively low Ped-ersen conductivity. The poleward electric field grows and saturates non-linearly as ion neutral friction further reduces the plasma density and thus Pederson conductance within the main trough.
The AWFC studied here probably mapped to the loca-tion of the main ionospheric trough centred∼2◦ poleward of the plasmapause. This is because of the accepted associa-tion, albeit complicated, between the formation of the plasma trough and main ionospheric trough (Rodger and Pinnock, 1982; Yizengaw et al. 2005). The relatively weak Hall cur-rents observed above MQI during the lifetime of the AWFC (Fig. 1b), an interval of strong ionospheric flow, suggests the ionospheric conductivity and thus plasma density were weak at this time.
Synchronicity between the intensity of the AWFC and the large-scale Region 1 and 2 dusk side currents (Fig. 7) suggests that the relevant current circuit was the downward Region 2 FAC, the poleward Pedersen current, and the up-ward Region 2 current. Closure via the zonal substorm cur-rent wedge and the meridional curcur-rent system of Kamide et al. (1994) (see Grocott et al., 2006) may also have played a role. The current circuit may also have consisted of thin FAC sheets located immediately equatorward and poleward of the AWFC, but neither the Iridium or DMSP satellite observa-tions revealed evidence for their existence.
Thin FAC structure might have been intense during the initial ∼10 min of an AWFC, and thereafter almost disap-peared because of the subsequent reduction of Pedersen con-ductance yet intensification of polarisation field across the trough. Although the DMSP magnetometer perturbations had sufficient time resolution to resolve thin FAC sheets, few coincident passes were available. Moreover, Iridium-based FAC maps were aliased at spatial scales less than 4◦in lati-tude, and thus thin FAC sheets separated by∼2◦, the width of the AWFC, might not be resolved. Small-scale FAC struc-ture might be identified using fortuitous DMSP conjunctions, or by using the proposed upgrade of the Iridium-based FAC analysis to higher spatial (∼0.25◦) and temporal (∼9 min) resolution.
growth phase signature observed in other events. Without corroborating evidence, we cannot conclude the BEES was a growth phase signature unrelated to AWFC formation.
Parkinson et al. (2002) reported TIGER observations of equatorward expanding regions of enhanced Doppler veloc-ity which decayed across the HF radar spectral width bound-ary. These features were interpreted as the signatures of mag-netic reconnection across the open-closed magmag-netic field line boundary. The corresponding 2-D flow vectors were pre-dominantly equatorward and eastward in the midnight sec-tor. Like the equatorward expanding regions of enhanced Doppler velocity shown in Fig. 10 of this paper, they may have been the ionospheric signatures of episodic BBFs (An-gelopoulos et al., 1992; Grocott et al. 2004).
Figure 7b of Parkinson et al. (2005a) showed a succes-sion of BEES-like features expanding equatorward into the region of an AWFC in the pre-midnight sector. These fea-tures represent the equatorward expansion of enhanced pole-ward electric field through the inner plasma sheet. They may also have been related to BBFs, but their continuity with the AWFC suggests another aspect of their evolution. The BEES reported in this paper was observed in the dusk sector, and its continuity in time and latitude is inconsistent with our under-standing of magnetic reconnection. It seems reasonable to conjecture the BEES represents some unexplained process feeding the AWFC region.
Parkinson et al. (2003a, 2005a) reported AWFCs that were synchronised with distinct substorms, yet the present AWFC was observed during∼08:35 to 13:28 UT, well after Sub-storms 1 and 2. Although the AL index showed sustained moderate activity (∼−200 nT) throughout the lifetime of the AWFC, the MQI magnetometer did not reveal evidence for a distinct intensification or substorm synchronised with the AWFC. In this respect, the present AWFC may have been different to the previously reported events. There is a possi-bility that AWFCs will be observed during geomagnetic quiet conditions.
Development of the RC and FAC, and any other condi-tions required for the generation of an AWFC, may have been established during the preceding substorms. Although the global substorm cycle lasts 1–2 h, the resulting energi-sation of the radiation belt and RC persists on longer time scales, as confirmed by subsequent evolution of theDst in-dex (Fig. 1a). Figure 1b also shows the LANL satellites de-tected an extended interval of energetic particle flux activity immediately preceding the AWFC. There is a possibility the AWFC development was related to prior magnetospheric ac-tivity.
The results of this study indicate that our understanding of the inter-relationship between AWFCs and the zoo of night-side phenomena and their ultimate role in cross-scale cou-pling is far from complete. The present results show that BEES are long-lived and spatially localised electric field en-hancements occurring within the dusk sector of the near-Earth plasma sheet, and they are related in some way to
AWFC dynamics. The correct physical interpretation of BEES will require analysis of new data sets with better con-tinuity and resolution in time and space. Clearly, the devel-opment and evolution of the BEES and an AWFC needs to be modelled in the context of radiation belt, RC, and FAC devel-opment driven by substorm current disruption, reconnection, and particle injection.
Acknowledgements. This work was supported by the Australian
Research Council, the Australian Antarctic Science Advisory Coun-cil, the Australian Academy of Sciences, and the TIGER Consor-tium Partners (La Trobe University, Australian Antarctic Division, DSTO Intelligence Surveillance and Reconnaissance Division, IPS Radio and Space Services, Monash University, University of New-castle). The World Data Centre for Geomagnetism, Kyoto, Japan is thanked for providing AU and AL indices. Geosciences Australia are thanked for providing MQI magnetometer data. N. Cornilleau-Wehrlin is thanked for providing Cluster STAFF measurements and H. R`eme is thanked for providing Cluster CIS measurements. B. R. Sandel is thanked for providing the IMAGE EUV data. The DMSP particle detectors were designed by D. Hardy of AFRL, and data were obtained from JHU/APL. We thank D. Hardy, F. Rich, and P. Newell for its use. M. Hairston at the Center for Space Sciences at the University of Texas at Dallas is thanked for pro-viding SSIES data. M. Lester was supported by PPARC grant PPA/G/O/2003/00013. Finally, we thank H. Ye, M. Gentile, J. De-vlin, P. Dyson, and numerous other people who contributed to the operation of TIGER.
Topical Editor M. Pinnock thanks T. Kikuchi and another ref-eree for their help in evaluating this paper.
References
Anderson, P. C., Hanson,W. B., Heelis, R. A., Craven, J. D., Baker, D. N., and Frank, L. A.: A proposed production model of rapid subauroral ion drifts and their relationship to substorm evolution, J. Geophys. Res., 98, 6069–6078, 1993.
Angelopoulos, V., Baumjohann, W., Kennel, C. F., Coroniti, F. V., Kivelson, M. G., Pellat, R., Walker, R. J., L¨uhr, H., and Paschmann, G.: Bursty bulk flows in the central plasma sheet, J. Geophys. Res., 97, 4027–4039, 1992.
Baker, K. B. and Wing, S.: A new magnetic coordinate system for conjugate studies of high latitudes, J. Geophys. Res., 94, 9139– 9143, 1989.
Balogh, A., Dunlop, M. W., Cowley, S. W. H., Southwood, D. J., Thomlinson, J. G., Glassmeier, K.-H., Musmann, G., Luhr, H., Buchert, S., Acuna, M., Fairfield, D. H., Slavin, J. A., Riedler, W., Schwingenschuh, K., and Kivelson, M. G.: The Cluster mag-netic field investigation, Space Sci. Rev., 79, 65–91, 1997. Balogh, A., Carr, C. M., Acu˜na, M. H., Dunlop, M. W., Beek, T.
J., Brown, P., Fornacon, H., Georgescu, E., Glassmeier, K.-H., Harris, J., Musmann, G., Oddy, T., and Schwingenschuh, K.: The Cluster Magnetic Field Investigation: Overview of in-flight performance and initial results, Ann. Geophys., 19, 1207–1217, 2001,
http://www.ann-geophys.net/19/1207/2001/.
T. W., and Rich, F. J.: Electrodynamics of the inner magneto-sphere observed in the dusk sector by CRRES and DMSP during the magnetic storm of June 4–6, 1991, J. Geophys. Res., 103, 29 399–29 418, 1998.
Canu, P., D´ecr´eau, P. M. E., Trotignon, J. G., Rauch, J. L., S´eran, H. C., Fergeau, P., L´evˆeque, M., Martin, Ph., Sen´e, F. X., Le Guir-riec, E., Alleyne, H., and Yearby, K.: Identification of natural plasma emissions with the Cluster – Whisper relaxation sounder, Ann. Geophys., 19, 1697–1709, 2001,
http://www.ann-geophys.net/19/1697/2001/.
Cornilleau-Wehrlin, N., Chauveau, P., Louis, S., Meyer, A., Nappa, J. M., Perraut, S., Rezeau, L., Robert, P., Roux, A., de Villedary, C., de Conchy, Y., Friel, L., Harvey, C. C., Hubert, D., Lacombe, C., Manning, R., Wouters, F., Lefeuvre, F., Parrot, M., Pinc¸on, J. L., Poirier, B., Kofman, W., and Louarn, P.: The Cluster Spatio-Temporal Analysis of Field Fluctuations (STAFF) Experiment, Space Sci. Rev., 79, 107–136, 1997.
D´ecr´eau, P. M. E., Fergeau, P., L´evˆeque, M., Martin, Ph., Ran-driamboarison, O., Sen´e, F. X., Trotignon, J. G., Canu, P., de F´eraudy, H., Bahnsen, A., Jespersen, M., M¨ogensen, P. B., Iversen, I., Dunford, C., Sumner, A., Woolliscroft, L. J. C., Gustafsson, G., and Gurnett, D. A.: “Whisper”, a sounder and High frequency wave analyser experiment, ESA SP-1159, 51– 67, 1993.
D´ecr´eau, P. M. E., Fergeau, P., Krasnoselskikh, V., L´evˆeque, M., Martin, Ph., Randriamboarison, O., Sen´e, F. X., Trotignon, J. G., Canu, P., M¨ogensen, P. B. and Whisper investigators: Whisper, a resonance sounder and wave analyser: performances and per-spectives for the Cluster mission, Space Sci. Rev., 79, 93–105, 1997.
De Keyser, J.: Formation and evolution of subauroral ion drifts in the course of a substorm, J. Geophys. Res., 104, 12 339–12 349, 1999.
Dyson, P. L. and Devlin, J. C.: The Tasman International Geospace Environment Radar, The Physicist (The Australian Institute of Physics), 37, 48–53, March/April 2000.
Dyson, P. L., Devlin, J. C., Parkinson, M. L., and Whittington, J. S.: The Tasman International Geospace Environment Radar (TIGER)–Current Development and Future Plans, IEEE Pro-ceedings of the International Conference on Radar, IEEE Cat-alogue No. 03EX695C, 282–287, 2003.
Dyson, P. L., Parkinson, M. L., Conde, M., and Devlin, J. C.: New investigations in magnetosphere-ionosphere-thermosphere pro-cesses and their impact on space weather, Proceedings, NSSA Space Science Conference, Melbourne, 13–15 September 2005. Escoubet, C. P., Fehringer, M., and Goldstein, M.: The Cluster
Mis-sion, Ann. Geophys., 19, 1197–1200, 2001, http://www.ann-geophys.net/19/1197/2001/.
Fejer, B. G.: The electrodynamics of the low-latitude ionosphere: recent results and future challenges, J. Atmos. Solar-Terr. Phys., 59, 1465–1482, 1997.
Foster, J. C. and Burke, W. J.: SAPS, A new categorization for sub-auroral electric fields, EOS, Tranactions, American Geophysical Union, 83(36), 393–394, 2002.
Freeman, M. P., Southwood, D. J., Lester, M., Yeoman, T. K., and Reeves, G. D.: Substorm-associated radar auroral surges, J. Geo-phys. Res., 97, 12 173–12 185, 1992.
Galperin, Y. I., Ponomarev, V. N., and Zosimova, A. G.: Direct mea-surements of ion drift velocity in the upper ionosphere during a
magnetic storm, 2. Results of measurements during the Novem-ber 3, 1967, magnetic storm, Cosmic Res. (Russian), 11, 283– 292, 1973.
Goldstein, J., Burch, J. L., and Sandel, B. R.: Magnetospheric model of subauroral polarization stream. J. Geophys. Res., 110, A09222, doi:10.1029/2005JA011135, 2005.
Goldstein, J., Sandel, B. R., Hairston, M. R., and Reiff, P. H.: Control of plasmaspheric dynamics by both convection and sub-auroral polarization stream, Geophys. Res. Lett., 30(24), 2243, doi:10.1029/2003GL018390, 2003
Goldstein, J., Burch, J. L., Sandel, B. R., Mende, S. B., Brandt, R. C., and Hairston, M. R.: Coupled response of the inner magneto-sphere and ionomagneto-sphere on 17 April 2002, J. Geophys. Res., 110, A03205, doi:10.1029/2004JA010712, 2005.
Greenwald, R. A., Baker, K. B., Hutchins, R. A., and Hanuise, C.: An HF phased-array radar for studying small-scale structure in the high-latitude ionosphere, Radio Sci., 20, 63–79, 1985. Greenwald, R. A., Baker, K. B., Dudeney, J. R., et al.:
DARN/SuperDARN: A global view of the dynamics of high-latitude convection, Space Sci. Rev., 71, 761–796, 1995. Grocott, A., Yeoman, T. K., Nakamura, R., Cowley, S. W. H., R`eme,
H., and Klecker, B.: Multi-instrument observations of the iono-spheric counterpart to a bursty bulk flow in the near-Earth plasma sheet, Ann. Geophys., 22, 1061–1075, 2004,
http://www.ann-geophys.net/22/1061/2004/.
Grocott, A., Lester, M., Parkinson, M. L., Yeoman, T. K., Dyson, P. L., Devlin, J. C., and Frey, H. U.: Towards a synthesis of sub-storm electrodynamics: HF radar and auroral observations, Ann. Geophys., 24, 3365–3381, 2006,
http://www.ann-geophys.net/24/3365/2006/.
Horvath, I. and Essex, E. A.: Using observations from the GPS and TOPEX satellites to investigate night-time TEC enhancements at mid-latitudes in the southern hemisphere during a low sunspot number period, J. Atmos. Solar-Terr. Phys., 62, 371–391, 2000. Huang, C.-S., Foster, J. C., and Holt, J. M.: Westward plasma drift
in the midlatitude ionospheric F region in the midnight-dawn sec-tor, J. Geophys. Res., 106, 30 349–30 362, 2001.
Iijima, T. and Potemra, T. A.: Large-scale characteristics of field-aligned currents associated with substorms, J. Geophys. Res., 83, 599–615, 1978.
Kamide, Y., Richmond, A. D., Emery, B. A., et al.: Ground-based studies of ionospheric convection associated with substorm ex-pansion, J. Geophys. Res., 99, 19 451–19 466, 1998.
Karlsson, T., Marklund, G. T., and Blomberg, L. G.: Subauroral electric fields observed by the Freja satellite: A statistical study, J. Geophys. Res., 103, 4327–4341, 1998.
Kelley, M. C., Fejer, B. G., and Gonzales, C. A.: An explanation for anomalous equatorial ionospheric electric fields associated with a northward turning of the interplanetary magnetic field, Geo-phys. Res. Lett., 6, 301–304, 1979.
Khan, H. and Cowley, S. W. H.: Observations of the response time of high-latitude ionospheric convection to variations in the in-terplanetary magnetic field using EISCAT and IMP-8 data, Ann. Geophys., 17, 1306–1355, 1999,
http://www.ann-geophys.net/17/1306/1999/.
Lui, A. T. Y.: Multiscale phenomena in the near-Earth magneto-sphere, J. Atmos. Solar-Terr. Phys., 64, 125–143, 2002. McComas, D. J., Bame, S. J., Barker, P., Feldman, W. C., Phillips,