Different Mode of Afferents Determines the
Frequency Range of High Frequency
Activities in the Human Brain: Direct
Electrocorticographic Comparison between
Peripheral Nerve and Direct Cortical
Stimulation
Katsuya Kobayashi1, Riki Matsumoto2*, Masao Matsuhashi3, Kiyohide Usami1, Akihiro Shimotake1, Takeharu Kunieda4, Takayuki Kikuchi4, Nobuhiro Mikuni5, Susumu Miyamoto4, Hidenao Fukuyama3, Ryosuke Takahashi1, Akio Ikeda2*
1Department of Neurology, Kyoto University Graduate School of Medicine, Kyoto, Japan,2Department of Epilepsy, Movement Disorders and Physiology, Kyoto University Graduate School of Medicine, Kyoto, Japan,3Human Brain Research Center, Kyoto University Graduate School of Medicine, Kyoto, Japan,
4Department of Neurosurgery, Kyoto University Graduate School of Medicine, Kyoto, Japan,5Department of Neurosurgery, Sapporo Medical University School of Medicine, Sapporo, Hokkaido, Japan
*[email protected](RM);[email protected](AI)
Abstract
Physiological high frequency activities (HFA) are related to various brain functions. Factors, however, regulating its frequency have not been well elucidated in humans. To validate the hypothesis that different propagation modes (thalamo-cortical vs. cortico-coritcal projec-tions), or different terminal layers (layer IV vs. layer II/III) affect its frequency, we, in the pri-mary somatosensory cortex (SI), compared HFAs induced by median nerve stimulation with those induced by electrical stimulation of the cortex connecting to SI. We employed 6 patients who underwent chronic subdural electrode implantation for presurgical evaluation. We evaluated the HFA power values in reference to the baseline overriding N20 (earliest cortical response) and N80 (late response) of somatosensory evoked potentials (HFASEP (N20)and HFASEP(N80)) and compared those overriding N1 and N2 (first and second
responses) of cortico-cortical evoked potentials (HFACCEP(N1)and HFACCEP(N2)). HFASEP (N20)showed the power peak in the frequency above 200 Hz, while HFACCEP(N1)had its
power peak in the frequency below 200 Hz. Different propagation modes and/or different terminal layers seemed to determine HFA frequency. Since HFACCEP(N1)and HFA induced
during various brain functions share a similar broadband profile of the power spectrum, cor-tico-coritcal horizontal propagation seems to represent common mode of neural transmis-sion for processing these functions.
OPEN ACCESS
Citation:Kobayashi K, Matsumoto R, Matsuhashi M, Usami K, Shimotake A, Kunieda T, et al. (2015) Different Mode of Afferents Determines the Frequency Range of High Frequency Activities in the Human Brain: Direct Electrocorticographic Comparison between Peripheral Nerve and Direct Cortical Stimulation. PLoS ONE 10(6): e0130461. doi:10.1371/journal.pone.0130461
Academic Editor:Yoko Hoshi, Medical Photonics Research Center. Hamamatsu University School of Medicine, JAPAN
Received:February 21, 2015
Accepted:May 20, 2015
Published:June 18, 2015
Copyright:© 2015 Kobayashi et al. This is an open access article distributed under the terms of the
Creative Commons Attribution License, which permits unrestricted use, distribution, and reproduction in any medium, provided the original author and source are credited.
Data Availability Statement:All relevant data are within the paper and its Supporting Information files.
Introduction
In the last decade, advancement in technology has made it possible to analyze ultra slow or high frequency activities (HFAs), or high frequency oscillations (HFOs) in the human brain. Neuronal functional networks show the broadband oscillatory activities ranging from 0.01 Hz to 600 Hz or above. In particular, neuronal activities above the conventional gamma range are reported to be specific to the each content of neuronal functional activities in both physiologi-cal and pathologiphysiologi-cal neuronal processes [1–3].
Physiologically, gamma oscillations, in particular, those above 60 Hz (60–200 Hz) are closely associated with brain functions such as motor [1,4–6], language [7–8], attention [9], auditory [10–11], and visual [12] functions. Neuronal activities of the conventional‘ narrow-band’gamma (below 60–80 Hz) have been reported to originate from neuronal synchroniza-tion mainly by inhibitory interneuron networks [13–15], and those of‘broadband’high gamma (80–200 Hz) have been reported to reflect increase of the multiunit activities or local field potentials [16–18].
Much before the discovery of high gamma activities related with various brain functions, faster activity around 600 Hz was discovered and intensively investigated in somatosensory function by recording somatosensory evoked potentials (SEPs) [19–29]. This activity was dif-ferent from the aforementioned activities in that it is an evoked activity that overrides the early cortical component (N20) of median nerve SEP. The generator of HFOs or HFAs of SEP (HFASEP) has been proposed at various locations: the terminal segments of the thalamocortical
fibers [30], the primary somatosensory cortex (SI) close to the generator of SEP N20 [31], GABAergic inhibitory fast-spiking interneurons at SI [26], and subcortical neurons [32]. Among them, the main generator has been proposed at or around SI from findings obtained by direct electrocorticographic recording. HFASEPseems to play an important role in sensory
information processing, and their impairment is reported in patients with multiple sclerosis, migraine and epilepsy [33–36].
The pathological high frequency oscillations (HFOs) or HFAs have been recently explored in the field of epilepsy, and nowadays are regarded as one of the possible biomarkers of epilep-togenicity [37–39]. Pathological HFAs are generally divided into ripples between 100 and 200 Hz and fast ripples more than 250 Hz [2]. The generator of pathological HFAs, especially fast ripples, is presumably single or recurrent population spikes that reflect summated hypersyn-chronized discharges of principal cells [40–41].
Besides intrinsic physiological or pathological HFAs, external stimulation can generate cor-tical HFAs. In addition to the peripheral nerve stimulation that generates HFASEP, direct
elec-trical cortical stimulation can produce HFOs. Elecelec-trical stimulation of the piriform cortex produced oscillatory gamma responses (50–60 Hz) mainly at the layer Ia (superficial layer) in normal rats [42]. Moreover a recent study has shown that pathological HFAs could reliably be produced by electrical microstimulation of the hippocampus in the tetanus toxin-induced epi-leptic rats and normal rats [43].
Although the mechanisms how HFAs are generated have been studied bothin vivo and vitroin animals [44–45], factors regulating the frequency of physiological (60–200 Hz for cognitive HFA, ~600 Hz for HFASEP) and pathological (epileptic: 80–500 Hz) HFAs have not
been well elucidated in humans. We focused on the SI cortex to investigate factors regulating physiological HFAs since HFASEP(~600 Hz) has been extensively studied in humans. We
hypothesized that different modes of propagation, vertical (thalamo-cortical) vs. horizontal (cortico-cortical) projections, or different terminal layers, i.e., layer IV vs. layer II/III affect the frequency of physiological HFAs. We compared HFAs in SI triggered by median nerve stimula-tion with those elicited by single pulse electrical cortical stimulastimula-tion (SPES). Cortico-cortical Research (B)26293209 from the Japan Ministry of
Education, Culture, Sports, Science and Technology (MEXT) (http://www.jsps.go.jp/j-grantsinaid/) to AI. The funders had no role in study design, data collection and analysis, decision to publish, or preparation of the manuscript.
evoked potentials (CCEPs) have been widely used to evaluate the cortical evoked response to SPES [46]. CCEPs are recorded from the adjacent and remote cortices by averaging electrocor-ticograms (ECoGs) time-locked to the single pulse stimuli. CCEPs usually consist of an early negative component (N1) and a late negative component (N2). This method has been used for investigating cortico-cortical connections involved in functional brain systems [46–54] or sei-zure networks [55–56]. In the present study, by applying SPES to the cortex connecting to SI, we focused on the HFAs overriding CCEP N1 and N2 components in the SI cortex and com-pared their feature with HFASEP. In the present study, we adopted the terminology of“HFAs”
for all the high frequency activities although“HFOs”have been used in the previous studies of the high frequency activities overriding SEPs. This is because we do not only focus on the‘ nar-rowband’high frequency activities showing discrete oscillatory activities but also the‘ broad-band’activities.
Materials and Methods
Patients
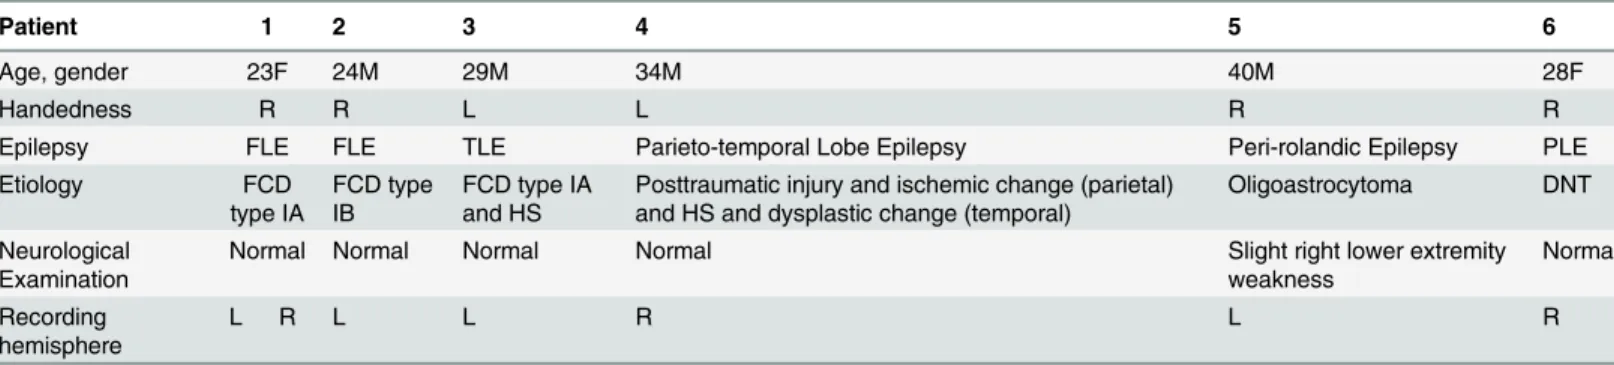
Six patients (2 female), 4 with medically intractable partial epilepsy and 2 with brain tumor were studied (Table 1). All underwent chronic subdural electrode implantation covering the peri-rolandic area for the presurgical evaluation. In all but patient 5, the epileptic foci were away from the peri-rolandic area. In patient 5, although the lesion (brain tumor) was in the peri-rolandic area, the hand SI was located outside the lesion. Because of the ill-defined ictal onset in the scalp EEG and normal MRI findings, patient 1 underwent electrode implantation twice: the first implantation in the bilateral hemispheres to lateralize the seizure onset, and the second one in the right hemisphere to localize the epileptic focus. Therefore we measured SEPs and CCEPs in 7 hemispheres from 6 patient, i.e., 2 hemispheres from patient 1—patient 1L and patient 1R. Neurological examination was normal except patient 5 who showed slight paresis in the right lower extremity. The implanted electrodes were made of platinum with a recording diameter of 2.3 mm and a center-to-center interelectrode distance of 1 cm (Ad-Tech, Rachine, WI, USA) or with a recording diameter of 3 mm and a center-to-center interelectrode distance of 1 cm (Unique Medical Co., Ltd., Tokyo, Japan). As a part of the clinical presurgical evaluation, high frequency (50 Hz) electrical stimulation was performed for functional cortical mapping. Cortical mapping of the peri-rolandic area was performed in patients 3–6. To define the exact location of each electrode on the brain, subdural electrodes were co-registered to
Table 1. Patient profile.
Patient 1 2 3 4 5 6
Age, gender 23F 24M 29M 34M 40M 28F
Handedness R R L L R R
Epilepsy FLE FLE TLE Parieto-temporal Lobe Epilepsy Peri-rolandic Epilepsy PLE
Etiology FCD
type IA
FCD type IB
FCD type IA and HS
Posttraumatic injury and ischemic change (parietal) and HS and dysplastic change (temporal)
Oligoastrocytoma DNT
Neurological Examination
Normal Normal Normal Normal Slight right lower extremity
weakness
Normal
Recording hemisphere
L R L L R L R
FLE = frontal lobe epilepsy, TLE = temporal lobe epilepsy, PLE = parietal lobe epilepsy, FCD = focal cortical dysplasia, HS = hippocampal sclerosis, DNT = dysembryoplastic neuroepithelial tumor
three dimensional volume-rendered MRIs, which were reconstructed from MPRAGE taken while electrodes were in place. The location of each electrode was identified on the 2D-MRI by using its signal void due to the property of the platinum alloy. The methodological details have been described elsewhere [46,57]. The central sulcus (CS) and its relationship to the electrodes were also identified by anatomical landmarks on the 3D-MRI.
The present study was approved by the Ethics Committee of Kyoto University Graduate School of Medicine (No. 443). Written informed consent was obtained from all patients.
Data Acquisition of SEPs
Electrocorticograms (ECoGs) were recorded with a bandpass filter of 0.016–600 Hz and a sam-pling rate of 2,000 Hz in all patients (EEG-1100, Nihon Kohden, Tokyo, Japan) and analyzed off-line using Matlab software (Matlab version 7.12.0; the MathWorks Inc., MA). Cortical recordings from subdural electrodes were referenced to a scalp electrode placed on the skin over the mastoid process contralateral (patient 1R and 2–6) or ipsilateral (patient 1L) to the side of electrode implantation.
The median nerve contralateral to the side of electrode implantation was stimulated at the wrist (a square wave pulse of 0.3 ms duration at 0.3 Hz) (Electrical Stimulator SEN-7203, Nihon Kohden, Tokyo, Japan). The stimulus intensity was adjusted to 20% above the motor threshold. In all the patiens, SEPs were recorded before tapering the antiepileptic drugs in the first week of chronic electrode implantation. During recording, the patients were lying on the bed and requested not to perform any specific task under awake condition. At least 2 trials of 150 sweeps were averaged to confirm the reproducibility of responses. SEPs were obtained by off-line averaging ECoGs time-locked to the stimulus onset with a time window of 1,000 ms (from 300 ms before to 700 ms after the stimulus onset). The baseline was set for the first 200 ms: from 300 ms to 100 ms before the stimulus onset.
Data Acquisition of CCEPs
The methodological details of CCEPs have been described elsewhere [46,49]. In brief, electrical stimulation was applied in a bipolar manner to a pair of adjacently placed subdural electrodes by a constant-current stimulator (MEE-1232, Nihon Kohden, Tokyo, Japan). The single pulse electrical stimuli (a square wave pulse of 0.3 ms duration) were delivered in alternating polarity at a fixed frequency of 1 Hz. In the previous CCEP study, the CCEP consisted of an early (N1) and a late (N2) negative potentials, and the latencies of N1 and N2 usually ranged 10–50 ms and 100–200 ms, respectively. The stimulus intensity was set at 6–12 mA after confirming the absence of afterdischarges (ADs) and excessive artifacts that obscured the CCEP waveform.
ECoGs were recorded with a bandpass filter of 0.08–600 Hz. The sampling rate and refer-ence electrode setting were the same as those for SEPs. During the recording of CCEPs, the patients were lying on the bed and requested not to perform any specific task under awake con-dition. In all the patients, CCEPs were recorded in the second week after returning the dosage of antiepileptic drugs. At least 2 trials of 30–50 responses each were averaged to confirm the reproducibility of responses. CCEPs were obtained off-line by averaging ECoGs time-locked to the stimulus onset. The time window (1,000 ms) and baseline (200 ms) was set as the same as those of SEPs. The method has been reported elsewhere in detail [46,58].
Definition of the Primary Sensory Cortex (SI) and Selection of CCEPs in
the hand SI
confirmed the location of the hand SI electrodes on the postcentral gyrus anatomically by the 3D-MRI in all patients. The epileptic focus was away from the hand SI in all patients. No patients showed interictal epileptic spikes at the hand SI electrode.
We usually perform SPES to most of the implanted electrodes in order to investigate the cortico-cortical connections involved in seizure propagation and brain functions for clinical purposes. For this particular study, we selected the stimulus sites (electrode pairs) that pro-duced large outstanding CCEP waveforms at the hand SI electrode in each patient. The subse-quent time frequency analysis was performed for the ECoG data for each CCEP stimulus site. In other words, when the robust CCEP waveform was recorded in the hand SI from more than 1 stimulus site (e.g., 2 stimulus sites) in 1 patient, the time frequency analysis was performed for each stimulus site separately.
Time Frequency Analysis
A time-frequency representation was built for each epoch of raw ECoG data recorded during SEP and CCEP recording by using the short-time Fourier Transform (STFT). The epoch dura-tion was the same as that used for SEP and CCEP analyses, i.e., from 300 ms before to 700 ms after the stimulus onset. The analysis frequency range was 0–600 Hz. The Fourier Transform was performed on 25 data-point window (12.5 ms; frequency resolution 80 Hz) at each time-step. The step of the sliding window was set at 5 ms; in other words, 1 time bin was with width of 5 ms centered at 2.5 ms. A Hanning window was imposed on each window to attenuate edge effects.
With the current amplifier (EEG-1100, Nihon Kohden, Tokyo, Japan), the stimulus artifact lasts up to 3–4 ms from the stimulus onset. A preliminary CCEP latency analysis revealed that N1 peaked between 7–27 ms at the SI electrode. In order to differentiate the stimulus artifact from the N1 potential for the STFT anlaysis, we selected the short window size of 25 points (12.5 ms) and sacrificed the frequency resolution to 80 Hz. When we analyze the high fre-quency activities, it is important to distinguish the evoked response that is time-locked and locked to the stimulation from the induced response that is time-locked, but not phase-locked. Induced (non-phase-locked) responses are analyzed by subtracting event-related potential from the raw ECoG signal in each individual trial to minimize the contribution of evoked (phase-locked) responses [59]. In this study, our aim was to analyze neuronal activities induced by external stimulation upon individual trial basis. Therefore, in contrast to the most of the previous somatosensory evoked HFA studies, we adopted induced HFA responses for SEPs in the same condition as those of CCEPs.
After the STFT, we averaged the power spectrum across all the epochs. The logarithmic power spectrum (base 10) was computed for the given frequency range and window. The base-line for computation was set to the same as that for averaging SEP and CCEP: from 300 ms to 100 ms before the stimulus onset. We refer to the stimulus-locked induced HFA for SEP data as“HFASEP”and that for CCEP data as“HFACCEP”herein for clarity. For HFACCEPanalysis,
we focused on the induced HFA overriding the early N1 potential (HFACCEP(N1)) and the
fol-lowing N2 potential (HFACCEP(N2)). Since the N1 is regarded as the first volley reaching the
tar-get cortex [49,51,60], HFA overriding N20 (HFASEP(N20)) was analyzed as an N1 counterpart.
HFA overriding N80 (HFASEP(N80)), a late cortical component subsequent to the early cortical
component, was also analyzed since the peak latency was closest to that of N2. As for HFAs on the early potentials (HFASEP(N20), HFACCEP(N1)), the power changes were calculated for 1 time
bin that included the peak of SEP N20 or CCEP N1. We carefully selected a bin after 15 ms for evaluating HFACCEP(N1)and HFASEP(N20)so that the 25 data-point (12.5 ms) window did not
on these rare occasions. We selected 4 bins (mean of 20 ms bin at and around the peak) for cal-culating the power spectra of CCEP N2 and SEP N80. We confirmed the validity of the usage of the bin after 15 ms for evaluating HFACCEP(N1)and HFASEP(N20), namely, that the 25
data-point (12.5 ms) window did not overlap with the stimulus artifact, by performing an additional stimulus artifact analysis using the dead pig brain (seeS1 TextandS1 Fig).
Since most of the aforementioned induced HFA activities were within 200 ms from the stimulus onset, we displayed the STFT results across the whole time points and frequencies in 3 dimensions (time, frequency, and power value) in a time window of 220 ms (from 20 ms before to 200 ms after the stimulus onset) in figures (Figs1B,2B,3A and 3B).
In order to compare the power trend across the frequency bands among HFASEP(N20),
HFA-SEP(N80), HFACCEP(N1), and HFACCEP(N2), we also drew additional figures plotting the change of
the logarithmic power spectra across the frequency bands at the timing of N1 and N2 of CCEP and N20 and N80 of SEP. In each patient, we analyzed the power values for frequency bands centered at 80, 160, 240, 320, 400, 480, and 560 Hz for the 4 groups (HFASEP(N20), HFASEP(N80),
HFACCEP(N1), HFACCEP(N2)). After the plot was made for each patient (seeFig 3G, 3H, 3I and
3J), all the power values from 7 hemispheres in 6 patients (N = 7 for HFASEP(N20)and HFASEP
(N80), N = 16 for HFACCEP(N1)and HFACCEP(N2)) were plotted in the same figure (seeFig 4).
Fig 1. SEPs and HFAsSEPrecorded from the peri-rolandic area and 3D-MRI (patient 1, left hemisphere).A: SEPs to right median nerve stimulation are
plotted with subaverages (black and grey waveforms) across the CS identified on 3D-MRI (in a representative case). The vertical line corresponds to the time of median nerve stimulation (a white arrowhead). N20 component showing the maximum amplitude is identified on the primary somatosensory cortex (SI) (a black arrowhead). B: Time-frequency representation of SEP to right median nerve stimulation (HFASEP) by using the short-time Fourier Transform is shown
across the CS. The frequency range is from 40 to 600 Hz. The vertical line corresponds to the time of median nerve stimulation (a white arrowhead). The averaged logarithmic power spectrum in reference to the baseline is calculated. Increase of power is indicated in red and decrease in blue. C: On 3D-MRI, subdural electrodes are plotted as white circles. A hand SI electrode is plotted as a white circle with a cross. Only electrodes at and around the hand SI and stimulus electrodes are shown in the figure. Since most of the induced high frequency activities were within 200 ms from the stimulus onset, we displayed the STFT results across the whole time points and frequencies in 3 dimensions (time, frequency, and power value) in a time window of 220 ms (from 20 ms before to 200 ms after the stimulus onset). SEP, somatosensory evoked potential; HFA, high frequency activity; CS, central sulcus.
Statistical Analysis
The statistical analyses were performed by using the logarithmic power values of each SEP and CCEP responses (7 responses for HFASEP(N20)and HFASEP(N80), and 16 responses for HFA
C-CEP(N1)and HFACCEP(N2)). In this study we aimed to investigate whether there are differences
of the distributions of logarithmic power spectra between the 4 groups. Repeated measures analysis of variance (RM-ANOVA) was adopted for the statistical investigation of the interac-tions with the power values in each frequency band as a within-group factor and with the afore-mentioned 4 groups [HFASEP(N20), HFASEP(N80), HFACCEP(N1), and HFACCEP(N2)] as a
between-group factor. As a post hoc analysis, we focused on the 4 comparisons between the groups: HFASEP(N20)and HFACCEP(N1), HFASEP(N80)and HFACCEP(N2), HFASEP(N20)and
HFA-SEP(N80), and HFACCEP(N1)and HFACCEP(N2).
Results
Distribution of evoked responses and HFAs
Stimulation of the median nerve contralateral to the recording hemisphere elicited SEPs on the electrodes around the central sulcus (CS). As shown in the 3D-MRI of the representative case (patient 1L,Fig 1A), all the hand SI electrodes with the largest N20 were located on the post-central gyrus. As for the power spectra, HFAsSEPwere recognized at and around the hand SI
electrode (Fig 1B). The distribution of SEPs (N20 and N80) well corresponded to that of
HFAs-SEP(Fig 1C) in all patients. Regarding distribution of CCEPs and HFAsCCEP, robust CCEP
Fig 2. CCEPs and HFAsCCEPrecorded from the peri-rolandic area and 3D-MRI (patient 1, left hemisphere).A: Single pulse stimulation was applied to
the electrodes on the precentral gyrus and CCEPs were recorded time-locked to the stimuli (in a representative case). Two subaverages (black and grey waveforms) are shown. The vertical line corresponds to the time of single pulse stimulation (white arrowhead). B: Time-frequency representation of CCEP (HFACCEP) by using the short-time Fourier Transform. C: Electrodes on 3D-MRI. CCEP = cortico-cortical evoked potential. Other conventions are the same
as forFig 1.
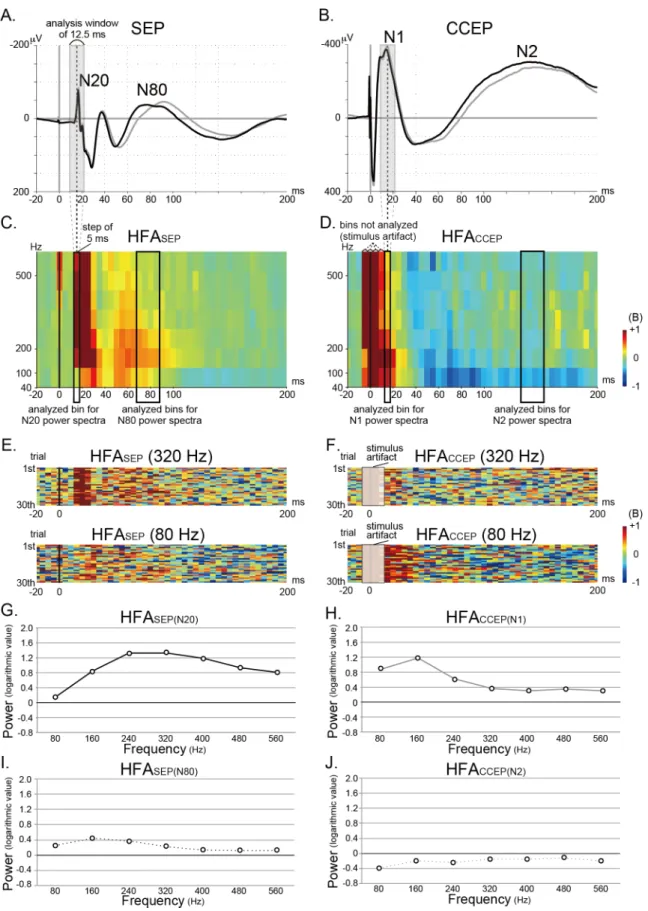
Fig 3. SEP, CCEP, HFASEP, and HFACCEPat SI (patient 1, left hemisphere).A-D: SEP (A), CCEP (B), HFASEP(C), and HFACCEP(D) recorded from the
responses (N1 and N2) and induced HFAsCCEPwere recorded at the hand SI electrode by
stim-ulating 16 stimulus sites (1–3 stimulus sites per patient: 1 site in patient 3, 2 sites in patient 1 (L), 1(R), and 6, and 3 sites in patient 2, 4, and 5) (see patient 1L,Fig 2A and 2Bfor example).
Comparison between HFA
SEPand HFA
CCEPFig 3shows an example of comparison between SEP/HFASEPand CCEP/HFACCEPat the hand
SI electrode. HFASEPand HFACCEPwere shown with the three dimensional scales along the
time window of 220 ms (Fig 3C and 3D). The row traces of HFASEPand HFACCEPfor the
fre-quency bands centered at 80 and 320 Hz, at which the HFASEPand HFACCEPpresented the
dif-ferent power trend, are shown (Fig 3E and 3F). The power changes at the N20/N1 and N80/N2 peaks were then plotted in the two dimensional scale to show the distribution of the power change across the frequency bands (Fig 3G, 3H, 3I and 3J). The frequency band showing the maximal power change differed between HFASEP(N20)and HFACCEP(N1), HFASEP(N20)and
HFASEP(N80), HFACCEP(N1)and HFACCEP(N2), and HFASEP(N80)and HFACCEP(N2)in this
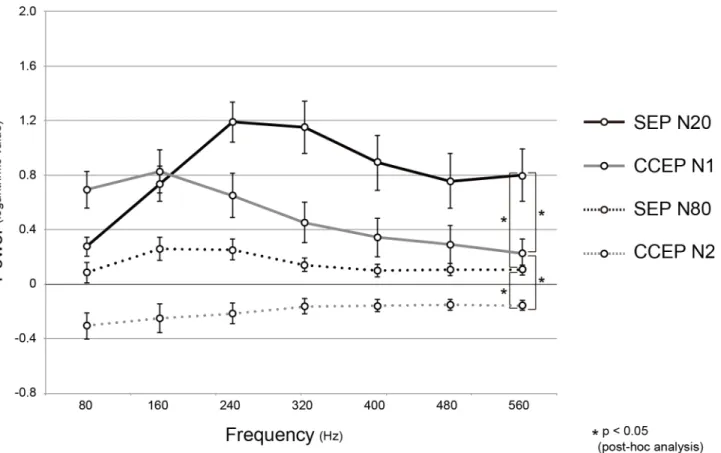
repre-sentative case (patient 1L). In order to compare the distribution of the power change between HFASEPand HFACCEPacross patients, the mean and standard error of the logarithmic power
values of all the responses are plotted across the frequency band for HFASEP(N20), HFASEP(N80),
HFACCEP(N1), and HFACCEP(N2)(Fig 4). It showed a tendency that over 200 Hz, the HFASEP
(N20)power increased while HFACCEP(N1)power decreased. RM-ANOVA showed statistically
significant interactions between the 4 groups (F(3,6) = 14.468, p<0.05). A post-hoc analysis
showed significant interactions between HFASEP(N20)and HFACCEP(N1)(F(1,6) = 19.409,
p<0.05), HFASEP(N20)and HFASEP(N80)(F(1,6) = 9.280, p<0.05), HFACCEP(N1)and HFA
C-CEP(N2)(F(1,6) = 22.494, p<0.05), and HFASEP(N80)and HFACCEP(N2)(F(1,6) = 4.097,
p<0.05). In other words, the distributions of power values differed between the 2 early
com-ponents (CCEP N1 vs. SEP N20), as well as the 2 late comcom-ponents (CCEP N2 vs. SEP N80), and also between the early and late components of SEPs or CCEPs (SEP N1 vs. N2, CCEP N1 vs. N2).
Discussion
By applying SPES both to the peripheral nerve and directly to the cortex, we compared the HFAs overriding SEPs and CCEPs in the SI cortex. Stimulus-triggered HFAs behaved differ-ently in terms of power distribution. As for the early components, HFASEP(N20)power
increased more in the frequency band above 200 Hz while HFACCEP(N1)in the band below 200
Hz. As for the late components, statistically significant difference was also observed for the dis-tributions of power spectra between HFASEP(N80)and HFACCEP(N2). Both HFASEPand HFA
C-CEPshowed different power distributions between early and late components. The present
findings indicated that the human sensory cortex could produce different HFA profiles upon the different modes of input.
the 12.5 ms analysis-window. For example, the 5 ms-time bin centered at 15 ms (highlighted by a black rectangle in C and D) corresponds to the results of 12.5 ms analysis-window (from 9 ms to 21.5 ms, centered at 15 ms; see shaded gray rectangle in A and B). The stimulus artifacts in CCEP last up to 3–4 ms
from the stimulus onset. Therefore, the bins centered at -5, 0, 5, and 10 ms potentially include the stimulus artifacts and they are not analyzed. Because we put the transistor-transistor logic (TTL) pulse from the electric stimulator into the DC input of the EEG machine, and offline triggered the stimulus onset using a certain threshold with a Matlab-script, the trigger timing could have jitter within the sampling point, namely, 0.5 ms. This jitter is reflected in the
representative CCEP waveform (B). As for the induced activities, the 5 ms time bins centered at -5 and 0 ms, which correspond to the results of 12.5 ms window centered at -5 and 0 ms, could include the stimulus artifact (D). E, F: The row traces (30 trials) of HFASEP(E) and HFACCEP(F) for the frequency
bands centered at 80 and 320 Hz are shown. G-J: The power changes of HFASEP(N20), HFACCEP(N1), HFASEP(N80), and HFACCEP(N2)in reference to the
baseline activity for each frequency band (every 80 Hz, centered at 80, 160, 240, 320, 400, 480, and 560 Hz) are plotted (G, H, I, and J).
Stimulus induced early HFAs
As for the gamma activities recorded with macroelectrodes, Ray et al., by using a macaque monkey model, showed that the high gamma activity sensitively increased both in association with neuronal synchrony and firing rate [16]. In this regard, we think the HFA or‘broadband’ gamma profiles were determined by neuronal synchrony and firing rate induced by the 2 modes of input in the present study. The HFAs were overriding or associated with either SEPs or CCEPs. SEPs are evoked through vertical, ascending projection fibers from the thalamus to the SI cortex, and CCEPs are evoked through horizontal association or commissural fibers based on the previous reports [51,60]. It is, therefore, plausible to ascribe the different gamma profiles between the early HFA components, HFASEP(N20)and HFACCEP(N1), to the different
modes of impulse transmission through vertical projection vs. horizontal association/commis-sural fibers. The difference, then, could be explained by the different layer input from these 2 afferent fibers. Association and commissural fibers originate from the layer II and III and ter-minate mainly in the same layers elsewhere in the neocortex [61], while projection fibers from the thalamic relay (specific) nuclei, e.g. ventral posterolateral (VPL) in case of median nerve stimulation, terminate mainly in a rich arborization within the layer IV [62]. In this sense, it is indicated that different input modes played an important role in subsequent neuronal process-ing in terms of frequency tunprocess-ing: neuronal synchrony in the high gamma range in case of hori-zontal transmission (HFACCEP(N1)<200 Hz) vs. above the high gamma range in case of
vertical transmission (HFASEP(N20)>200 Hz). Several animal studies have indeed revealed that
Fig 4. The distributions of logarithmic power values in reference to the baseline in each frequency band.As for the 4 groups, HFASEP(N20)(a black
solid line), HFACCEP(N1)(a grey solid line), HFASEP(N80)(a black dashed line) and HFACCEP(N2)(a grey dashed line), all the power values of 7 hemispheres are
averaged (mean±SE). RM-ANOVA showed statistically significant interactions between the 4 groups. An asterisk indicates significant interaction between the 2 groups in the post-hoc analysis. Other conventions are the same as forFig 3.
frequency tuning (alpha, beta and gamma) for neural information processing differs according to the cortical layers, while that of faster activities above the conventional gamma range has not been well elucidated [45,63–68]. Since SI has the most developed layer IV in the neocortex, the inputs to the layer IV from the specific nuclei of the thalamus might give rise to neuronal syn-chrony in the higher frequency range than those to the layer II/III. A possible key player of the synchronization above 200 Hz is at least the fast-spiking interneuron which could produce the high frequency activities ranging 300–500 Hz [69–70]. In summary, different frequency pro-files between HFASEP(N20)and HFACCEP(N1)is most likely due to the different propagation
modes (vertical vs. horizontal), namely, the different terminal layers (layer IV vs. II/III) where afferent inputs arrive within SI. The layer IV contains the fast-spiking interneurons more than the layer II/III in SI. We speculate that the difference of the distribution of the fast-spiking interneurons may partly determine the most prominent frequency band of somatosensory and cortico-cortical HFAs in SI.
Another possible explanation is the influence of temporal jitters.‘Direct cortical response (DCR)’in the vicinity of the site of direct cortical stimulation has been extensively studied in various species [71–73]. Simultaneous surface and intracellular recording in animals revealed that the first negative components of DCR reflect oligosynaptic events in the local cortical cir-cuits [46,74–75]. This local jitter of synaptic activity at the site of stimulation and at the target cortex in CCEPs might create the lesser synchronization as compared with the relatively syn-chronized disynaptic activities observed in SEPs.
The HFACCEP(N1)has a frequency profile similar to HFA induced during various cognitive
tasks (‘cognitive HFA’). Cognitive HFAs have been reported to show a broadband shape in the power spectrum, which is probably organized by multiunit activities and/or local field poten-tials [16–17] or summation of membrane potential oscillations with different center frequen-cies [76]. Taking account of the similar frequency profile, cortico-cortical connections is highly likely to represent common mode of neuronal transmissions for various brain functions although the interaction to the‘centrencephalic’area would also influence the brain functions.
Stimulus induced late HFAs
The frequency profile was also different between the late components, HFASEP(N80)and HFA
C-CEP(N2). Both SEP N80 and CCEP N2 have been considered to be late cortical components,
although it is still not clear what they exactly reflect. One possible explanation for different fre-quency profiles in late HFAs is that the different stimulus types, a physiological stimulus through the peripheral nerve stimulation and a non-physiological stimulus directly applied to the cortex, could produce different intracortical neural processing in SI. In contrast to HFASEP
(N80)that had increased power in reference to the baseline activity, HFACCEP(N2)showed a
decline of the power value. This tendency is similar to the postspike depression seen in the spikes abnormally or non-physiologically produced by the epileptic focus [77–79]. It has been considered that this postspike depression reflects the decreased cortical excitability after parox-ysmal depolarization shifts for epileptic spikes. In addition, by using an SPES technique similar to our CCEP method and recording multiunit activities, Alarcon et al. (2012) revealed that neural responses induced by SPES consist of brief synchronized burst firing and subsequent long suppression [80]. Therefore CCEP N2 could reflect an inhibitory process after the excita-tion reflected in N1 and HFACCEP(N1). This might be an essential compensatory function of the
patients’age and the maturity of brain, or the phase of CCEP N2 response (peak vs. descending slope) when HFAs were observed. In our study, the bins centered at 80 Hz showed a tendency of the relative power decrease compared with the bins centered at 160 Hz, especially HFAs for CCEP. This is explained by the possibility that the frequency range centered at 80 Hz is mostly controlled by the inhibitory interneurons.
Clinical implications and limitations
Since this study was performed in patients with epilepsy or brain tumor, we should discuss whether we recorded pathological or physiological HFAs. In all patients, no epileptic HFAs or epileptic spikes were observed at the hand SI electrode. Together with the normal SEP configu-ration at and around the SI electrode, we considered the HFASEPand HFACCEPobserved in the
hand SI as physiological.
Pathological HFAs in the frequency range of ripple (100–200 Hz) and fast ripple (250- Hz) have recently attached considerable attention as a possible surrogate marker of epileptogeni-city. By measuring the amplitude, CCEPs have been used for evaluating epileptogenicity or cor-tical excitability at and around the focus [55–56,82]. In this study we demonstrated the power increase (HFACCEP(N1)) and decrease (HFACCEP(N2)) were associated with CCEPs in the
nor-mally functioning SI. Besides the amplitude, the HFA correlates of CCEPs, namely HFACCEP
(N1)and HFACCEP(N2), could also be clinically useful to evaluate the degree of abnormally
enhanced cortical excitability and also surround inhibition at and around the epileptic focus, respectively.
There are several limitations in this study. First, the STFT analysis period was set after 15 ms in order to avoid the possible involvement of stimulus artifacts in the analysis. Therefore, some HFAsCCEPat the time range of 0 to 10 ms, such as HFACCEPoverriding CCEP first volley
or P1, which is the very first response reported in CCEP studies [60,83], could not be evaluated in this study. The relatively short analysis window (12.5 ms) and resultant broad frequency bin (80 Hz) did not allow us to analyze lower frequencies such as the beta or low gamma (below 40 Hz) band in the present study. Viswanathan et al. (2007) and Ray et al. (2008) reported that high-gamma (60–90 or 60–200 Hz) power could be a neural correlate of synchronized output of the cortex, while low-gamma (25–60 or 40–80 Hz) power could be a correlate of synchro-nized input to the cortex [16,84]. In this study, we mainly dealt with the activities of high-gamma range that reflects spike synchronization due to the 80 Hz frequency resolution. There-fore, our study suggests that the different propagation modes caused the frequency difference (HFAsSEPvs. HFAsCCEP) within high-gamma range. Although the difference of low-gamma
performed on the same day in each patient, the amount of antiepileptic medication was almost the same between the 2 recordings. We, therefore, think that antiepileptic drugs hardly influ-enced the comparison between HFASEPand HFACCEP. Fourth, we investigated the SI cortex
since we could record and compare stimulus induced HFAs in response to both physiological (median nerve stimulation) vertical and non-physiological (direct electrical cortical stimula-tion) horizontal inputs. It is technically difficult to perform a similar study in the association cortex, but we assume the findings in SI could be applicable to the neocortex in general. Lastly, the sampling rate (2,000 Hz) and filter setting (0.016–600 Hz) prevented us to evaluate the HFA over 600 Hz. Our objective was to compare behaviors of the HFA involved in physiologi-cal and epileptic broadband gamma range, and we successfully demonstrated different behav-iors in this frequency range for HFAsCCEPand HFAsSEP. Future studies sacrificing the number
of electrodes to increase the sampling rate would warrant investigation of higher HFA which was out of scope in the present study.
Supporting Information
S1 Text. Additional Data for Time Frequency Analysis. (DOC)
S1 Fig. CCEPs and HFAsCCEPin an additional study to validate the influence of the stimu-lus artifacts.A: A configuration of grid electrodes placed on each hemisphere of a dead brain of a pig. Shaded circles indicate 2 stimulated pairs of electrodes. B: CCEPs recorded time-locked to the single pulse stimulation applied to the electrodes labeled as“1”in S1A Fig. Two subaverages (black and grey waveforms) are shown. We displayed in a time window of 220 ms (from 20 ms before to 200 ms after the stimulus onset) in the same way as the original Figs1–3. The vertical line corresponds to the time of single pulse stimulation (white arrowhead). C: A CCEP response recorded from the electrode adjacent to the stimulus sites (dotted square). D: Time-frequency representation of CCEP (HFACCEP) by using the short-time Fourier
Trans-form. The frequency range is from 40 to 600 Hz. The vertical line corresponds to the time of single pulse stimulation (a white arrowhead). The averaged logarithmic power spectrum in ref-erence to the baseline is calculated. Increase of power is indicated in red and decrease in blue. E: An HFACCEPrecorded from the same electrode as S1C Fig. In this particular example, the
stimulus artifact, indicated in dark red suggestive of extraordinary power increase, affected the time bin centered at 5 ms and did not affect the bins centered at 10 ms and 15 ms. In case of stimulation of another pair of electrodes (labeled as“2”in S1A Fig), the stimulus artifact never influenced to the bin centered at 15 ms.
(TIF)
Author Contributions
Conceived and designed the experiments: KK RM MM AI. Performed the experiments: KK RM KU AS. Analyzed the data: KK RM. Contributed reagents/materials/analysis tools: T. Kunieda T. Kikuchi NM SM HF. Wrote the paper: KK RM MM AI. Coordinated and directed the project: RM RT AI.
References
1. Crone NE, Miglioretti DL, Gordon B, Lesser RP. Functional mapping of human sensorimotor cortex with electrocorticographic spectral analysis. II. Event-related synchronization in the gamma band. Brain. 1998; 121: 2301–2315. PMID:9874481
3. Bragin A, Engel J Jr., Wilson CL, Fried I, Mathern GW. Hippocampal and entorhinal cortex high-fre-quency oscillations (100–500 Hz) in human epileptic brain and in kainic acid-treated rats with chronic
seizures. Epilepsia. 1999; 40: 127–137. PMID:9952257
4. Ohara S, Ikeda A, Kunieda T, Yazawa S, Baba K, Nagamine T, et al. Movement-related change of elec-trocorticographic activity in human supplementary motor area proper. Brain. 2000; 123: 1203–1215.
PMID:10825358
5. Miller KJ, Leuthardt EC, Schalk G, Rao RP, Anderson NR, Moran DW, et al. Spectral changes in corti-cal surface potentials during motor movement. J Neurosci. 2007; 27: 2424–2432. PMID:17329441 6. Miller KJ, Zanos S, Fetz EE, den Nijs M, Ojemann JG. Decoupling the cortical power spectrum reveals
real-time representation of individual finger movements in humans. J Neurosci. 2009; 29: 3132–3137.
doi:10.1523/JNEUROSCI.5506-08.2009PMID:19279250
7. Sinai A, Bowers CW, Crainiceanu CM, Boatman D, Gordon B, Lesser RP, et al. Electrocorticographic high gamma activity versus electrical cortical stimulation mapping of naming. Brain. 2005; 128: 1556–
1570. PMID:15817517
8. Tanji K, Suzuki K, Delorme A, Shamoto H, Nakasato N. High-frequency gamma-band activity in the basal temporal cortex during picture-naming and lexical-decision tasks. J Neurosci. 2005; 25: 3287–
3293. PMID:15800183
9. Ray S, Niebur E, Hsiao SS, Sinai A, Crone NE. High-frequency gamma activity (80–150Hz) is
increased in human cortex during selective attention. Clin Neurophysiol. 2008; 119: 116–133. PMID:
18037343
10. Edwards E, Soltani M, Deouell LY, Berger MS, Knight RT. High gamma activity in response to deviant auditory stimuli recorded directly from human cortex. J Neurophysiol. 2005; 94: 4269–4280. PMID:
16093343
11. Sinai A, Crone NE, Wied HM, Franaszczuk PJ, Miglioretti D, Boatman-Reich D. Intracranial mapping of auditory perception: event-related responses and electrocortical stimulation. Clin Neurophysiol. 2009; 120: 140–149. doi:10.1016/j.clinph.2008.10.152PMID:19070540
12. Tallon-Baudry C, Bertrand O, Henaff MA, Isnard J, Fischer C. Attention modulates gamma-band oscil-lations differently in the human lateral occipital cortex and fusiform gyrus. Cereb Cortex. 2005; 15: 654–
662. PMID:15371290
13. Brunel N, Wang XJ. What determines the frequency of fast network oscillations with irregular neural dis-charges? I. Synaptic dynamics and excitation-inhibition balance. J Neurophysiol. 2003; 90: 415–430.
PMID:12611969
14. Mann EO, Radcliffe CA, Paulsen O. Hippocampal gamma-frequency oscillations: from interneurones to pyramidal cells, and back. J Physiol. 2005; 562: 55–63. PMID:15539391
15. Bartos M, Vida I, Jonas P. Synaptic mechanisms of synchronized gamma oscillations in inhibitory inter-neuron networks. Nat Rev Neurosci. 2007; 8: 45–56. PMID:17180162
16. Ray S, Crone NE, Niebur E, Franaszczuk PJ, Hsiao SS. Neural correlates of high-gamma oscillations (60–200 Hz) in macaque local field potentials and their potential implications in electrocorticography. J
Neurosci. 2008; 28: 11526–11536. doi:10.1523/JNEUROSCI.2848-08.2008PMID:18987189 17. Miller KJ. Broadband spectral change: evidence for a macroscale correlate of population firing rate? J
Neurosci. 2010; 30: 6477–6479. doi:10.1523/JNEUROSCI.6401-09.2010PMID:20463210
18. Hermes D, Miller KJ, Wandell BA, Winawer J. Stimulus Dependence of Gamma Oscillations in Human Visual Cortex. Cereb Cortex. 2015; 36: 1–15.
19. Cracco RQ, Cracco JB. Somatosensory evoked potential in man: far field potentials. Electroencepha-logr Clin Neurophysiol. 1976; 41: 460–466. PMID:61849
20. Abbruzzese M, Favale E, Leandri M, Ratto S. New subcortical components of the cerebral somatosen-sory evoked potential in man. Acta Neurol Scand. 1978; 58: 325–332. PMID:742350
21. Eisen A, Roberts K, Low M, Hoirch M, Lawrence P. Questions regarding the sequential neural genera-tor theory of the somatosensory evoked potential raised by digital filtering. Electroencephalogr Clin Neurophysiol. 1984; 59: 388–395. PMID:6205866
22. Emerson RG, Sgro JA, Pedley TA, Hauser WA. State-dependent changes in the N20 component of the median nerve somatosensory evoked potential. Neurology. 1988; 38: 64–68. PMID:3336466 23. Yamada T, Kameyama S, Fuchigami Y, Nakazumi Y, Dickins QS, Kimura J. Changes of short latency
somatosensory evoked potential in sleep. Electroencephalogr Clin Neurophysiol. 1988; 70: 126–136.
PMID:2456191
25. Curio G, Mackert BM, Burghoff M, Koetitz R, Abraham-Fuchs K, Harer W. Localization of evoked neuro-magnetic 600 Hz activity in the cerebral somatosensory system. Electroencephalogr Clin Neurophysiol. 1994; 91: 483–487. PMID:7529687
26. Hashimoto I, Mashiko T, Imada T. Somatic evoked high-frequency magnetic oscillations reflect activity of inhibitory interneurons in the human somatosensory cortex. Electroencephalogr Clin Neurophysiol. 1996; 100: 189–203. PMID:8681860
27. Sonoo M, Genba-Shimizu K, Mannen T, Shimizu T. Detailed analysis of the latencies of median nerve somatosensory evoked potential components, 2: Analysis of subcomponents of the P13/14 and N20 potentials. Electroencephalogr Clin Neurophysiol. 1997; 104: 296–311. PMID:9246067
28. Ozaki I, Suzuki C, Yaegashi Y, Baba M, Matsunaga M, Hashimoto I. High frequency oscillations in early cortical somatosensory evoked potentials. Electroencephalogr Clin Neurophysiol. 1998; 108: 536–542. PMID:9872424
29. Curio G. Linking 600-Hz "spikelike" EEG/MEG wavelets ("sigma-bursts") to cellular substrates: con-cepts and caveats. J Clin Neurophysiol. 2000; 17: 377–396. PMID:11012041
30. Ikeda H, Leyba L, Bartolo A, Wang Y, Okada YC. Synchronized spikes of thalamocortical axonal termi-nals and cortical neurons are detectable outside the pig brain with MEG. J Neurophysiol. 2002; 87: 626–630. PMID:11784777
31. Curio G, Mackert BM, Burghoff M, Neumann J, Nolte G, Scherg M, et al. Somatotopic source arrange-ment of 600 Hz oscillatory magnetic fields at the human primary somatosensory hand cortex. Neurosci Lett. 1997; 234: 131–134. PMID:9364515
32. Gobbele R, Waberski TD, Simon H, Peters E, Klostermann F, Curio G, et al. Different origins of low-and high-frequency components (600 Hz) of human somatosensory evoked potentials. Clin Neurophy-siol. 2004; 115: 927–937. PMID:15003775
33. Gobbele R, Waberski TD, Dieckhofer A, Kawohl W, Klostermann F, Curio G, et al. Patterns of disturbed impulse propagation in multiple sclerosis identified by low and high frequency somatosensory evoked potential components. J Clin Neurophysiol. 2003; 20: 283–290. PMID:14530742
34. Coppola G, Vandenheede M, Di Clemente L, Ambrosini A, Fumal A, De Pasqua V, et al. Somatosen-sory evoked high-frequency oscillations reflecting thalamo-cortical activity are decreased in migraine patients between attacks. Brain. 2005; 128: 98–103. PMID:15563513
35. Restuccia D, Valeriani M, Della Marca G. Giant subcortical high-frequency SEPs in idiopathic general-ized epilepsy: a protective mechanism against seizures? Clin Neurophysiol. 2007; 118: 60–68. PMID:
17097917
36. Ozaki I, Hashimoto I. Exploring the physiology and function of high-frequency oscillations (HFOs) from the somatosensory cortex. Clin Neurophysiol. 2011; 122: 1908–1923. doi:10.1016/j.clinph.2011.05.
023PMID:21724458
37. Urrestarazu E, Chander R, Dubeau F, Gotman J. Interictal high-frequency oscillations (100–500 Hz) in
the intracerebral EEG of epileptic patients. Brain. 2007; 130: 2354–2366. PMID:17626037 38. Zijlmans M, Jacobs J, Zelmann R, Dubeau F, Gotman J. High-frequency oscillations mirror disease
activity in patients with epilepsy. Neurology. 2009; 72: 979–986. doi:10.1212/01.wnl.0000344402.
20334.81PMID:19289737
39. Jacobs J, Zijlmans M, Zelmann R, Chatillon CE, Hall J, Olivier A, et al. High-frequency electroencepha-lographic oscillations correlate with outcome of epilepsy surgery. Ann Neurol. 2010; 67: 209–220. doi:
10.1002/ana.21847PMID:20225281
40. Bragin A, Wilson CL, Engel J Jr. Voltage depth profiles of high-frequency oscillations after kainic acid-induced status epilepticus. Epilepsia 48 Suppl. 2007; 5: 35–40.
41. Bragin A, Benassi SK, Kheiri F, Engel J Jr. Further evidence that pathologic high-frequency oscillations are bursts of population spikes derived from recordings of identified cells in dentate gyrus. Epilepsia. 2011; 52: 45–52. doi:10.1111/j.1528-1167.2011.03235.xPMID:21967361
42. Ketchum KL, Haberly LB. Synaptic events that generate fast oscillations in piriform cortex. J Neurosci. 1993; 13: 3980–3985. PMID:8366356
43. Rolston JD, Laxpati NG, Gutekunst CA, Potter SM, Gross RE. Spontaneous and evoked high-fre-quency oscillations in the tetanus toxin model of epilepsy. Epilepsia. 2010; 51: 2289–2296. doi:10.
1111/j.1528-1167.2010.02753.xPMID:20946126
44. Le Van Quyen M, Bragin A, Staba R, Crepon B, Wilson CL, Engel J Jr. Cell type-specific firing during ripple oscillations in the hippocampal formation of humans. J Neurosci. 2008; 28: 6104–6110. doi:10.
1523/JNEUROSCI.0437-08.2008PMID:18550752
46. Matsumoto R, Nair DR, LaPresto E, Najm I, Bingaman W, Shibasaki H, et al. Functional connectivity in the human language system: a cortico-cortical evoked potential study. Brain. 2004; 127: 2316–2330.
PMID:15269116
47. Greenlee JD, Oya H, Kawasaki H, Volkov IO, Severson MA 3rd, Howard MA 3rd, et al. Functional con-nections within the human inferior frontal gyrus. J Comp Neurol. 2007; 503: 550–559. PMID:17534935 48. Lacruz ME, Garcia Seoane JJ, Valentin A, Selway R, Alarcon G. Frontal and temporal functional
con-nections of the living human brain. Eur J Neurosci. 2007; 26: 1357–1370. PMID:17767512
49. Matsumoto R, Nair DR, LaPresto E, Bingaman W, Shibasaki H, Luders HO. Functional connectivity in human cortical motor system: a cortico-cortical evoked potential study. Brain. 2007; 130: 181–197.
PMID:17046857
50. Matsumoto R, Imamura H, Inouchi M, Nakagawa T, Yokoyama Y, Matsuhashi M, et al. Left anterior temporal cortex actively engages in speech perception: A direct cortical stimulation study. Neuropsy-chologia. 2011; 49: 1350–1354. doi:10.1016/j.neuropsychologia.2011.01.023PMID:21251921 51. Matsumoto R, Nair DR, Ikeda A, Fumuro T, Lapresto E, Mikuni N, et al. Parieto-frontal network in
humans studied by cortico-cortical evoked potential. Hum Brain Mapp. 2012; 33: 2856–2872. doi:10.
1002/hbm.21407PMID:21928311
52. Swann NC, Cai W, Conner CR, Pieters TA, Claffey MP, George JS, et al. Roles for the pre-supplemen-tary motor area and the right inferior frontal gyrus in stopping action: electrophysiological responses and functional and structural connectivity. Neuroimage. 2012; 59: 2860–2870. doi:10.1016/j.
neuroimage.2011.09.049PMID:21979383
53. Terada K, Umeoka S, Usui N, Baba K, Usui K, Fujitani S, et al. Uneven interhemispheric connections between left and right primary sensori-motor areas. Hum Brain Mapp. 2012; 33: 14–26. doi:10.1002/
hbm.21189PMID:21337473
54. Entz L, Toth E, Keller CJ, Bickel S, Groppe DM, Fabo D, et al. Evoked effective connectivity of the human neocortex. Hum Brain Mapp. 2014; 35: 5736–5753. doi:10.1002/hbm.22581PMID:25044884 55. Iwasaki M, Enatsu R, Matsumoto R, Novak E, Thankappen B, Piao Z, et al. Accentuated cortico-cortical
evoked potentials in neocortical epilepsy in areas of ictal onset. Epileptic Disord. 2010; 12: 292–302.
doi:10.1684/epd.2010.0334PMID:20952353
56. Enatsu R, Piao Z, O'Connor T, Horning K, Mosher J, Burgess R, et al. Cortical excitability varies upon ictal onset patterns in neocortical epilepsy: a cortico-cortical evoked potential study. Clin Neurophysiol. 2012; 123: 252–260. doi:10.1016/j.clinph.2011.06.030PMID:21802356
57. Matsumoto R, Ikeda A, Ohara S, Matsuhashi M, Baba K, Yamane F, et al. Motor-related functional sub-divisions of human lateral premotor cortex: epicortical recording in conditional visuomotor task. Clin Neurophysiol. 2003; 114: 1102–1115. PMID:12804679
58. Matsumoto R, Nair D. Cortico-cortical evoked potentials to define eloquent cortex. In: Lüders HO, edi-tor. Textbook of Epilepsy Surgery. London: Informa UK Ltd; 2008. pp 1049–1059.
59. Crone NE, Boatman D, Gordon B, Hao L. Induced electrocorticographic gamma activity during auditory perception. Brazier Award-winning article, 2001. Clin Neurophysiol. 2001; 112: 565–582. PMID:
11275528
60. Yamao Y, Matsumoto R, Kunieda T, Arakawa Y, Kobayashi K, Usami K, et al. Intraoperative dorsal lan-guage network mapping by using single-pulse electrical stimulation. Hum Brain Mapp. 2014; 35: 4345–
4361. doi:10.1002/hbm.22479PMID:24615889
61. Lorente de No R. Cerebral cortex: architecture, intracortical connections, motor projections. In: Fulton JF, editor. Physiology of the nervous system, 3rd edn. Oxford: Oxford University Press; 1949. pp 288–330.
62. Arnold PB, Li CX, Waters RS. Thalamocortical arbors extend beyond single cortical barrels: an in vivo intracellular tracing study in rat. Exp Brain Res. 2001; 136: 152–168. PMID:11206278
63. Gray CM, McCormick DA. Chattering cells: superficial pyramidal neurons contributing to the generation of synchronous oscillations in the visual cortex. Science. 1996; 274: 109–113. PMID:8810245 64. Cunningham MO, Whittington MA, Bibbig A, Roopun A, LeBeau FE, Vogt A, et al. A role for fast
rhyth-mic bursting neurons in cortical gamma oscillations in vitro. Proc Natl Acad Sci U S A. 2004; 101: 7152–7157. PMID:15103017
65. Roopun AK, Middleton SJ, Cunningham MO, LeBeau FE, Bibbig A, Whittington MA, et al. A beta2-fre-quency (20–30 Hz) oscillation in nonsynaptic networks of somatosensory cortex. Proc Natl Acad Sci U
S A. 2006; 103: 15646–15650. PMID:17030821
66. Buffalo EA, Fries P, Landman R, Buschman TJ, Desimone R. Laminar differences in gamma and alpha coherence in the ventral stream. Proc Natl Acad Sci U S A. 2011; 108: 11262–11267. doi:10.1073/
67. Ray S, Maunsell JH. Different origins of gamma rhythm and high-gamma activity in macaque visual cor-tex. PLoS Biol. 2011; 9:e1000610. doi:10.1371/journal.pbio.1000610PMID:21532743
68. Scheffer-Teixeira R, Belchior H, Leao RN, Ribeiro S, Tort AB. On high-frequency field oscillations (>100 Hz) and the spectral leakage of spiking activity. J Neurosci. 2013; 33: 1535–1539. doi:10.1523/ JNEUROSCI.4217-12.2013PMID:23345227
69. Connors BW, Gutnick MJ. Intrinsic firing patterns of diverse neocortical neurons. Trends Neurosci. 1990; 13: 99–104. PMID:1691879
70. Jones MS, MacDonald KD, Choi B, Dudek FE, Barth DS. Intracellular correlates of fast (>200 Hz) elec-trical oscillations in rat somatosensory cortex. J Neurophysiol. 2000; 84: 1505–1518. PMID:10980023 71. Adrian ED. The spread of activity in the cerebral cortex. J Physiol. 1936; 88: 127–161. PMID:16994811 72. Purpura DP, Pool JL, Ransohoff J, Frumin MJ, Housepian EM. Observations on evoked dendritic
potentials of human cortex. Electroencephalogr Clin Neurophysiol. 1957; 9: 453–459. PMID:13447852 73. Goldring S, Harding GW, Gregorie EM. Distinctive electrophysiological characteristics of functionally
discrete brain areas: a tenable approach to functional localization. J Neurosurg. 1994; 80: 701–709.
PMID:8151350
74. Li CL, Chou SN. Cortical intracellular synaptic potentials and direct cortical stimulation. J Cell Comp Physiol. 1962; 60: 1–16. PMID:14464979
75. Sugaya E, Goldring S, O'Leary JL. Intracellular potentials associated with direct cortical response and seizure discharge in cat. Electroencephalogr Clin Neurophysiol. 1964; 17: 661–669. PMID:14240859 76. Crone NE, Korzeniewska A, Franaszczuk PJ. Cortical gamma responses: searching high and low. Int J
Psychophysiol. 2011; 79: 9–15. doi:10.1016/j.ijpsycho.2010.10.013PMID:21081143
77. Ayala GF, Dichter M, Gumnit RJ, Matsumoto H, Spencer WA. Genesis of epileptic interictal spikes. New knowledge of cortical feedback systems suggests a neurophysiological explanation of brief parox-ysms. Brain Res. 1973; 52: 1–17. PMID:4573428
78. Neckelmann D, Amzica F, Steriade M. Changes in neuronal conductance during different components of cortically generated spike-wave seizures. Neuroscience. 2000; 96: 475–485. PMID:10717428 79. Urrestarazu E, Jirsch JD, LeVan P, Hall J, Avoli M, Dubeau F, et al. High-frequency intracerebral EEG
activity (100–500 Hz) following interictal spikes. Epilepsia. 2006; 47: 1465–1476. PMID:16981862 80. Alarcon G, Martinez J, Kerai SV, Lacruz ME, Quiroga RQ, Selway RP, et al. In vivo neuronal firing
pat-terns during human epileptiform discharges replicated by electrical stimulation. Clin Neurophysiol. 2012; 123: 1736–1744. doi:10.1016/j.clinph.2012.02.062PMID:22410162
81. Matsuzaki N, Juhasz C, Asano E. Cortico-cortical evoked potentials and stimulation-elicited gamma activity preferentially propagate from lower- to higher-order visual areas. Clin Neurophysiol. 2013; 124: 1290–1296. doi:10.1016/j.clinph.2013.02.007PMID:23523110
82. Matsumoto R, Kinoshita M, Taki J, Hitomi T, Mikuni N, Shibasaki H, et al. In vivo epileptogenicity of focal cortical dysplasia: a direct cortical paired stimulation study. Epilepsia. 2005; 46: 1744–1749.
PMID:16302853
83. Terada K, Usui N, Umeoka S, Baba K, Mihara T, Matsuda K, et al. Interhemispheric connection of motor areas in humans. J Clin Neurophysiol. 2008; 25: 351–356. doi:10.1097/WNP.
0b013e31818f4fecPMID:18997625
84. Viswanathan A, Freeman RD. Neurometabolic coupling in cerebral cortex reflects synaptic more than spiking activity. Nat Neurosci. 2007; 10: 1308–1312. PMID:17828254
85. Zijlmans M, Huiskamp GM, Cremer OL, Ferrier CH, van Huffelen AC, Leijten FS. Epileptic high-fre-quency oscillations in intraoperative electrocorticography: the effect of propofol. Epilepsia. 2012; 53: 1799–1809. doi:10.1111/j.1528-1167.2012.03650.xPMID:22984839
86. Klostermann F, Funk T, Vesper J, Siedenberg R, Curio G. Propofol narcosis dissociates human intrathalamic and cortical high-frequency (>400 hz) SEP components. Neuroreport. 2000; 11: 2607– 2610. PMID:10943731
87. Urasaki E, Genmoto T, Yokota A, Maeda R, Akamatsu N. Effects of general anesthesia on high-fre-quency oscillations in somatosensory evoked potentials. J Clin Neurophysiol. 2006; 23: 426–430.