1538 Brazilian Journal of Physics, vol. 34, no. 4B, December, 2004
Exploration of Solar Chromosphere Using High
Resolution Spectroscopic Observations
F. R. H. Madsen, H. S. Sawant, F. C. R. Fernandes, and J. R. Cecatto,
Divis˜ao de Astrof´ısica – Instituto Nacional de Pesquisas EspaciaisAv. dos Astronautas, 1758, Pr´edio CEA Novo, sala 10, 12227-010, S˜ao Jos´e dos Campos, SP, Brazil
Received on 14 January, 2004; revised version received on 3 May, 2004
Brazilian Solar Spectroscope (BSS), operating in the frequency range of (1000−2500) MHz with high time and frequency resolutions, has observed various fine structures showing intensity variations as functions of time and frequency. Here we are reporting radio bursts observed by BSS, from August to October/2001, exhibiting fine structures with total duration of the order of 300 ms, covering a frequency range of∼200 MHz. These
characteristics are similar to those of the narrow band type III bursts observed above 1000 MHz. Hence these fine structures are variants of decimetric narrow band type III-like bursts. The fine structures observed exhibit variation of intensity as a function of frequency and curvatures in the frequency-time plane. These fine structures are explained as a propagation effect. We suggest that these structures are the signatures of the chromospheric density inhomogeneities lying in the line-of-sight path between the observer and the radio source. If the emitted frequencies are lower than the plasma frequency of the inhomogeneity, there will be absorption over a certain band, corresponding to the dimension of the inhomogeneity. The curved like structures are due to lower group velocities of the lower frequencies in the density inhomogeneities. The estimated scale sizes of the irregularities obtained are of the order of101
−10
4
km. Thus an alternative method to total solar eclipse observation is suggested for investigations of chromospheric density irregularities.
1
Introduction
Bhonsle et al [1] have reviewed various fine structures obser-ved in meter and decameter wavelengths and have showed their importance in understanding of inhomogeneities in the solar corona. Various fine structures have been reported in decimeter wavelength by various authors ([2] and references therein) and many of these fine structures have been inter-preted as due to various plasma mechanisms. However most of these fine structures were recorded with frequency and time resolutions of 10 MHz and 100 ms respectively. For the first time we are reporting fine structures in decimeter wave-lengths recorded with resolutions better than reported earlier by a factor of 2 and with a higher sensitivity of about 3 s.f.u.. The observed narrow emission gaps∼3 MHz and curva-tures in the time-frequency plane at the low frequency end suggest that these effects can be due to propagation and cau-sed by irregularities in density. Density irregularities in the chromosphere are investigated during the total solar eclipse observations and subtelescopic irregularities have been alre-ady reported in the literature [3]. These investigations of the fine structures in the decimeter wavelength can provide al-ternative methods to investigate density inhomogeneities in the chromosphere.
2
Observations
The Brazilian Solar Spectroscope – BSS – is operating over the frequency range of1000−2500MHz, with high time
(10−1000ms) and frequency (3 MHz) resolutions, in
con-junction with the polar mounted 9 meter diameter parabolic antenna. BSS is a digital spectroscope and its signal can be recorded up to 100 digital frequency channels. Absolute ti-ming accuracy is∼3 ms and the minimum detectable flux is∼3 s.f.u. [4,5].
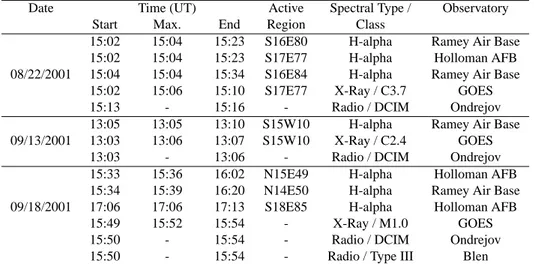
We have selected a sample of events showing emission gaps and curved-like structures in the time-frequency plane. The total number of selected events is 20, of which 13 were analyzable. The data were analyzed using BSSData and BS-SView softwares. The association of the fine structures with the solar activity observed with other instruments is shown in Table 1. It should be noted that most of the observed bursts exhibiting fine structures are associated with active regions near the limb. The spectra shown in the figures are examples of these events.
Figures 1a, 1b and 1c show spectra with emission gaps, corresponding to the absorption of certain frequencies, for different events. Figure 1d shows a curved-like structure at the lower frequencies. Figures 1b and 1c show also delays in the arrival of the lower and higher frequencies respectively, but these delays are in accordance with the normal drift rates observed in type III bursts above 100 MHz [6] and are not due to propagation effects.
3
Interpretations
F. R. H. Madsenet al. 1539
TABLE 1. Type of spectral activity associated with the analyzed events.
Date Time (UT) Active Spectral Type / Observatory Start Max. End Region Class
15:02 15:04 15:23 S16E80 H-alpha Ramey Air Base 15:02 15:04 15:23 S17E77 H-alpha Holloman AFB 08/22/2001 15:04 15:04 15:34 S16E84 H-alpha Ramey Air Base
15:02 15:06 15:10 S17E77 X-Ray / C3.7 GOES 15:13 - 15:16 - Radio / DCIM Ondrejov 13:05 13:05 13:10 S15W10 H-alpha Ramey Air Base 09/13/2001 13:03 13:06 13:07 S15W10 X-Ray / C2.4 GOES
13:03 - 13:06 - Radio / DCIM Ondrejov 15:33 15:36 16:02 N15E49 H-alpha Holloman AFB 15:34 15:39 16:20 N14E50 H-alpha Ramey Air Base 09/18/2001 17:06 17:06 17:13 S18E85 H-alpha Holloman AFB
15:49 15:52 15:54 - X-Ray / M1.0 GOES 15:50 - 15:54 - Radio / DCIM Ondrejov 15:50 - 15:54 - Radio / Type III Blen
Figure 1. Radio bursts with emission gaps∼20MHz, as seen in black color superimposed on the orange background almost at the center
of each frame, for (a) August 22, 2001, (b) September 9, 2001, and (c) September 18, 2001. (d) Radio burst exhibiting curvature at the low frequencies with the same color code as above, for August 22, 2001.
above 1000 MHz. This leads us to suggest that the emission gaps and curvatures at the low frequency ends observed in these type III-like bursts are due to propagation effects cau-sed by the inhomogeneities in the line of sight between the radio source and the observer. Thus emission gaps can be associated with the scale length of the density irregularities transverse to the line-of-sight.
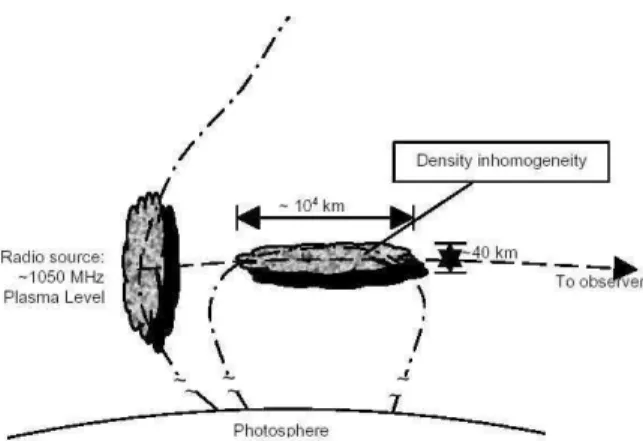
When there is an inhomogeneity in density lying in the line-of-sight path between the observer and the radio source (as shown schematically in Fig. 2), there will be absorp-tion over a certain band of frequencies (Fig. 1a, b and c). Knowing the absorption band, and assuming emission at the
second harmonic due to beam plasma interaction one can estimate the scale size of the irregularity, assuming that the inhomogeneities are close enough to the sources and using an electron density vs. height model [7].
1540 Brazilian Journal of Physics, vol. 34, no. 4B, December, 2004
Figure 2. Schematic view of the possible geometry (not to scale) of the chromospheric electron density irregularities. The excess in density is assumed to be 3%. The magnetic field lines are shown by dash-dotted lines and the exciter beam is assumed to travel along the open field line.
4
Calculations
4.1
Scale sizes of the inhomogeneities
associ-ated with emission gaps
Assuming emission at the second harmonic of the plasma frequency the densities are obtained corresponding to ab-sorption band in the frequency by using the following equa-tion:
fp= 9×10⁻³pNeM Hz (1)
whereNeis the electron number density incm−3. Using
the estimated densities, the height of the source above the photosphere is obtained using the Cili´e & Menzel model [7] for the electronic (chromospheric) densities in relation to the height:
Ne(h) = 10×5.7×1011e
−7.7×10⁻⁴(h−500)cm−3 (2)
wherehis in kilometers, and the 10 factor is due to the ma-ximum of the solar cycle. Densities in the chromosphere and corona vary by a factor of∼10 from minimum to maximum during the solar cycle. Since these observations are during the solar cycle maximum, it is appropriate to include a factor of 10 in the above equation. The difference in the height cor-responding to the absorption band as estimated above is the transverse dimension of the irregularity in the line of sight between the source and the observer.
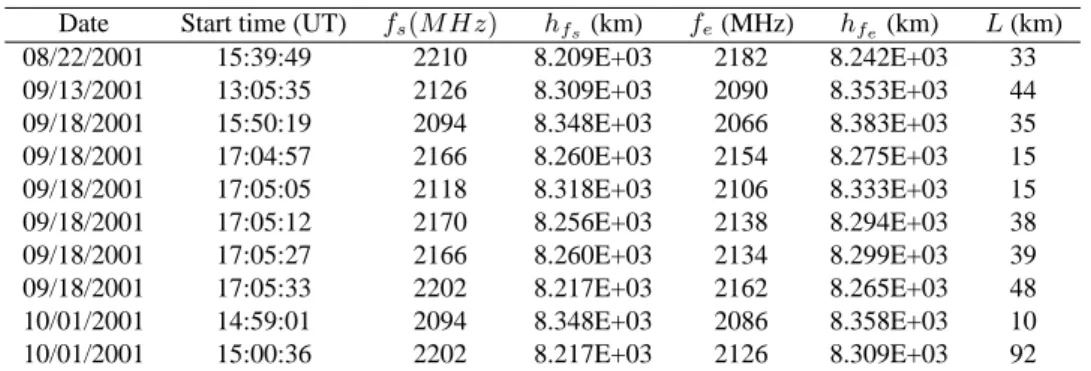
The results obtained for the scale sizes of these irregu-larities are shown in Table 2, where the frequenciesfsand
fe are the starting and the end frequencies of the emission
gap; the heightshfs andhfe are obtained givenfsandfe; andL, the differencehfe−hfs, is the obtained length of the inhomogeneities, transverse to the line-of-sight.
4.2
Dimension of the inhomogeneities
associ-ated with propagation delays
If density inhomogeneities lie in the line-of-sight path between the source and the observer with an excess in den-sity ∼ 3% of the ambient densities, the lower frequen-cies will propagate with lower group velocities and hence delays will be observed in comparison to the higher fre-quencies resulting in the observed curved-like structures in the frequency-time plane. Thus by using the relationship between time delay and densities [8], the length of irregula-rities in the line of sight can be estimated:
∆t= b cω2
l Z
0
N dl (3)
where N is the number density of free electrons, b = 1.6×10³ M KSunits,ω is the angular frequency,cis the
speed of light in vacuum andlis the length of the inhomo-geneity.
The obtained results for the length of these inhomoge-neities are shown in Table 3, wherefavgis the average
fre-quency in the curved-like structures;Nfavgis the local am-bient density of the medium;∆Nis the density of the inho-mogeneity, which is about 3% more thanNfavg; ∆tis the propagation delay of the lower frequencies; andlis the ob-tained dimension of the inhomogeneity along the line-of-sight.
5
Conclusions
Similar results have been obtained in the meter-decameter wavelengths by various researchers as reviewed by Bhonsle et al. [1].
1) Various types of fine structures in the decimetric range suggest the presence of sub telescopic scale density inhomogeneities in the chromosphere.
2) The dimensions of these inhomogeneities transverse to the line-of-sight are in the range of 101
− 102
km and they are associated with the fine structures showing variation of intensity as a function of fre-quency.
3) The dimensions of these irregularities along the line-of-sight are∼7×10⁴km. They are associated with
propagation delays, assuming that the inhomogenei-ties have density excesses∼3% of the ambient den-sity.
F. R. H. Madsenet al. 1541
TABLE 2. Length of the inhomogeneities associated with emission gaps
Date Start time (UT) fs(M Hz) hfs(km) fe(MHz) hfe(km) L(km)
08/22/2001 15:39:49 2210 8.209E+03 2182 8.242E+03 33 09/13/2001 13:05:35 2126 8.309E+03 2090 8.353E+03 44 09/18/2001 15:50:19 2094 8.348E+03 2066 8.383E+03 35 09/18/2001 17:04:57 2166 8.260E+03 2154 8.275E+03 15 09/18/2001 17:05:05 2118 8.318E+03 2106 8.333E+03 15 09/18/2001 17:05:12 2170 8.256E+03 2138 8.294E+03 38 09/18/2001 17:05:27 2166 8.260E+03 2134 8.299E+03 39 09/18/2001 17:05:33 2202 8.217E+03 2162 8.265E+03 48 10/01/2001 14:59:01 2094 8.348E+03 2086 8.358E+03 10 10/01/2001 15:00:36 2202 8.217E+03 2126 8.309E+03 92
TABLE 3. Length of the inhomogeneities associated with propagation delays. Density
Date Start time (UT) favg(MHz) Nfavg(cm
−3) ∆N(cm−3) ∆t(s) l(km)
08/22/2001 15:13:33 2158 1.437E+10 1.480E+10 0.223 1.298E+05 09/13/2001 13:05:24 2123 1.391E+10 1.433E+10 0.088 5.123E+04 09/13/2001 13:05:26 2166 1.448E+10 1.491E+10 0.086 5.006E+04
Acknowledgement
We would like to thank Dr. M. Aschwanden for use-ful discussions and suggestions for the interpretations of the decimetric fine structures.
References
[1] H. S. Bhonsle, H. S. Sawant, and S. S. Degaonkar, Space Sci-ence Reviews, 24, 259 (1979).
[2] F. C. R. Fernandes, Cat´alogo de Espectros Dinˆamicos de Ex-plos˜oes Solares Decim´etricas Registradas pelo Brazilian So-lar Spectroscope (BSS) (2001).
[3] L. N. Kurochka, O. T. Matsuura, and E. Picazzio, Solar Phy-sics, 170, 227 (1997).
[4] H. S. Sawant, K. R. Subramanian, C. Faria, F. C. R. Fernan-des, J. H. A. Sobral, J. R. Cecatto. R. R. Rosa, H. O. Vats, J. A. C. F. Neri, E. M. B. Alonso, F. P. V. Mesquita, V. A. Porte-zani, and A. R. F. Martinon, Solar Physics, 200, 167 (2001). [5] H. S. Sawant, K. R. Subramanian, C. Faria, S. Stephany, F. C.
R. Fernandes, J. R. Cecatto, R. R. Rosa, V. A. Portezani, F. P. V. Mesquita, and E. M. B. Alonso, Astronomical Soceity of the Pacific Conference Series, 206, 347 (2000).
[6] J. L. Mel´endez, H. S. Sawant, F. C. R. Fernandes, and A. O. Benz, Solar Physics, 187, 77 (1999).
[7] G. G. Cili´e and D. H. Menzel, Harvard College Observatory Circular, 410 (1935).