Adenosinetriphosphatases (ATPases)
Gianluca Bartolommei*, Maria Rosa Moncelli, Francesco Tadini-Buoninsegni
Department of Chemistry ‘‘Ugo Schiff’’, University of Florence, Sesto Fiorentino, Italy
Abstract
The detection of small amounts (nanomoles) of inorganic phosphate has a great interest in biochemistry. In particular, phosphate detection is useful to evaluate the rate of hydrolysis of phosphatases, that are enzymes able to remove phosphate from their substrate by hydrolytic cleavage. The hydrolysis rate is correlated to enzyme activity, an extremely important functional parameter. Among phosphatases there are the cation transporting adenosinetriphosphatases (ATPases), that produce inorganic phosphate by cleavage of thec-phosphate of ATP. These membrane transporters have many fundamental physiological roles and are emerging as potential drug targets. ATPase hydrolytic activity is measured to test enzyme functionality, but it also provides useful information on possible inhibitory effects of molecules that interfere with the hydrolytic process. We have optimized a molybdenum-based protocol that makes use of potassium antimony (III) oxide tartrate (originally employed for phosphate detection in environmental analysis) to allow its use with phosphatase enzymes. In particular, the method was successfully applied to native and recombinant ATPases to demonstrate its reliability, validity, sensitivity and versatility. Our method introduces significant improvements to well-established experimental assays, which are currently employed for ATPase activity measurements. Therefore, it may be valuable in biochemical and biomedical investigations of ATPase enzymes, in combination with more specific tests, as well as in high throughput drug screening.
Citation:Bartolommei G, Moncelli MR, Tadini-Buoninsegni F (2013) A Method to Measure Hydrolytic Activity of Adenosinetriphosphatases (ATPases). PLoS ONE 8(3): e58615. doi:10.1371/journal.pone.0058615
Editor:Roman Tuma, University of Leeds, United Kingdom
ReceivedJanuary 3, 2013;AcceptedFebruary 5, 2013;PublishedMarch 5, 2013
Copyright:ß2013 Bartolommei et al. This is an open-access article distributed under the terms of the Creative Commons Attribution License, which permits unrestricted use, distribution, and reproduction in any medium, provided the original author and source are credited.
Funding:This work was supported by Ente Cassa di Risparmio di Firenze (2009.0749) (http://www.entecarifirenze.it) and the Italian Ministry of Education, University and Research (PRIN Project 20083YM37E) (http://hubmiur.pubblica.istruzione.it/web/ricerca/home). The funders had no role in study design, data collection and analysis, decision to publish, or preparation of the manuscript.
Competing Interests:The authors have declared that no competing interests exist. * E-mail: [email protected]
Introduction
Adenosinetriphosphatases (ATPases) are enzymes that produce inorganic phosphate (Pi) by cleavage of thec-phosphate of ATP. Main representative members of this large family are the cation-transport ATPases, e.g. sarcoplasmic reticulum Ca-ATPase (SERCA) [1,2] and Na,K-ATPase [3,4]. These proteins couple ATP hydrolysis to the transport of ionic species against their electrochemical potential gradient.
Ion translocation is normally coupled to ATP hydrolysis through a cyclic sequence of chemical reactions denoted as ‘‘enzymatic cycle’’. The enzymatic cycle includes initial enzyme activation triggered by cation binding, followed by ATP utilization to form a phosphorylated intermediate. The free energy derived from ATP is then utilized by the phosphoenzyme for a conformational transition, that favors displacement and release of the bound cation. Binding of counter-transported ions induces dephosphorylation of the enzyme, followed by release of the counterions during a conformational transition to the initial state [5]. Therefore, Pi detection is useful to evaluate the rate of Pi production by ATPases and the related enzyme activity, an extremely important functional parameter.
Phosphate detection is fundamental in environmental analysis too. In particular, phosphate is an important routine parameter in water analysis, being simultaneously an essential macronutrient and a possible pollutant, when its concentration is abnormally
high. The quantification of phosphate in different water bodies is important since an increase in phosphate concentration in surface waters is usually linked to diffuse sources [6]. On the other hand, phosphorus determination in soil samples provides important information on phosphorus availability for plants [7].
Due to the broad relevance of phosphorus, different phosphate detection methods have been optimized during years. These methods are usually based on the chemistry of molybdenum. In fact, it is well known that phosphate and molybdic acid form a complex that can be reduced to produce a deep-blue-colored complex called molybdenum blue [8]. Classical experimental protocols for Pi detection involve the use of ammonium heptamolybdate in acid environment (HCl or H2SO4), together with a reducing agent such as sodium sulfite [9], stannous chloride [10], phenylhydrazine [11], aminonaphtholsulfonic acid [9], ascorbic acid [12], r-methylaminophenolsulfate [13], N-phenyl-r-phenylenediamine [14] or ferrous sulfate [15]. The choice of the reducing agent is critical for determining the stability of the reduced complex and, moreover, affects the spectroscopic properties of the produced molybdenum blue species [16].
form an antimony-phosphomolybdate complex. This complex can be reduced to an intensely blue-colored complex by one of the reducing agents mentioned above [7,18].
This paper presents, for the first time, the application of the method based on the formation of the antimony-phosphomolyb-date complex to the determination of the hydrolytic activity of ATPases. Following an optimization of the experimental protocol, the method was applied to native and recombinant ATPases to demonstrate its validity, sensitivity and versatility.
Materials and Methods
Chemicals
Sodium azide (extra-pure), sulfuric acid (95–97%, pro-analysi), ammonium heptamolybdate tetrahydrate (pro-analysi), tri-sodium citrate dihydrate (pro-analysi), MgCl2 hexahydrate (pro-analysi), tris(hydroxymethyl)aminomethane (TRIS; pro-analysi), potassium antimony (III) oxide tartrate trihydrate (extra pure), KH2PO4 (suprapur), KCl (suprapur), NaCl (suprapur) and CaCl2(suprapur) were purchased from Merck. L(+)-ascorbic acid (normapur) was from VWR BDH Prolabo. Na2-ATP hydrate and ouabain were purchased from Fluka. Thapsigargin (TG), calcium ionophore A23187 (calcimycin), ethylene glycol-bis(2-aminoethylether)-N,N,N’,N’-tetraacetic acid (EGTA; 97%, for Molecular Biology) and 3-(N-morpholino)propanesulfonic acid (MOPS) were obtained from Sigma.
The water used for the preparation of all solutions was produced by a purification system (Millipore, Direct-Q 5), that eliminates bacterial content through a 0.22mm sterile filter (Millipak 40), reduces Total Organic Carbon content to less than 10mg/l (Quantum EX Ultrapure Organex Cartridge) and lowers
ionic concentration, thus increasing resistivity to a maximum value of 18.2 MV?cm (Progard 2 Pre-treatment pack).
Ethics Statement
Isolation of proteins from rabbit was performed in the Department of Pharmacology, University of Florence, Italy. Animal manipulations were carried out according to the Italian Guidelines for Animal Care (DL 116/92, application of the European Communities Council Directive 86/609/EEC) and approved by the local IACUC (Advisory Committee for Ethical and Juridical Control of the Center for Housing of Laboratory Animals of the University of Florence). All efforts were made to minimize animal sufferings.
Protein preparation
SERCA was isolated from rabbit hind-leg skeletal muscle in the form of native vesicles according to [19]. The obtained vesicles are not permeable to calcium ions. The total protein concentration, determined by the Lowry procedure [20], was 8.4 mg/ml.
Membrane fragments containing the Na,K-ATPase were isolated from rabbit kidneys following the procedure C described in [21]. In this case, the total protein concentration was 2.07 mg/ ml.
Recombinant SERCA (WT and D351N mutant) was expressed in COS-1 cells using adenoviral vectors as previously described [22]. Total protein concentration was 2.6 mg/ml for the WT enzyme (78mg/ml of SERCA, corresponding to 3%) and 11.8 mg/ml for the D351N mutant (0.80 mg/ml of SERCA, corresponding to about 7%). The content of expressed SERCA was evaluated by SDS gel electrophoresis and Western blotting [22].
Coloring solution
The coloring solution employed for Pi determination was composed of sulfuric acid, ascorbic acid, ammonium heptamo-lybdate and potassium antimony (III) oxide tartrate (herein indicated as ‘‘tartrate’’). These compounds produce an antimo-ny-molybdate complex that converts in antimony-phosphomolyb-date when phosphorus is present as inorganic (orto)phosphate ion [7,18]. The latter complex is blue-colored and therefore adsorbs light in the visible range, allowing its use in quantitative analysis. Solutions were always prepared from the following concentrated stocks: 2.5 M H2SO4, 0.3 M ascorbic acid, 4 mM tartrate and 24 mM ammonium heptamolybdate.
Measurement of enzymatic activity
The enzyme (native or recombinant) was incubated (FALC Thermoblock) in a buffer solution at 37uC and the reaction was started by addition of 1 mM ATP. For SERCA, the buffer solution contained 80 mM KCl, 25 mM MOPS (pH 7.0 by TRIS), 3 mM MgCl2, 5 mM sodium azide, 0.2 mM EGTA, 0.2 mM CaCl2 (about 10mM free calcium) and 2mM A23187. In the case of
Na,K-ATPase, the buffer solution was composed by 20 mM KCl, 100 mM NaCl, 25 mM MOPS (pH 7.0 by TRIS) and 3 mM MgCl2. Blank samples were prepared in the absence of calcium ions and in the presence of 2 mM EGTA (SERCA) or in the absence of sodium ions (Na,K-ATPase). Control experiments were performed in the presence of 1mM thapsigargin (SERCA) or
50mM ouabain (Na,K-ATPase). The total protein concentration
was 10mg/mL for native and recombinant (WT) SERCA, 1mg/
mL for Na,K-ATPase and 4.5mg/mL for mutant (D351N)
SERCA.
After incubation, aliquots were taken at subsequent times and immediately added to the coloring solution contained in glass disposable test tubes (Corning, mod. 99445-12). Usually, aliquots of 100mL were added to 900mL of coloring solution, giving a total
final volume of 1 mL. This addition suddenly interrupts the enzymatic ATP hydrolysis, and, therefore, Pi release, due to enzyme denaturation produced by the strong acid conditions.
For each protein, five aliquots, each as triplicate, were taken at different times to plot an activity curve (Pi vs time). Blank was also evaluated as a triplicate. Where indicated, sodium citrate was added from a 10% (w/w) stock 10 minutes after aliquot addition. The calibration curve was determined by preparing standard solutions of Pi from 1 or 0.1 mM aqueous stock solutions.
All measurements were carried out by an UV/Vis spectropho-tometer (Jasco, mod. V-560) provided with a stirring and thermostatable holder (Jasco, mod. EHC-477S). The bandwidth was settled to 2 nm. Acquisition data pitch was 1 s for kinetic measurements and 0.5 nm for spectra registration. Quartz semimicro cuvettes (Hellma, 109.004F-QS) were used to allow continuous stirring of the solution. The temperature was always maintained at 20uC by a Peltier temperature controller (Jasco, mod. EHC-477T).
Statistics
UV/Vis spectra were reproducible with a standard deviation of less than 2%.
Results
In the present work, the optimal experimental conditions (concentration of reagents and detection wavelength) for absor-bance measurements were first determined. The method was then tested on different ATPase enzymes, both in native and recombinant form.
Optimization of the experimental conditions
To determine the optimal concentrations of reagents in the coloring solution, the formation of the antimony-phosphomolyb-date complex and its spectroscopic properties were examined by varying the concentration of a single reagent and maintaining constant that of the other three. Moreover, the amount of Pi was kept constant at 15 nmol for all experiments.
We started by considering the dependence on sulfuric acid concentration. The reaction mixture contained 0.48 mM ammo-nium-heptamolybdate, 6 mM ascorbic acid and 40mM tartrate, plus the desired amount of H2SO4. The reaction was started by addition of Pi to the cuvette under continuous stirring at 20uC. Color development, indicating complex formation, was followed by measuring the absorbance at 710 nm as a function of time.
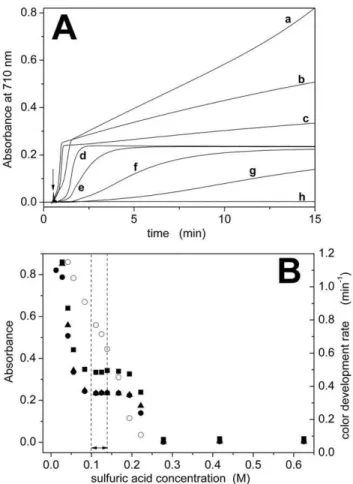
Fig. 1A shows representative color-development curves for different H2SO4 concentrations, whereas Fig. S1 shows the corresponding visible spectra between 400 and 900 nm taken 15 minutes after addition of Pi. We considered a concentration range from 12.5 to 625 mM H2SO4 (Table 1). The color developed more slowly when the acid concentration was higher, whereas a faster initial color development was observed by decreasing acid concentration (Fig. 1A and B). Color development rates were determined as the reciprocal of the time needed to reach half of the stationary absorbance value. Below 80 mM H2SO4a stationary value of the absorbance could not be obtained (Fig. 1A). Therefore, the optimal range of H2SO4concentration for fast and stable color development was 100–140 mM (Fig. 1B and Table 1).
Similar experiments were carried out by varying the concen-trations of the other three reagents one by one within a certain concentration range according to Table 1. For each reagent, an optimal concentration range was found.
By varying the concentration of ammonium heptamolybdate, we observed that color developed very slowly or not developed at all at molybdate concentrations lower than 0.35 mM (Fig. 2A and 2B). On the contrary, color developed rapidly but without attaining a stable absorbance value at concentrations higher than 0.70 mM (Fig. 2A). Therefore, the optimal concentration range for ammonium molybdate was 0.35–0.70 mM (Fig. 2B and Table 1). Representative visible spectra between 400 and 900 nm are reported as (Fig. S2).
Ascorbic acid is the reducing agent that is required for the formation of the molybden-blue complex. Therefore, color development should be slower and/or not complete by decreasing ascorbic acid concentration. This was confirmed in our experi-ments, as reported in Fig. 3A. On the other hand, color development becomes independent on ascorbic acid at concen-trations greater than 3 mM and remains fast and stable in time (Fig. 3A and 3B). Examples of acquired visible spectra between 400 and 900 nm are reported as (Fig. S3). Ascorbic acid should then be present at concentrations greater than 3 mM (Fig. 3B and Table 1).
Finally, tartrate concentration was varied in the range 0.88– 400mM (Table 1). Complex formation was significantly slower
and less efficient at low tartrate concentrations, and became apparently independent on tartrate concentration at higher values
(Fig. 4A and 4B). As a matter of fact, visible spectra show significant changes in the blue-edge region at tartrate concentra-tion higher than 100mM (Fig. S4). This suggests that a different complex was formed under those conditions. Therefore, the optimal concentration range for tartrate was 20–100mM (Fig. 4B and Table 1).
Figs. 1B, 2B, 3B, and 4B also compare absorbance values at 710 and 890 nm. The dependence on reagent concentration is similar at both wavelengths, but the signal is significantly higher at 890 nm. We observed that the signal-to-noise ratio at 890 nm is lower than that at 710 nm (3.5?102with respect to 1?104, see Fig. S5), probably due to the fact that the maximal detection wavelength of our spectrophotometer is 900 nm. Therefore, we selected a detection wavelength of 850 nm to obtain a high signal (.85% with respect to 700 nm, Fig. S5) with a good signal-to-noise ratio (2?103, Fig. S5).
In conclusion, based on the experiments described above we decided to perform absorbance measurements at 850 nm and to prepare a coloring solution with the following composition: 125 mM H2SO4, 0.50 mM ammonium-molybdate, 10 mM ascorbic acid and 40mM tartrate.
Figure 1. Dependence on H2SO4 concentration. (A) Color
development curves determined at 710 nm for different concentrations of sulfuric acid: 12.5 mM (a), 41.7 mM (b), 55.6 mM (c), 139 mM (d), 167 mM (e), 194 mM (f), 222 mM (g) and 625 mM (h). The arrow indicates the addition of 15 nmol of Pi to the cuvette. (B) Dependence of absorbance (
N
, m, &) or color development rate (#) on acidconcentration. Absorbance data were taken from the color develop-ment curves at t = 15 min (
N
) or from the visible spectra (Fig. S1) at 710 nm (m) or 890 nm (&). The dashed lines indicate the optimalTable 1. Optimization of experimental conditions.
Reagent Solution composition Concentration range Optimal concentration range
H2SO4 0.48 mM ammonium-heptamolybdate 12.5–625 mM 100–140 mM
6 mM ascorbic acid 40mM tartrate
Ammonium heptamolybdate 125 mM H2SO4 0.048–4.8 mM 0.35–0.70 mM
6 mM ascorbic acid 40mM tartrate
Ascorbic acid 125 mM H2SO4 0.1–100 mM .3 mM
0.48 mM ammonium heptamolybdate 40mM tartrate
Tartrate 125 mM H2SO4 0.88–400mM 20–100mM
0.48 mM ammonium heptamolybdate 6 mM ascorbic acid
Experimental conditions employed during the optimization procedure. doi:10.1371/journal.pone.0058615.t001
Figure 2. Dependence on ammonium heptamolybdate con-centration.(A) Color development curves measured at 710 nm in the presence of different concentrations of ammonium molybdate: 0.048 mM (a), 0.24 mM (b), 0.36 mM (c), 0.96 mM (d), 1.28 mM (e) and 4.8 mM (f). Inorganic phosphate (15 nmol) was added where indicated by the arrow. (B) Dependence of absorbance (
N
,m,&) or color development rate (#) on ammonium heptamolybdateconcen-tration. Absorbance data were taken from the development curves at t = 15 min (
N
) or from the visible spectra (Fig. S2) at 710 nm (m) and 890 nm (&). The optimal concentration range is indicated by the dashed lines (Table 1).doi:10.1371/journal.pone.0058615.g002
Figure 3. Dependence on ascorbic acid concentration.(A) Color development curves for different concentrations of ascorbic acid at 710 nm: 0.1 mM (a), 0.6 mM (b), 1.5 mM (c), 3 mM (d), 6 mM (e), 30 mM (f) and 100 mM (g). The arrow indicates addition of 15 nmol of Pi to the cuvette to start the reaction. (B) Dependence of absorbance (
N
,m,&)or color development rate (#) on acid concentration. Absorbance data were taken from the color development curves at t = 15 min (
N
) or from the visible spectra at 710 nm (m) and 890 nm (&) (Fig. S3). The dashed and the arrowed line indicate the optimal concentration range (Table 1).Hydrolysis of ATP and color stability
It is known that ATP undergoes hydrolysis in acid conditions. This might be a problem for activity measurements on ATPase enzymes, since acid-released-Pi may be produced, causing a chemical interference [23]. For this reason, we quantified the amount of Pi released by ATP under the acid conditions of the coloring solution (Fig. 5).
Results show that after 1 hour the absorbance increased of about 3% using 1 mM ATP and 30% using 5 mM ATP. Percentages are expressed with respect to the stationary absor-bance value attained in the presence of 15 nmol Pi (Fig. 5). The corresponding amounts of released Pi were 0.45 nmol and 4.5 nmol, respectively, and the rates of ATP hydrolysis 0.45 nmol/h and 4.5 nmol/h.
When determining the hydrolytic activity of ATPases, acid ATP hydrolysis occurs during the time elapsed between addition of the aliquot to the coloring solution and absorbance measurement (‘‘elapsed time’’). Obviously, the interference due to nascent Pi can be minimized using 1 mM ATP, a concentration that is largely sufficient for the activity measurements (see below). Nevertheless, the contribution of the acid-released-Pi should be subtracted from the total Pi using a blank sample (see Materials and Methods). This
correction is acceptable for short elapsed times (Fig. 5). For long elapsed times, addition of sodium citrate might be helpful. In fact, sodium citrate [23] or a citrate-arsenite mixture [24] act as stabilizing agents by chelating molybdenum, thus preventing the detection of nascent inorganic phosphate. This is also shown in Fig. 5 where, in the presence of citrate, the absorbance level remains stable for several hours.
Calibration curve
We then determined the calibration curve at 850 nm and the linearity range extension for the method. It is evident from Fig. 6 that, using the optimized experimental conditions, this method allows the determination of sub-nanomoles of Pi.
In the absence of sodium citrate, the calibration curve remained perfectly linear up to 100 nmol Pi (Fig. 6 and Table 2), and the estimated molar extinction coefficient was about 2.05?105M-1cm-1. However, in the presence of citrate two regions are distinguishable, below and above 40 nmol Pi. Below 40 nmol Pi linearity was still excellent (Table 2), with a molar extinction coefficient in agreement with that determined without citrate (1.90?105 M-1cm-1). Above 40 nmol a linear trend is still observed, but the slope of the calibration curve slightly decreases (Table 2), as if a different chemical species may be present in solution (e= 1.5?105M-1cm-1). However, the presence of citrate has no effect below 40 nmol Pi (Fig. 6, inset B). Representative visible spectra were reported in Fig. S6. Considering that a detectable signal was already present with 0.1 nmol Pi (Fig.6, inset A), with a very good correlation also below 2 nmol Pi (Table 2), the range of linearity for the present method is 0.1–40 or 0.1–100 nmol Pi, with or without citrate, respectively.
ATPase activity determination
To demonstrate the validity of this method, the hydrolytic activities of different ATPases were determined. Activity measure-ments were carried out on native (SERCA and Na,K-ATPase) and recombinant proteins (WT and D351N mutant SERCA) at 37uC. Control experiments were performed in the presence of specific Figure 4. Dependence on potassium-antimony (III) oxide
tartrate concentration. (A) Color development curves acquired at 710 nm for different concentrations of tartrate: 0.88mM (a), 4mM (b), 10mM (c), 40mM (d), 100mM (e) and 400mM (f). The reaction was started by the addition of 15 nmol of Pi (indicated by the arrow). (B) Dependence of absorbance (
N
,m,&) or color development rate (#) on tartrate concentration. Absorbance data were taken from the development curves at t = 15 min (N
) or from the visible spectra (Fig. S4) at 710 nm (m) and 890 nm (&). The optimal concentration range isindicated by the dashed lines (see also Table 1). doi:10.1371/journal.pone.0058615.g004
Figure 5. Color stability.Color development curves monitored for 24 hours under different experimental conditions: 1 mM ATP (a); 1 mM ATP followed by the addition of 3% citrate (b); 5 mM ATP (c); 5 mM ATP followed by the addition of 0.2% citrate (d). The curve obtained in the presence of 15 nmol Pi is also reported for comparison (e). The inset shows the same curves within a smaller time interval (3 hours). From the slope of the curves acquired in the presence of 1 and 5 mM ATP (a and c, respectively), the rate of ATP hydrolysis can be estimated (see text).
inhibitors, i.e. TG for SERCA [25,26] or ouabain for the Na,K-ATPase [27].
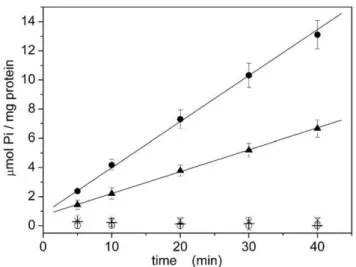
Native SERCA
We first examined SERCA contained in native vesicles (microsomes) and isolated from rabbit skeletal muscle [19]. The measured activity was 4.360.1mmol Pi / (min?mg) (Fig. 7 and Table 3) expressed as average of three independent measurements
6SEM. SERCA content corresponds approximately to 50% of the total protein [1], therefore SERCA hydrolytic activity is about 8–9mmol Pi / (min?mg). Considering a molecular mass of 110 kDa for the protein [28], this value corresponds to a turnover rate of about 15–17 s-1(Table 3).
Enzyme activity was fully blocked by 1mM TG and by removing calcium ions from the solution following addition of 2 mM EGTA (Fig. 7). This confirms the absence of other Ca-dependent phosphatases in the preparation. Moreover, in the absence of the calcium ionophore A23187 the measured hydrolytic activity was significantly lower (0.68 6 0.08mmol Pi / (min?mg); Fig. 7 and Table 3). Hence, the absence of ionophore causes a rise of lumenal Ca2+
concentration to mM values with
rapid saturation of the vesicles by Ca2+
and consequent ‘‘back-inhibition’’ of the pump [29]. This result is also an indirect confirmation that microsomes are not leaky to Ca2+
ions.
Native Na,K-ATPase
Similar measurements were performed on purified (open) membrane fragments containing the Na,K-ATPase (,99%
Na,K-ATPase). An activity value of 11.8 6 0.7mmol Pi /
(min?mg) (average of three independent measurements 6SEM) was determined (Fig. 8 and Table 3). Here again, Pi production by the enzyme was fully blocked by 50mM ouabain and by eliminating sodium ions from the buffer solution (Fig. 8). This indicates that the measured activity is entirely ascribable to the Na,K-ATPase. With a molecular mass of 155 kDa [3], the related turnover rate is about 30 s-1(Table 3).
Recombinant SERCA (WT and D351N)
We then extended this method to recombinant ATPases, that are notoriously produced at significantly lower concentration with respect to native enzymes (see Materials and Methods).
Recombinant (WT) SERCA exhibited a hydrolytic activity of 0.2860.04mmol Pi / (min?mg), considering the total protein (Fig. 9 and Table 3). This value increases to 9.361.3mmol Pi / (min?mg) if we consider the effective SERCA content (3% for this preparation), which is in good agreement with the value determined for the native protein (Table 3). It is worth noting that, due to the low protein concentration, a longer enzymatic reaction time is necessary to detect a Pi concentration with a good signal-to-noise ratio. Therefore, measurements on recombinant Figure 6. Calibration curves.Calibration curves determined in the
absence (#) or in the presence (
N
) of 0.2 % citrate. The parameters obtained from the linear fitting of the experimental data (plain or dashed lines) are summarized in Table 2. The two insets show the same curves for different concentration ranges. A significant absorbance can be measured even in the presence of 0.1 nmol Pi (inset A), whereas the presence of citrate has no effect below 40 nmol Pi (inset B). Error bars represent the SEM of at least three independent measurements and, where not visible, are masked by symbols. Elapsed time: 30 minutes. doi:10.1371/journal.pone.0058615.g006Table 2.Calibration curves.
Sodium citrate Pi concentration range Intercept Slope R Estimatede
(nmol) (nmol-1) (M-1cm-1)
– 0–100 –0.008(1) 0.02048(5) 0,99953 2.05?105
+ 0–2 0.001(1) 0.0202(9) 0.99947 2.0?105
+ 0–40 0.0020(5) 0.01905(6) 0.99983 1.90?105
+ 40–100 0.155(8) 0.0153(1) 0.99905 1.5?105
Fitting parameters for experimental data reported in Fig. 6. The uncertainty on the last digit is indicated between parenthesis. doi:10.1371/journal.pone.0058615.t002
Table 3.Enzyme activity.
Enzyme A23187
Hydrolytic activity
(mmol Pi / (mg?min)) Turnoverrate(s-1)
Total protein SERCA only
Native SERCA present 4.360.1 ,8.5 15.6
absent 0.6860.08 ,1.4 2.6
Native Na,K-ATPase --- 11.860.7 --- 30
Recombinant SERCA (WT) present 0.2860.04 ,9 16.5 absent 0.1560.02 ,0.5 0.9 Hydrolytic activity values, with the corresponding turnover rates, determined for native SERCA, native Na,K-ATPase and recombinant SERCA (WT) at 37uC. In the case of SERCA, the presence or absence of 2mM calcium ionophore (A23187) is specified, and the activity values are expressed with respect to the total protein or to SERCA only (see text).
SERCA were performed over a time period of 40 minutes (Fig. 9), whereas few minutes were sufficient for measurements on native proteins (Figs. 7 and 8). The longer time interval determined a longer elapsed time, and required the use of citrate.
Hydrolytic activity of recombinant SERCA was fully abolished by 1mM TG or by elimination of calcium ions from the buffer solution (Fig. 9). In the absence of calcium ionophore the activity is
approximately halved (0.1560.02mmol Pi / (min?mg), Fig. 9 and Table 3). This demonstrates that ‘‘recombinant’’ microsomes are not leaky to calcium ions, as observed for ‘‘native’’ microsomes.
A further control was carried out by using the catalytically inactive D351N mutant. This mutant can bind calcium ions but is unable to hydrolyze ATP [29], due to mutation of the conserved Asp residue (D351) with an Asn. Accordingly, we found that no inorganic phosphate was produced by the D351N mutant (Fig. 9).
Discussion
The detection of small amounts (nanomoles) of inorganic phosphate has a broad interest that spans from environmental to biochemical fields [6,7,17,18,23,30–32]. The present method optimizes an experimental protocol usually employed for envi-ronmental analysis to allow its use with phosphatase enzymes, such as ATPases. Our method introduces significant improvements to well-established experimental assays, which are currently em-ployed for ATPase activity measurements.
Comparison with other methods
Classical protocols for ATPase activity determination include both coupled-enzyme-based and molybdenum-based methods. An example of the former method is that introduced by Schwartz et al. [33], that makes use of the enzymes pyruvate kinase (PK) and lactate dehydrogenase (LDH) and the reagents phosphoenolpyr-uvate and NADH. In this method, the released phosphate enters a cascade reaction involving firstly PK, that regenerates ATP thanks to the dephosphorylation of phosphoenolpyruvate. The pyruvate so produced, is converted to lactate by LDH with the simultaneous oxidation of NADH. By monitoring the absorbance at 340 nm with a spectrophotometer, the rate of absorbance decrease (correlated to NADH oxidation) can be determined. This rate is proportional to the rate of phosphate release by the ATPase, since the reaction catalyzed by PK and LDH are much faster. Figure 8. Hydrolytic activity of native Na,K-ATPase.Enzymatic
activity of native Na,K-ATPase determined in the presence of sodium ions (
N
, X). Background activity in the absence of sodium ions (#) or inthe presence of 50mM ouabain (X) are also shown. The solid line represent the linear fitting (Y = A+BX) of the experimental data: A = 46
1mmol Pi/mg; B = 10.960.5mmol Pi/(mg?min). Error bars represent the standard deviations of three measurements. Elapsed time: 30 minutes.
doi:10.1371/journal.pone.0058615.g008
Figure 9. Hydrolytic activity for recombinant SERCA.Enzymatic activity for WT recombinant SERCA (
N
,m,#, X) and the D351N mutant(’). Activity was determined in the presence of 10mM free calcium (
N
, m, X,’) and in the presence (N
, X,’) or in the absence (m) of 2mM A23187. Pi release was also quantified in the absence of calcium ions (#) or in the presence of 1mM TG (X). Solid lines represent the linear fitting of the experimental data: A = 0.860.2mmol Pi/mg; B = 0.326 0.02mmol Pi/(mg?min) (+A23187); A = 0.760.3mmol Pi/mg; B = 0.15 60.02mmol Pi/(mg?min) (-A23187). Error bars represent the standard deviations of three measurements. Elapsed time: 90 minutes. doi:10.1371/journal.pone.0058615.g009Figure 7. Hydrolytic activity of native SERCA.Enzymatic activity of native SERCA determined in the presence of 10mM free calcium (
N
, m, X) and in the presence (N
, X) or in the absence (m) of 2mM A23187. As control experiments, Pi release was also quantified in the absence of calcium ions (#) or in the presence of 1mM TG (X). Solid lines represent the linear fitting (Y = A+BX) of the experimental data: A = 361mmol Pi/mg; B = 4.460.3mmol Pi/(mg?min) (+A23187); A = 0.660.3mmol Pi/mg; B = 0.68 6 0.08mmol Pi/(mg?min) (-A23187). Error bars represent the standard deviations of three measurements. Elapsed time: 30 minutes.The enzymatic method of Schwartz et al. [33] is a rapid and easy test that can be performed on ATPases, as reported in the literature [34,35]. On the other hand, PK and LDH enzymes usually need a careful storage (e.g. at -20uC) and their complete functionality has to be checked periodically. Moreover, in case of inhibition studies of ATPases, appropriate control experiments must be carried out to exclude any interference of the inhibitor with the reactions catalyzed by PK and LDH. Obviously, a non-enzymatic method does not require such controls. Incidentally, this also makes a non-enzymatic test more suitable for a possible employment in a high throughput device for automatic drug screening.
On the other hand, a classical experimental molybdenum-based protocol used with ATPases is the Lanzetta method [23]. This method allows the determination of nanomoles of Pi using malachite green as a peculiar agent, that produces a complex with the phospho-molybdate compound [36]. A detergent is also necessary to stabilize the final complex, originally sterox [23] but also tween20 [32,36,37] or TritonX [31] have been used as valid alternatives. In the Lanzetta method the coloring solution needs to be mixed for at least 20 minutes and filtrated before use. The authors also suggested the use of citrate (final concentration,3%)
to block development of nascent Pi due to the acid environment and to the catalytic effect of molybdenum [23]. Under the typical experimental conditions of the Lanzetta method, the ATP acid hydrolysis rate is estimated to be 2.70 nmol Pi/h in the presence of 26mM ATP [23]. Color fully develops in 30 minutes and solutions
have a stability of about 4 hours [23]. We used the Lanzetta method in our previous studies, confirming all these experimental findings [30,38,39].
The method based on potassium-antimony (III) oxide tartrate, described in the present article, has never been applied to ATPase enzymes, to our knowledge. This method appears to be as sensitive as the Lanzetta test (Fig. 6), but introduces some significant experimental advantages:
1.The method has a wide linearity range, from 0.1 nmol to 100 nmol of Pi, if citrate is not employed. The linearity range reduces to 0.1-40 nmol in the presence of citrate (Fig. 6 and Table 2);
2.There is no need to use a detergent nor to perform extensive mixing and filtrate the coloring solution before use. The preparation of the coloring solution is therefore easy and fast; 3.Color develops very rapidly (about 2-3 min, e.g. Fig. 1A) and is
stable for several hours (Fig. 5);
4.Using our method, the ATP acid hydrolysis rate is significantly lower (0.45 nmol/h in the presence 1 mM ATP, Fig. 5) with respect to the Lanzetta method (2.70 nmol/h in the presence of 26mM ATP [23]). Hence, addition of citrate is not necessary for short elapsed times (as in the case of native proteins);
5.When citrate becomes necessary, a final concentration of 0.2% is sufficient to stabilize color (Fig. 5), with respect to ,3% as
reported by [23]. This significantly reduces the consumption of this reagent.
It is worth noting that the molybdenum blue produced in this manner has a maximum of absorption at 850 nm (Fig. S6), indicating that a different reduced species is formed with respect to the Lanzetta method (maximum wavelength 660 nm).
For all these reasons, this method turns out to be a new, fast, stable, reliable and sensitive system to detect nanomoles of Pi released by ATPases.
Application to ATPase enzymes
Our method was successfully applied to both native and recombinant ATPases. Whereas native ATPases can be isolated in high concentration, at present recombinant proteins can only be produced at low yield. To limit the use of recombinant protein, we need a sensitive experimental method, which is able to detect low amounts of analyte with a good signal-to-noise ratio.
Using the present method we determined the hydrolytic activity of both native and recombinant ATPases, and we obtained experimental results (i.e. activities and turnover rates) in agree-ment with those reported in the literature. In particular, knowing the molecular mass of the enzyme we calculated turnover rates from the measured hydrolytic activities (Table 3). We found that SERCA (both native and recombinant) has a turnover rate of 15– 17 s-1, whereas a rate of 30 s-1was obtained in the case of native Na,K-ATPase. The SERCA turnover rate agrees with that reported in the literature at the same temperature (37uC) [40]. The turnover rate calculated for Na,K-ATPase is lower with respect to the values reported by Clarke and colleagues [41,42], probably because some of the Na,K-ATPase molecules are denaturated or for some reason inactive in our preparation. However, lower values for the Na,K-ATPase activity (and hence the turnover rate) at 37uC, similar to that obtained in our measurements, were also reported [43,44].
In the case of SERCA, the turnover is slower in the absence of the calcium ionophore A23187, due to excessive Ca2+
accumu-lation into the microsomes. By comparing the turnover rates in the absence of A23187 for native and recombinant SERCA (2.6 s-1vs 0.9 s-1; Table 3), it appears that ATP-dependent Ca2+
accumu-lation into ‘‘native’’ microsomes is about 3 times faster with respect to ‘‘recombinant’’ microsomes.
Conclusions
A sensitive, fast, sound, reliable and experimentally simple method was developed to determine hydrolytic activity of phosphatases. The method can be easily applied to ATPase enzymes, membrane proteins with many important physiological roles that are emerging as potential drug targets [45,46]. The measurement of ATPase hydrolytic activity is necessary to test enzyme functionality, but it is also useful to reveal possible inhibitory effects of molecules that interfere with the hydrolytic process. Therefore, this method may be valuable in biochemical and biomedical investigations of ATPase enzymes, in combination with more specific tests, as well as in high throughput drug screening.
Supporting Information
Figure S1 Dependence on H2SO4 concentration. Visible spectra acquired for different H2SO4concentrations as indicated in the legend.
(TIF)
Figure S2 Dependence on ammonium heptamolybdate concentration.Visible spectra acquired for different ammonium heptamolybdate concentrations (see legend).
(TIF)
Figure S3 Dependence on ascorbic acid concentration.
Visible spectra corresponding to different ascorbic acid concen-trations according to the legend.
(TIF)
Figure S4 Dependence on potassium-antimony (III) oxide tartrate concentration. Visible spectra acquired for different tartrate concentrations (see legend).
Figure S5 Signal-to-noise ratio. (A) Representative station-ary absorbance levels determined in the presence of 20 nmol Piat different wavelengths (see legends). (B) Dependence of the absorbance (N) and of the signal-to-noise ratio (#) on the working
wavelength. Absorbance was normalized with respect to the value attained at 700 nm. The signal-to-noise ratio at each wavelength is given by the ratio of the average absorbance to the corresponding standard deviation. Averages were calculated over a time period of 4 minutes for each trace in panel A. The normalized absorbance and signal-to-noise ratio at the selected wavelength of 850 nm are indicated by the dashed lines.
(TIF)
Figure S6 Dependence on phosphate concentration.
Visible spectra acquired for different phosphate concentrations
(see legend). The coloring solution had the composition deter-mined after the optimization procedure (see text).
(TIF)
Acknowledgments
The authors are grateful to Prof. Giuseppe Inesi for providing them with recombinant SERCA.
Author Contributions
Acquisition of funding: MRM. Conceived and designed the experiments: GB MRM. Performed the experiments: GB. Analyzed the data: GB. Wrote the paper: GB FTB.
References
1. Inesi G, Toyoshima C (2004) Catalytic and transport mechanism of the Sarco-(Endo)Plasmic reticulum Ca2+-ATPase (SERCA). In: Futai M, Wada Y, Kaplan JH, editors. Handbook of ATPases: Biochemistry, Cell Biology, Pathophysiol-ogy. Weinheim: Wiley-VCH. pp. 63–87.
2. Møller J V, Nissen P, Sørensen TL-M, Le Maire M (2005) Transport mechanism of the sarcoplasmic reticulum Ca2+-ATPase pump. Curr Opin Struct Biol 15: 387–393.
3. Kaplan JH (2002) Biochemistry of Na,K-ATPase. Annu Rev Biochem 71: 511– 535.
4. Jørgensen PL, Hakansson KO, Karlish SJD (2003) Structure and mechanism of Na,K-ATPase: Functional Sites and Their Interactions. Annu Rev Physiol 65: 817–849.
5. De Meis L, Vianna AL (1979) Energy interconversion by the Ca2+-dependent ATPase of the sarcoplasmic reticulum. Annu Rev Biochem 48: 275–292. 6. Mesquita RBR, Ferreira MTSOB, To´th I V, Bordalo AA, McKelvie ID, et al.
(2011) Development of a flow method for the determination of phosphate in estuarine and freshwaters--comparison of flow cells in spectrophotometric sequential injection analysis. Anal Chim Acta 701: 15–22.
7. Matula J (2011) Determination of dissolved reactive and dissolved total phosphorus in water extract of soils. Plant Soil Environ 57: 1–6.
8. Ernster L, Lindberg O (1956) Determination of organic phosphorus compounds by phosphate analysis. Methods Biochem Anal 3: 1–22.
9. Fiske CH, Subbarow Y (1925) The colorimetric determination of phosphorus. J Biol Chem 66: 375–400.
10. Osmond MF (1887) Sur une reaction pouvant servir on dosage coloimetrique du phospore dans le fontes, les aciers, etc. Bull Soc Chim 47: 745–749. 11. Taylor AE, Miller CW (1914) On the estimation of phosphorus in biological
material. J Biol Chem 18: 215–224.
12. Lowry OH, Lopez JA (1946) The determination of inorganic phosphate in the presence of labile phosphate esters. J Biol Chem 162: 421–428.
13. Power MH (1953) Standard Methods of Clinical Chemistry. New York :Academic Press.
14. Dryer RL, Tammes AR, Routh JI (1957) The determination of phosphorus and phosphatase with N-phenyl-p-phenylenediamine. J Biol Chem 225: 177–183. 15. Taussky HH, Shorr E (1953) A microcolorimetric method for the determination
of inorganic phosphorus. J Biol Chem 202: 675–685.
16. Katewa SD, Katyare SS (2003) A simplified method for inorganic phosphate determination and its application for phosphate analysis in enzyme assays. Anal Biochem 323: 180–187.
17. D’Angelo E, Crutchfield J, Vandiviere M (2001) Rapid, sensitive, microscale determination of phosphate in water and soil. J Environ Qual 30: 2206–2209. 18. U.S. Environmental Protection Agency (2005) Standard Operating Procedure for Particulate-Phase Total Phosphorous by Persulfate Oxidation Digestion (LG209, Revision 06).
19. Eletr S, Inesi G (1972) Phase changes in the lipid moieties of sarcoplasmic reticulum membranes induced by temperature and protein conformational changes. Biochim Biophys Acta 290: 178–185.
20. Lowry OH, Rosebrough NJ, Farr AL, Randall RJ (1951) Protein measurement with the Folin phenol reagent. J Biol Chem 193: 265–275.
21. Jørgensen PL (1974) Isolation of (Na+plus K+)-ATPase. Methods Enzymol 32: 277–290.
22. Liu Y, Pilankatta R, Lewis D, Inesi G, Tadini-Buoninsegni F, et al. (2009) High-yield heterologous expression of wild type and mutant Ca2+ ATPase: Characterization of Ca2+binding sites by charge transfer. J Mol Biol 391: 858–871.
23. Lanzetta PA, Alvarez LJ, Reinach PS, Candia OA (1979) An improved assay for nanomole amounts of inorganic phosphate. Anal Biochem 100: 95–97. 24. Baginski ES, Epstein E, Zak B (1975) Review of phosphate methodologies. Ann
Clin Lab Sci 5: 399–416.
25. Sagara Y, Inesi G (1991) Inhibition of the Sarcoplasmic-Reticulum Ca2+ Transport Atpase by Thapsigargin at Subnanomolar Concentrations. J Biol Chem 266: 13503–13506.
26. Lytton J, Westlin M, Hanley MR (1991) Thapsigargin Inhibits the Sarcoplasmic or Endoplasmic-Reticulum Ca-ATPase Family of Calcium Pumps. J Biol Chem 266: 17067–17071.
27. Ogawa H, Shinoda T, Cornelius F, Toyoshima C (2009) Crystal structure of the sodium-potassium pump (Na+,K+-ATPase) with bound potassium and ouabain. Proc Natl Acad Sci U S A 106: 13742–13747.
28. Møller J V, Olesen C, Winther AM, Nissen P (2010) The sarcoplasmic Ca2+ -ATPase: design of a perfect chemi-osmotic pump. Q Rev Biophys: 1–66. 29. Tadini-Buoninsegni F, Bartolommei G, Moncelli MR, Guidelli R, Inesi G (2006)
Pre-steady state electrogenic events of Ca2+/H+exchange and transport by the Ca2+-ATPase. J Biol Chem 281: 37720–37727.
30. Bartolommei G, Tadini-Buoninsegni F, Moncelli MR, Gemma S, Camodeca C, et al. (2011) The Ca2+-ATPase (SERCA1) is inhibited by 4-aminoquinoline derivatives through interference with catalytic activation by Ca2+, whereas the ATPase E2 state remains functional. J Biol Chem 286: 38383–38389. 31. Billington RA, Thuring JW, Conway SJ, Packman L, Holmes AB, et al. (2004)
Production and characterization of reduced NAADP (nicotinic acid-adenine dinucleotide phosphate). Biochem J 378: 275–280.
32. Grimaud R, Kessel M, Beuron F, Steven AC, Maurizi MR (1998) Enzymatic and structural similarities between the Escherichia coli ATP-dependent proteases, ClpXP and ClpAP. J Biol Chem 273: 12476–12481.
33. Schwartz AK, Nagano M, Nakao M, Lindenmayer GE, Allen JC (1971) The sodium- and potassium-activated adenosinetriphosphatase system. Methods Pharmacol 1: 368–371.
34. Bartolommei G, Gramigni E, Tadini-Buoninsegni F, Santini G, Moncelli MR (2010) Confining the sodium pump in a phosphoenzyme form: the effect of lead(II) ions. Biophys J 99: 2087–2096.
35. Habeck M, Cirri E, Katz A, Karlish SJ, Apell H-J (2009) Investigation of electrogenic partial reactions in detergent-solubilized Na,K-ATPase. Biochem-istry 48: 9147–9155.
36. Hess HH, Derr JE (1975) Assay of inorganic and organic phosphorus in the 0.1-5 nanomole range. Anal Biochem 63: 607–613.
37. Chalvardjian A, Rudnicki E (1970) Determination of lipid phosphorus in the nanomolar range. Anal Biochem 36: 225–226.
38. Bartolommei G, Devaux N, Tadini-Buoninsegni F, Moncelli M, Apell H-J (2008) Effect of clotrimazole on the pump cycle of the Na,K-ATPase. Biophys J 95: 1813–1825.
39. Gemma S, Camodeca C, Brindisi M, Brogi S, Kukreja G, et al. (2012) Mimicking the Intramolecular Hydrogen Bond: Synthesis, Biological Evalua-tion, and Molecular Modeling of Benzoxazines and Quinazolines as Potential Antimalarial Agents. J Med Chem 55: 10387–10404.
40. Peinelt C, Apell H-J (2004) Time-resolved charge movements in the sarcoplasmatic reticulum Ca-ATPase. Biophys J 86: 815–824.
41. Lu¨pfert C, Grell E, Pintschovius V, Apell HJ, Cornelius F, et al. (2001) Rate limitation of the Na(+),K(+)-ATPase pump cycle. Biophys J 81: 2069–2081. 42. Noske R, Cornelius F, Clarke RJ (2010) Investigation of the enzymatic activity of
the Na+,K+-ATPase via isothermal titration microcalorimetry. Biochim Biophys Acta 1797: 1540–1545.
43. Lin SH, Faller LD (2000) Preparation of Na,K-ATPase specifically modified on the anti-fluorescein antibody-inaccessible site by fluorescein 5’-isothiocyanate. Anal Biochem 287: 303–312.
44. Forbush B (1988) Rapid 86Rb release from an occluded state of the Na,K-pump reflects the rate of dephosphorylation or dearsenylation. J Biol Chem 263: 7961– 7969.
45. Yatime L, Buch-Pedersen MJ, Musgaard M, Morth JP, Lund Winther AM, et al. (2009) P-type ATPases as drug targets: tools for medicine and science. Biochim Biophys Acta 1787: 207–220.